Sector Detector: Investors whistle past the graveyard as valuation multiples surge
 by Scott Martindale
President & CEO, Sabrient Systems LLC
Stocks continued their bullish charge from the pandemic selloff low on 3/23/20 into early-June, finally stumbling over the past several days due to a combination of overbought technicals, a jump in COVID cases as the economy tries to reopen, and the Fed giving grim commentary on the pace of recovery. But then of course Fed chair Jerome Powell (aka Superman) swooped in this week to save the day, this time to shore up credit markets with additional liquidity by expanding bond purchases into individual corporate bonds rather than just through bond ETFs. But despite unprecedented monetary and fiscal policies, there are many prominent commentators who consider this record-setting recovery rally to be an unwarranted and unsustainable “blow-off top” to a liquidity-driven speculative bubble that is destined for another harsh selloff. They think stocks are pricing in a better economy in the near-term than we enjoyed before the pandemic hit, when instead normalization is likely years away.
Certainly, the daily news and current fundamentals suggest that investors should stay defensive. But stocks always price a future vision 6-12 months in advance, and investors are betting on better times ahead. Momentum, technicals, fear of missing out (FOMO), and timely actions from our Federal Reserve have engendered a broad-based bullish foundation to this market that appears much healthier than anything displayed over the past five years, which was marked by cautious sentiment due to populist upheaval, political polarization, Brexit, trade wars, an attempt to “normalize” interest rates following several years of zero interest-rate policy (ZIRP), and the narrow leadership of the five famed mega-cap “FAAAM” Tech stocks – namely Microsoft (MSFT), Apple (AAPL), Amazon (AMZN), Alphabet (GOOG), and Facebook (FB).
Equal-weight indexes solidly outperformed the cap-weighted versions during the recovery rally from the selloff low on 3/23/20 through the peak on 6/8/20. For example, while the S&P 500 cap-weighted index returned an impressive +45%, the equal weight version returned +58%. Likewise, expanded market breadth is good for Sabrient, as our Baker’s Dozen portfolios ranged from +62% to +83% (and an average of +74%) during that same timeframe, led by the neglected small-mid caps and cyclical sectors. Our Forward Looking Value, Small Cap Growth, and Dividend portfolios also substantially outperformed – and all of them employ versions of our growth at a reasonable price (GARP) selection approach.
Although the past week since 6/8/20 has seen a pullback and technical consolidation, there remains a strong bid under this market, which some attribute to a surge in speculative fervor among retail investors. There is also persistently elevated volatility, as the CBOE Volatility Index (VIX) has remained solidly above the 20 fear threshold since 2/24/20, and in fact has spent most of its time in the 30s and 40s (or higher) even during the exuberant recovery rally. And until earnings normalize, the market is likely to remain both speculative and volatile.
Regardless, so long as there is strong market breadth and not sole dependence on the FAAAM stocks (as we witnessed for much of the past five years), the rally can continue. There are just too many forces supporting capital flow into equities for the bears to overcome. I have been predicting that the elevated forward P/E on the S&P 500 might be in store for further expansion (to perhaps 23-25x) before earnings begin to catch up, as investors position for a post-lockdown recovery. Indeed, the forward P/E hit 22.5x on 6/8/20. But I’d like to offer an addendum to this to say that the forward P/E may stay above 20x even when earnings normalize, so long as the economy stays in growth mode – as I expect it will for the next few years or longer as we embark upon a new post-recession expansionary phase. In fact, I believe that rising valuation multiples today, and the notion that the market actually has become undervalued, are a direct result of: 1) massive global liquidity, 2) ultra-low interest rates, and 3) the ever-growing dominance of secular-growth Technology on both our work processes and the broad-market indexes – all conspiring to create a TINA (“There is No Alternative”) climate for US equities.
In this periodic update, I provide a market commentary, offer my technical analysis of the S&P 500, and review Sabrient’s latest fundamentals-based SectorCast rankings of the ten US business sectors, and serve up some actionable ETF trading ideas. In summary, while our sector rankings look neutral (as you might expect given the poor visibility for earnings), the technical picture is bullish, and our sector rotation model moved to a bullish posture in late May.
As a reminder, Sabrient has enhanced its forward-looking and valuation-oriented stock selection strategy to improve all-weather performance and reduce relative volatility versus the benchmark S&P 500, as well as to put secular-growth companies (which often display higher valuations) on more equal footing with cyclical-growth firms (which tend to display lower valuations). You can find my latest Baker’s Dozen slide deck and commentary on terminating portfolios at http://bakersdozen.sabrient.com/bakers-dozen-marketing-materials. Read on....
Market Commentary:
The five FAAAM stocks have been doing most of the heavy lifting for the broad cap-weighted market indexes like the S&P 500 and Nasdaq 100 for the past five years, which has not been particularly healthy for the broader stock market nor for most value-oriented strategies. Indeed, much like in 2018 when I warned that the summer market rally on the backs of defensives and mega-cap Tech would likely fail without broadening into cyclicals and smaller caps, it was imperative that the recovery rally from the COVID selloff needed to be broad. And broad it has been, as many stocks across the board recovered rapidly or hit all-time highs despite uncertainty about the pace of reopening the economy leading to reduced aggregate EPS estimates and pulled guidance.
You may have heard about all the new accounts being opened by millennials and Gen-Zers on Robinhood, E*TRADE, Schwab, Ameritrade, and Interactive Brokers, among others – which Jeffrey Gundlach of DoubleLine Capital believes has led to “unnerving” market distortions due to a surge in speculative investing from this cohort. Burton Malkiel of Wealthfront calls it a “daytrading pandemic.” To an extent, it’s been attributed to a mix of work-from-home, shelter-in-place, and a lack of sports to bet on (so, “let’s instead gamble on stocks!”). Some online brokers are even offering fractional shares of the pricier stocks (like AMZN) to make it even easier for anyone to invest. However, although there indeed have been many days of distorted market behavior led by Tech darlings in which the Nasdaq Composite was up strongly while the other indexes were solidly down (and it actually hit a new all-time high last week), overall market breadth has been quite impressive during the recovery rally as illustrated by the outperformance of the equal-weighted indexes.
Indeed, market breadth since the 3/23/20 low has been encouraging, and in fact its persistence will be essential to a continuation of the rally. Recall that it was mid-2015 when the market became cautious and news-driven and the “FANG” acronym was born. So, to illustrate the narrow leadership of the five FAAAM stocks that has otherwise dominated the tumultuous market of the past five years, let’s make some comparisons. Keep in mind, FAAAM today represents about 20% of the cap-weighted S&P 500 index but only about 1% of the equal weight index. Below is a chart of FAAAM versus the cap-weighted (SPY) and equal-weighted (RSP) S&P 500 from 6/1/15 through the recent selloff recovery peak on 6/8/20. SPY and RSP are the bottom two lines. AMZN alone is up 486%:
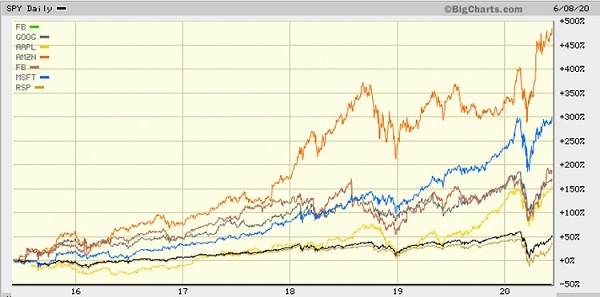
Let’s drill down a bit. From 6/1/15 through the selloff low on 3/23/20, FAAAM averaged +165% (AMZN was up 342% all by itself), which was exactly 10 times the +16.5% return of the S&P 500 and explains why the S&P 500 Equal Weight (RSP) lagged badly with a loss of -4.7%. Furthermore, from 6/11/18 (when our trade war with China escalated and created a stark market bifurcation between mega-caps and defensive sectors versus small-mid caps and cyclical sectors) through 3/23/20, FAAAM averaged about +8.3% (although FB was a laggard at -22.7%). The group in aggregate contributed about +2.7% toward the index’s -16.7% return, which means the rest of the index lost a weighted aggregate of nearly -20%, and so the RSP again lagged badly at -28.3%. And from the start of this year through the 3/23/20 low, while the S&P 500 lost -30.3%, FAAAM’s weighted aggregate contribution to the index was -3.2%, which means that the rest of the index lost a combined -27.2%, and the RSP was down -37.5%. Such narrow leadership is not conducive to the long-term health of a bull market.
However, let’s look at the two latest periods of risk-on rotation. First, during the 8/27/19–12/19/19 rally led by value, cyclicals, and small caps, the FAAAM stocks contributed only +3.7% toward the cap-weighted SPY +12.4% return, so the equal-weight RSP was able to slightly outperform at +12.7%. And for the latest 3/23/20–6/8/20 pandemic recovery rally, FAAAM contributed only +8.5% toward the SPY return of +45.0%, which means the rest of the index contributed the other +36.5%, and explains why the equal-weight RSP solidly outperformed with a return of +57.8%.
Valuations:
DataTrek observed that the Growth factor outperformed during both the pandemic sell-off and the recovery, led by Technology stocks (many of which thrived during the lockdown) such that, “growth stocks are now trading at valuation levels not seen since the tech bubble.” Likewise, ProShares noted that the price-to-book ratio of growth stocks versus value stocks has reached 3.5x, which is the highest since the Tech Bubble.
So, while I agree that it is time for the Value factor to shine once again, I don’t think Technology, which has propelled the Growth factor, is in a valuation bubble ready to implode. Tech is quite different today versus the speculative bubble of 2000. Profitability, cash flow generation, and cash balances throughout the sector are all much higher today than in 2000, while the cost of capital is much lower. Most companies within the sector enjoy steady and reliable secular growth stories (rather than the more volatile cyclical growth). All of this allows for higher valuation multiples for Tech stocks – and by extension the cap-weighted indexes like the S&P 500, versus when it was dominated by capital-intensive or commodity-price-dependent companies.
It is interesting to look back at the “olden days” – way, way back in, say, 2005. Can you even recall those simpler times (smirk)? The ten largest market-cap companies in the world, in descending order, were GE, XOM, MSFT, C, BP, WMT, RDS, JNJ, PFE, and BAC. The list was dominated by capital-intensive cyclical-growth Industrial, Financial, and Consumer names, including three oil companies (XOM, BP, RDS). In fact, as recently as 2013, XOM was still competing with AAPL for the top spot as the largest publicly traded company. But today, of course, secular-growth Technology has not only taken over the world but also the stock market, led by MSFT, AAPL, AMZN, GOOG, FB, Alibaba (BABA), and Tencent (TCEHY) as the top 7, followed by non-Techs BRK, V, and JNJ. Only MSFT and JNJ have held their ground through the years, and China has placed two Tech names (BABA and TCEHY) on this Top-10 list, whereas several years ago it had PetroChina (PTR) and Industrial and Commercial Bank of China (IDCBF). Remarkably, XOM and its Energy sector brethren have lagged so much over the past several years that each of the four largest Tech stocks (MSFT, AAPL, AMZN, GOOG) is larger by itself than the aggregate market cap of the entire Energy sector within the S&P 500 (about $770 billion – including XOM, CVX, PSX, COP, EOG, VLO, plus others). It’s a fascinating evolution.
Today, we find the cap-weighted broad-market indexes at elevated valuations relative to history, including the S&P 500 hitting 22.5x on 6/8/20. Even at its 3/23/20 selloff low, the index still displayed a forward P/E of about 17x, compared to about 10x on the 3/9/09 low during the Financial Crisis. But as I mentioned at the outset, I think there is still room for further expansion (to perhaps 23-25x) before earnings start to catch up, as investors position ahead of a post-lockdown recovery. And even when earnings have normalized over the next few years, I think the forward P/E can remain above 20x so long as the economy stays in expansionary mode. Why? Because of all the “ducks” lining up behind both the economy and the stock market. In fact, a year from now the economy may be larger and even healthier than it was when it peaked on 2/19/20 (at a forward P/E of about 19x). Those “ducks” include:
- the pandemic falling well short of the dire lethality predictions of the early models, and success in “flattening the curve”
- unprecedented worldwide collaboration on development of COVID-19 treatments and vaccines, and fast-tracking of human trials
- massive monetary and fiscal policy support (which could reach $10 trillion), ZIRP for the foreseeable future (until 2023, at least), and the fastest M2 money supply growth rate in history (25%)
- reduction in credit risk bringing down both investment grade and high yield spreads
- low interest rates driving retirees and other income seekers into the higher yields and returns of equities
- economic data coming in at or better than forecast
- rising tension with China seemingly more bluster than action so far, while the focus is on economic recovery
- massive short covering and a bullish stance among algorithmic traders
- the growing dominance and consistent performance of the large secular-growth Technology companies
- a rapidly growing flood of investment capital chasing a limited supply of public equities
So, which sectors might lead the next leg of the broad-based recovery rally? Although Technology could see a bit more multiple expansion, the XLK is already at 26.2x, while Consumer Discretionary (XLY) is at 34.1x, so it would be preferable to see leadership from value-oriented Healthcare (XLV) at 17.5x and Financial (XLF) at 16.0x, within the S&P 500, as well as outperformance in small and mid-cap indexes. Leadership from the Value factor would be helpful for a healthy and sustainable market rise.
The economy, the Fed, and interest rates:
The May jobs report shocked everyone with an increase of 2.5 million, easily beating the consensus expectation of a decline of -7.7 million. The expectation was so far off that it really makes you wonder in this rapidly evolving environment whether any forecasting models can be trusted. Leisure & Hospitality alone added 1.2 million jobs, while Government jobs fell by 585,000. Blue-collar jobs in Construction and Manufacturing jobs showed solid gains. The unemployment rate dropped to 13.3% in May from 14.7% in April, versus consensus expectation of 19.0%, although many critics can poke holes in who is being counted (e.g., furloughs versus layoffs). The largest gains in jobs in May were at restaurants & bars, while construction, healthcare and social assistance, retail, and manufacturing all saw significant gains. In addition, there were other encouraging economic reports, like a record 17.7% spike in May retail sales and word of an impending $1 trillion infrastructure bill coming down the pike from the Trump Administration.
Despite such promising developments, Q2 GDP surely will be ugly, with the consensus of economists expecting a -28% year-over-year decline. But consensus is projecting unprecedented year-over-year GDP growth for Q3 and Q4, in a rapid recovery across most segments of the economy, and GDP for full-year 2021 is expected to grow by 5% over 2020. Thankfully, commitment to the Phase 1 trade deal with China seems to be intact from both sides. As for the federal budget for FY2021, the Trump Administration’s proposed budget is a record $4.829 trillion.
As of 6/18/20, the 30-year Treasury yield sat at 1.490%, while the 10-year T-note is 0.71%, the 2-year T-note 0.19%, and the 3-month T-bill 0.16%. So, the 3-month/10-year spread is about +55 bps, while the more closely followed 2-10 spread is +52 bps, as the Fed is essentially controlling the yield curve. Looking ahead, Fed Funds Futures give 100% probability that zero interest rate policy (ZIRP) will remain through March 2021. As Fed chair Powell declared, “We’re not even thinking about thinking of raising rates,” which left no uncertainty about zero interest rate policy (ZIRP) until at least 2023. Recall that last month, Mr. Powell asserted, “This is not the time to act on those concerns [about the government taking on excessive debt]. This is the time to use the great fiscal power of the United States to do what we can to support the economy and try to get through.”
Moreover, this week Mr. Powell decided it was time once again to put on his white hat and spurs, guns blazing, and ride to the rescue, boosting the market on Monday (reversing a big down day) with an announcement that the Fed will start purchasing individual corporate bonds that meet their criteria under the central bank’s Secondary Market Corporate Credit Facility, using an indexing approach that incorporates all bonds in the secondary market that meet the Fed’s criteria. As you recall, the Fed had been purchasing bonds only through the iShares iBoxx ETFs – specifically the Investment Grade (LQD) and High Yield (HYG) – under the same facility, the announcement of which came on 3/23/20, helping to staunch the selloff and reverse into a strong recovery. Who said the adage “Don’t Fight the Fed” was dead?
I think it bears repeating from my commentary last month that, as companies adopt technological innovations and other cost-cutting and productivity boosters, operating leverage will continue to expand, which means that they can achieve higher earnings on lower revenues despite rising wages. Nevertheless, there surely will be structural changes that squeeze margins, primarily to address the dominant (and long-simmering) topics of the day, including wealth inequality and systemic racism (which I think is a subset of the broader human condition that I call “not-like-me-ism”) that have caused so much disillusionment in our institutions. Globalism, interventionism, the Rule of Law, and equal application of justice suddenly are all on trial.
Ultimately, we may start to see rising inflation driven by a restructuring of global supply chains, onshoring of manufacturing, and a decline in global trade as a percentage of GDP. The liquidity spigot is already wide open as the Federal Reserve and US Treasury are working in concert to keep the economy afloat, juice inflation, and ultimately “inflate away” our massive debts, which essentially means that Modern Monetary Theory (i.e., deficits don’t matter) is here to stay, no matter which party is in control. Global debt has reached $250 trillion. But if consumers choose to save and pay down debts rather than spend, we might instead find ourselves enduring the dreaded stagflation for years to come.
Final thoughts:
The persistently news-driven risk-off market climate that commenced roughly around mid-2015 – pausing only for the “Trump Bump” rally in anticipation of a tax reform bill in 2017 – has now become a speculative risk-on market in anticipation of a rapid economic recovery. Certainly, Jerome Powell and Fed largesse has something to do with it. But I’d also like to think that Elon Musk, who has layered onto his Tesla miracle SpaceX’s successful voyage to the International Space Station (the first-ever commercial manned space mission), is also giving investors confidence that even the sky is not the limit for human ingenuity, advanced technologies, rapid vaccine development, or even space travel. Hopefully, our social unrest and political divisiveness won’t upset this bountiful apple cart that promises to nourish and lift up us all.
On the other hand, you might have heard of Nikola Motor Company (NKLA) – based here in Phoenix – which boasts technology to make long-haul semi-trucks that are either pure electric or run on hydrogen fuel cells (with pure water as the only emission). It merged with exchange-listed investment company VectorIQ and changed the ticker to NKLA on June 4. Although it hadn’t yet sold a single vehicle, the new company surged by over 130% within days, briefly pushing up its market cap to $34 billion – which was more than Ford Motor (F) at $27 billion before profit-taking set in. This is just one example of the misallocation of investment capital that can occur in a climate of massive global liquidity and ultra-low interest rates. But I suppose we have to accept the bad with the good.
Looking ahead, even as the economy reopens and corporate earnings begin to recover from the shutdown, I don’t envision a full reopening and a return to “normalized” earnings until well after there is both a COVID-19 vaccine and an effective treatment. Moreover, I expect the Fed will maintain low rates and accommodative policies until the average worker is seeing benefits – and there will be more stimulus to come as necessary.
Regardless, let me reiterate my view that our economy is entering a new expansionary phase, and with it comes a new normal of elevated stock valuation multiples due to massive global monetary and fiscal stimulus, ultra-low interest rates, and technological breakthroughs that are rapidly transforming our economy, workplace, and way of life – not to mention the growing allocation within broad-market cap-weighted indexes to the inherently higher-multiple secular growth Technology sector. And as Nick Colas at DataTrek said so well in a recent Morning Briefing, this creates “a recipe for a continued melt up for US stocks even if the foundations of that rally feel like they are set in quicksand. This move will feel profoundly irrational, deeply uncomfortable, and vulnerable to sudden setbacks…because the narrative is not about earnings or even interest rates but rather a levered call on America itself.”
SPY Chart Review:
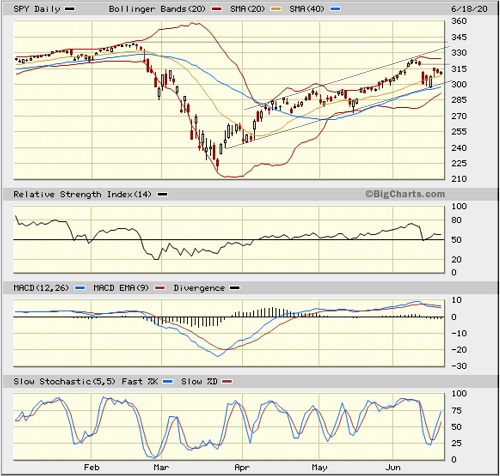
The SPDR S&P 500 ETF (SPY) closed Thursday 6/18/20 at 311.76, which is about 3.5% below its recovery high on 6/8/20 and 7.3% below its all-time high of 336.36 on 2/19/20. Notice that after its initial surge from the 3/23/20 low and brief correction to start April, SPY has been trending upward within a defined bullish channel, while maintaining solid support from its 20-day moving average and backup support from the 40-day. Bollinger Bands shown are pinching together like a coiling spring, ready for the next move, whether up or down, and the oscillators shown (RSI, MACD, Slow Stochastic) are all in mostly neutral positions. Unless the COVID takes a dramatic turn for the worse, it appears that the path of least resistance is still upward. The bearish gap down from the close on Wednesday 6/10 was never completely filled, so it is still acting as a magnet. A move back to the top of the rising channel is likely, and ultimately a move by end of summer to test the February high is a definite possibility.
Latest Sector Rankings:
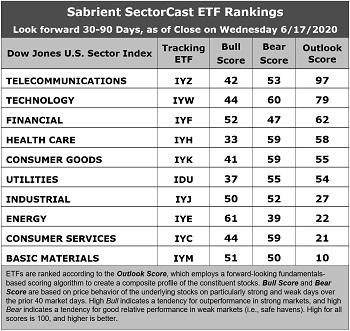
Relative sector rankings are based on our proprietary SectorCast model, which builds a composite profile of each of nearly 500 equity ETFs based on bottom-up aggregate scoring of the constituent stocks. The Outlook Score employs a forward-looking, fundamentals-based multifactor algorithm considering forward valuation, historical and projected earnings growth, the dynamics of Wall Street analysts’ consensus earnings estimates and recent revisions (up or down), quality and sustainability of reported earnings, and various return ratios. It helps us predict relative performance over the next 2-6 months.
In addition, SectorCast computes a Bull Score and Bear Score for each ETF based on recent price behavior of the constituent stocks on particularly strong and weak market days. A high Bull score indicates that stocks within the ETF recently have tended toward relative outperformance when the market is strong, while a high Bear score indicates that stocks within the ETF have tended to hold up relatively well (i.e., safe havens) when the market is weak.
Outlook score is forward-looking while Bull and Bear are backward-looking. As a group, these three scores can be helpful for positioning a portfolio for a given set of anticipated market conditions. Of course, each ETF holds a unique portfolio of stocks and position weights, so the sectors represented will score differently depending upon which set of ETFs is used. We use the iShares that represent the ten major U.S. business sectors: Financial (IYF), Technology (IYW), Industrial (IYJ), Healthcare (IYH), Consumer Goods (IYK), Consumer Services (IYC), Energy (IYE), Basic Materials (IYM), Telecommunications (IYZ), and Utilities (IDU). Whereas the Select Sector SPDRs only contain stocks from the S&P 500 large cap index, I prefer the iShares for their larger universe and broader diversity.
Here are some of my observations on this week’s scores:
1. Telecom has surged to the top spot with a lofty Outlook score of 97. The sector displays among the best sell-side analyst sentiment (positive net revisions to EPS estimates), a modest forward P/E of 14.4x, a relatively attractive forward PEG (forward P/E divided by projected EPS growth rate) of 1.87, solid return ratios, and good insider sentiment (open market buying). However, its GARP year-over-year expected EPS growth rate is a modest 7.7%. Technology remains solidly fixed in the second spot with an Outlook score of 79 as it displays positive analyst revisions, the strongest projected EPS growth rate of 14.2%, the best return ratios, and the lowest (most attractive) forward PEG of 1.78 (despite having a high forward P/E of 25.2x). Rounding out the top six are Financial, Healthcare, Consumer Goods (Staples/Noncyclicals), and Utilities, which all score above 50.
2. After the top six, the other four sectors drop off quickly, with Outlook scores ranging from 27 to 10. All four of them are cyclical sectors: Industrial, Energy, Consumer Services (Discretionary/Cyclicals), and Basic Materials, which reflects the uncertainty (and pulled guidance) for many companies in these sectors.
3. Looking at the Bull scores, Energy displays by far the top score of 61, as stocks within this sector have benefited from massive short-covering and speculation to display relative strength on strong market days (and there have been many lately). Healthcare scores the lowest at 33, somewhat surprisingly. The top-bottom spread of 28 points reflects quite low sector correlations on strong market days. It is desirable in a healthy market to see low correlations reflected in a top-bottom spread of at least 20 points, which indicates that investors have clear preferences in the market segments and stocks they want to hold (rather than broad risk-on behavior). Recall from my article last month that the top-bottom spread was 11.
4. Looking at the Bear scores, instead of the usual defensive sector Utilities alone in the top spot, we now find Technology scoring the best at 60, followed closely by Healthcare, Consumer Goods (Staples/Noncyclicals), and Consumer Services (Discretionary/Cyclicals) at 59, which means that stocks within these sectors have been the preferred safe havens lately on weak market days. Interesting that these sectors normally aren’t very defensive. Energy displays the lowest score of 39, as investors have fled during recent market weakness. The top-bottom spread is 20 points, which reflects low sector correlations on weak market days. Ideally, certain sectors will hold up relatively well while others are selling off (rather than broad risk-off behavior), so it is desirable in a healthy market to see low correlations reflected in a top-bottom spread of at least 20 points.
5. Telecom displays the best all-around combination of Outlook/Bull/Bear scores, followed by Technology, while Materials is by far the worst. Looking at just the Bull/Bear combination, Technology is the best, followed closely by Consumer Services (Discretionary/Cyclicals), indicating superior relative performance (on average) in extreme market conditions (whether bullish or bearish), while Utilities and Healthcare have been the worst.
6. I would say this week’s fundamentals-based Outlook rankings are back to a neutral bias, given that Technology and Financial are scoring well while four other cyclical sectors sit at the bottom, and with defensive Utilities and Consumer Goods sitting in the middle. However, in this unprecedented climate, it is not surprising that the near-term outlook in this fundamentals-based model is muddled. While the economy tries to gradually come out of lockdown mode, equity investors are positioning in anticipation of a better future, i.e., they are essentially predicting a bullish turn in our rankings over the next several months. Keep in mind, the Outlook Rank does not include timing, momentum, or relative strength factors, but rather reflects the consensus fundamental expectations at a given point in time for individual stocks, aggregated by sector.
ETF Trading Ideas:
Our Sector Rotation model, which appropriately weights Outlook, Bull, and Bear scores in accordance with the overall market’s prevailing trend (bullish, neutral, or defensive), moved to a bullish bias towards the end of May, and today it suggests holding Energy (IYE), Financial (IYF), and Telecom (IYZ), in that order. (Note: In this model, we consider the bias to be bullish from a rules-based trend-following standpoint when SPY is above both its 50-day and 200-day simple moving averages.)
Besides iShares’ IYE, IYF, and IYZ, other highly-ranked ETFs in our SectorCast model (which scores nearly 900 US-listed equity ETFs) from the Energy, Financial, and Telecom sectors include First Trust Energy AlphaDEX (FXN), SPDR S&P Capital Markets (KCE), and SPDR S&P Telecom (XTL).
If you prefer a neutral bias, the Sector Rotation model suggests holding Telecom, Technology, and Financial, in that order. On the other hand, if you are more comfortable with a defensive stance on the market, the model suggests holding Technology, Healthcare, and Telecom, in that order.
An assortment of other interesting ETFs that are scoring well in our latest rankings include iShares US Home Construction (ITB), Invesco Dynamic Pharmaceuticals (PJP), WBI BullBear Rising Income 3000 (WBIE), Loncar Cancer Immunotherapy (CNCR), iShares MSCI Global Gold Miners (RING), iShares Evolved US Innovative Healthcare (IEIH), US Global GO GOLD and Precious Metals Miners (GOAU), VictoryShares US Discovery Enhanced Volatility-Weighted (CSF), Franklin LibertyQ Global Equity (FLQG), VanEck Vectors Semiconductors (SMH), WBI BullBear Quality 3000 (WBIL), VictoryShares US Small Cap Volatility-Weighted (CSA), Tortoise North American Pipeline (TPYP), First Trust NASDAQ Technology Dividend (TDIV), Pacer US Cash Cows Growth (BUL), and Pacer American Energy Independence (USAI).
As always, I welcome your thoughts on this article! Please email me anytime. Any and all feedback is appreciated!
IMPORTANT NOTE: I post this information periodically as a free look inside some of our institutional research and as a source of some trading ideas for your own further investigation. It is not intended to be traded directly as a rules-based strategy in a real money portfolio. I am simply showing what a sector rotation model might suggest if a given portfolio was due for a rebalance, and I do not update the information on a regular schedule or on technical triggers. There are many ways for a client to trade such a strategy, including monthly or quarterly rebalancing, perhaps with interim adjustments to the bullish/neutral/defensive bias when warranted, but not necessarily on the days that I happen to post this article. The enhanced strategy seeks higher returns by employing individual stocks (or stock options) that are also highly ranked, but this introduces greater risks and volatility. I do not track performance of the ideas mentioned here as a managed portfolio.
Disclosure: At the time of this writing, among the securities mentioned, the author held long positions in SPY, XLY, GOAU, and TCEHY.
Disclaimer: This newsletter is published solely for informational purposes and is not to be construed as advice or a recommendation to specific individuals. Individuals should take into account their personal financial circumstances in acting on any opinions, commentary, rankings, or stock selections provided by Sabrient Systems or its wholly owned subsidiary Gradient Analytics. Sabrient makes no representations that the techniques used in its rankings or analysis will result in or guarantee profits in trading. Trading involves risk, including possible loss of principal and other losses, and past performance is no indication of future results.