Sector Detector: Big hopes for 2020 ride on earnings growth and capex revival
by Scott Martindale
President & CEO, Sabrient Systems LLC
As the New Year gets underway, stocks have continued their impressive march higher. Comparing the start of this year to the start of 2019 reveals some big contrasts. Last January, the market had just started to recover from a nasty 4Q18 selloff of about 20% (a 3-month bear market?), but this time stocks have essentially gone straight up since early October. Last January, we were still in the midst of nasty trade wars with rising tariffs, but now we have a “Phase 1” deal signed with China and the USMCA deal with Mexico and Canada has passed both houses of Congress. At the beginning of last year, the Fed had just softened its hawkish rhetoric on raising rates to being "patient and flexible" and nixing the “autopilot” unwinding of its balance sheet (and in fact we saw three rate cuts), while today the Fed has settled into a neutral stance on rates for the foreseeable future and is expanding its balance sheet once again (to shore up the repo market and finance federal deficit spending (but don’t call it QE, they say!). Last year began in the midst of the longest government shutdown in US history (35 days, 12/22/18–1/25/19), but this year’s budget easily breezed through Congress. And finally, last year began with clear signs of a global slowdown (particularly in manufacturing), ultimately leading to three straight quarters of YOY US earnings contraction (and likely Q4, as well), but today the expectation is that the slowdown has bottomed and there is no recession in sight.
As a result, 2019 started with the S&P 500 displaying a forward P/E ratio of 14.5x, while this year began with a forward P/E of 18.5x – which also happens to be what it was at the start of 2018, when optimism reigned following passage of the tax cuts but before the China trade war got nasty. So, while 2018 endured largely unwarranted P/E contraction that was more reflective of rising interest rates and an impending recession, 2019 enjoyed P/E expansion that essentially accounted for the index’s entire performance (+31% total return). Today, the forward P/E for the S&P 500 is about one full standard deviation above its long-term average, but the price/free cash flow ratio actually is right at its long-term average. Moreover, I think the elevated forward P/E is largely justified in the context of even pricier bond valuations, low interest rates, favorable fiscal policies, the appeal of the US over foreign markets, and supply/demand (given the abundance of global liquidity and the shrinking float of public companies due to buybacks and M&A).
However, I don’t think stocks will be driven much higher by multiple expansion, as investors will want to see rising earnings once again, which will depend upon a revival in corporate capital spending. The analyst consensus according to FactSet is for just under 10% EPS growth this year for the S&P 500, so that might be about all we get in index return without widespread earnings beats and increased guidance, although of course well-selected individual stocks could do much better. Last year was thought to be a great setup for small caps, but alas the trade wars held them back from much of the year, so perhaps this will be the year for small caps. While the S&P 500 forward P/E has already risen to 19.0x as of 1/17, the Russell 2000 small cap index is 17.2x and the S&P 600 is only 16.8x.
Of course, there are still plenty of potential risks out there – such as a China debt meltdown, a US dollar meltdown (due to massive liquidity infusions for the dysfunctional repo market and government deficit spending), a US vote for democratic-socialism and MMT, a military confrontation with Iran, or a reescalation in trade wars – but all seem to be at bay for now.
In this periodic update, I provide a detailed market commentary, offer my technical analysis of the S&P 500, review Sabrient’s latest fundamentals-based SectorCast rankings of the ten US business sectors, and serve up some actionable ETF trading ideas. In summary, our sector rankings look neutral, while the technical picture also is quite bullish (although grossly overbought and desperately in need of a pullback or consolidation period), and our sector rotation model retains its bullish posture. Notably, the rally has been quite broad-based and there is a lot of idle cash ready to buy any significant dip.
As a reminder, Sabrient now publishes a new Baker’s Dozen on a quarterly basis, and the Q1 2020 portfolio just launched on January 17. You can find my latest slide deck and Baker’s Dozen commentary at http://bakersdozen.sabrient.com/bakers-dozen-marketing-materials, which provide discussion and graphics on process, performance, and market conditions, as well as the introduction of two new process enhancements to our long-standing GARP (growth at a reasonable price) strategy, including: 1) our new Growth Quality Rank (GQR) as an alpha factor, which our testing suggests will reduce volatility and provide better all-weather performance, and 2) “guardrails” against extreme sector tilts away from the benchmark’s allocations to reduce relative volatility. Read on....
Market Commentary:
Last January, I discussed the difficult 2018 climate in which no asset classes made money and the forward P/E for the S&P 500 fell from 18.5x to 14.5x, but I opined, “I think we have been presented with a great buying opportunity, with perhaps 20-25% upside in the S&P 500 index during 2019, which would finally put the index above the 3,000 mark.” Well, we actually got +31% total return from the S&P 500 last year, and in fact it first surpassed 3,000 in mid-July.
I also wrote, “… it may finally spell a return to a more selective stock-picker’s market, with lower correlations and higher performance dispersion. Moreover, my expectation for 2019 is for a de-escalation in the trade war with China, a more accommodative Fed, and for higher stock prices ahead. Forward valuations overall have become exceedingly attractive, especially in the cyclical sectors that typically flourish in a growing economy.” As you know, all of that came to fruition – although it took until late August before cyclicals developed some solid traction.
While 2018 saw high asset correlations and nowhere to hide from the negative returns, 2019 also displayed high asset correlations but with all major asset classes going up – including cryptocurrencies, US large caps, US small caps, emerging markets (led by Brazil), global developed markets (even moribund Europe), gold (its best year since 2010), silver, palladium, oil, REITs, high-yield bonds, Treasuries, investment-grade bonds, and global bonds. The aggregate hedge fund return of the HFR Fund Weighted Composite index was up 10.4%, its best one-year performance since 2009. So, you could make money no matter where you invested, although the persistently high asset correlation is somewhat troublesome, making it harder for investors to diversify.
Notably, Apple (AAPL) alone was up +89% in 2019, while the Energy sector languished with a +6% total return, and as a result, AAPL now sports a larger market cap than the entire Energy sector in the S&P 500. Moreover, the top five companies by market cap in the S&P 500 – AAPL, Microsoft (MSFT), Alphabet (GOOGL), Amazon (AMZN), Facebook (FB) – now make up a record 17% share of the index’s total capitalization, which is the highest since the Tech bubble. Notably, GOOGL joined the trillion-dollar market cap club on Friday, along with AAPL and MSFT (and AMZN made it there last summer before pulling back). Total market capitalization of US equities has reached $35 trillion, which is a record 1.55x US GDP of $22.3 trillion.
Largely driving the growing investor enthusiasm is a fading fear of a “late-cycle” economy on the verge of recession. In fact, it had become more of a self-fulfilling prophesy than a fundamental reality, and now investors are trying to ignore the fearmongers and move from risk-averse to risk-embracing, which better matches the fundamental outlook for the US economy and stocks, according to Sabrient’s model. My view has been that the economy is posturing more like a recovery or expansionary cycle. In fact, I would argue that while the slow-growth post-Financial Crisis economy has managed to consistently print positive GDP growth readings, it was led by strong consumer spending supported by the “wealth effect” of asset inflation from a friendly Fed keeping the liquidity flowing. And looking under the hood, we can see multiple earnings recessions (during the mid-2014 through mid-2016 timeframe, as well as for the past few quarters), stagnant capital spending, falling industrial production, and a stark manufacturing recession. Furthermore, there have been some scary selloffs and what many consider to have been a brief bear market (-20%) in 2018.
Thus, I believe we may be in the early stages of a new expansionary cycle that might continue for several more years, including a manufacturing boom driven by new technologies like 5G, the Internet of Things (IoT), AI/ML, robotics, clean energy, oil fracking, blockchain, space travel, quantum computing, nanotechnology, genomics, and precision medicine. Notably, venture capital investment in artificial intelligence (AI) totaled about $18.5 billion last year, which was 10% more than in 2018.
The market is riding high on an accommodative Fed, subdued recession fears, newly signed trade deals, and M2 money supply growth. Investment grade corporate bond spreads have remained extremely tight. The consumer is strong and confident. Retail sales are on fire. US housing starts reached a 13-year high in December spurred by persistently low mortgage rates, and homebuilder sentiment is the highest since 1999. The BEA reported that the personal savings rate has stabilized above 7%, which hasn’t been seen on a consistent basis since the mid-1990s. The unemployment rate (U3) remains historically low at around 3.5%, and the seasonally adjusted U6 (which includes discouraged and part-time workers) hit an all-time low of 6.7%. Wages are rising, and the lower-income levels are seeing the greatest wage growth. A recent CNN poll showed that 76% of people think economic conditions are either “somewhat good” or “very good,” which is the highest percentage that poll has found since 2001. And yet despite the powerful rally, investors still seem mostly cautious about stocks. A record $135.5 billion was pulled out of U.S. stock mutual funds and ETFs in 2019, while margin debt sat at its lowest level since 2005. Moreover, $3.6 trillion sits idle in money market funds (which is up 24% over year-end 2018 and an amount not seen since the Financial Crisis) – potential fuel for a continued market rally.
In addition, corporate balance sheets are strong and productivity remains high. And although debt levels are on the high side, much of it is locked up at low interest rates, so debt carrying costs are around historical averages, and with a lower cost of capital, companies can generate better returns on invested capital (ROIC). In addition, both monetary and fiscal policy are working together to stimulate economic activity (rather than working against each other as was happening when the Fed began its tightening cycle in a “handoff” from monetary stimulus to Trump’s fiscal stimulus). The Fed has signaled no interest rate adjustments for the foreseeable future, and the Trump Administration continues to spend rather than cut while signaling a desire for additional fiscal stimulus in the form of a Middle-Class tax cut, further deregulation, and an infrastructure spending bill. According to Andrew Hunter of Capital Economics, “The stabilization in global manufacturing activity, and the trade truce with China, suggest that the drag on the US economy from weak growth overseas has now run its course.” I concur.
And lest you forget, the fourth year of a presidential term typically sees positive returns – although the caveat this time is that we haven’t seen a realistic challenge from a socialist before. Perhaps we can find hope “across the pond” (of all places). For example, in the UK, Labour Party leader Jeremy Corbyn and his socialist agenda was trounced by Boris Johnson and the Conservative Party, keeping Brexit on course, which itself was a rejection of EU’s onerous taxation, regulation, and immigration requirements. Political analysts see these developments as part of a macro trend away from democratic socialism throughout Western Europe (including Sweden, UK, Germany, and The Netherlands).
Earnings, GDP, and interest rates:
As for corporate earnings, Q3 proved that Corporate America actually has been quite resilient despite the trade wars as reports were much better than expected. Going into Q4 reporting season, FactSet’s most recent take was for -2.0% YOY decline in EPS, which would mark the first time the index has reported four straight quarters of year-over-year declines in earnings since Q3 2015 through Q2 2016. Five sectors were predicted to report YOY earnings growth for Q4, led by the Utilities Financials, Healthcare, Communication Services, while six sectors were projected to report a year-over-year decline in earnings, including Energy, Consumer Discretionary, Materials, and Industrial.
But now that Q4 US corporate earnings season is actually underway, already we have seen some strong reports, especially from the big banks like JPMorgan Chase (JPM), Citigroup (C), and Bank of America (BAC). So, perhaps we ultimately will see some positive EPS growth following three quarters of earnings recession.
Looking ahead, FactSet’s analyst consensus is much brighter. Year-over-year comps will be easier this year than last year, which is another reason why investors have bid up valuation multiples. For the S&P 500 in 2020, expectations are for +5.5% revenue growth and +9.7% EPS growth (specifically, $162.81 EPS in 2019 growing to $178.57 in 2020), with the strongest growth coming from those same underperforming Energy, Consumer Discretionary, Materials, and Industrial sectors, along with Comm Services. Friday’s closing level of 3,330 on the S&P 500 implies a 5.3% earnings yield (plus a dividend yield of 1.74%), which seems quite reasonable when compared with a 10-year Treasury yield around 1.83%. According to DataTrek, for the S&P 500 to achieve FactSet’s consensus forecasted EPS growth, over 50% of the index by market cap (comprising Technology, Comm Services, Consumer Discretionary, and Industrial sectors) must see the 0% (i.e., flat) aggregate EPS growth they achieved in 2019 rise to 13% growth, which sounds ambitious but I think doable now that the Phase 1 trade deal is done.
Certainly, a resurgence in capital spending will be key, and early signs are good. For example, Taiwan Semiconductor (TSM), the world’s large semiconductor foundry, just reported that it expects 1Q2020 calendar year will show a 45% YOY revenue increase, and it raised its capex plan on expectations of strong demand for various new technologies, including 5G smartphones (note: I for one have been holding out on upgrading my iPhone until the 5G versions are released).
China’s economy grew 6.1% in 2019, its slowest pace in 29 years. As for US GDP, following growth of +3.1% in Q1 2019 and +2.0% in Q2, the BEA’s third estimate for Q3 is +2.1%. Looking ahead to Q4 (as of 1/17/20), the Atlanta Fed’s GDPNow model predicts +1.8% GDP growth, the St. Louis Fed NowCast expects a more optimistic +2.1%, and the NY Fed’s NowCast sees +1.2% (and +1.7% for 1Q2020). By the way, the BEA just released Q3 Gross Output (GO), which measures total economic activity (including transactions within the supply chain and not just final products), and it was up +2.5%. When GO is growing faster than real GDP (+2.1% in Q3), it’s considered a leading indicator that the economy will continue to expand into the near future.
Here is another interesting factoid. In 2018, US GDP hit $20.5 trillion, which means the US economy is as large as the next three largest economies in the world combined – China, Japan and Germany. Notably, the US generated 24.3% of world GDP in 2018 with only about 4.3% of the world's population.
Of course, the biggest trouble spot has been in the manufacturing segment. ISM manufacturing index declined to 47.2 in December, which was its fifth straight month below 50 (indicating contraction) and down from 48.1 in November. This was its lowest level since June 2009. No doubt, the troubles at Boeing (BA) and strike at General Motors (GM) had something to do with it. So, there is no doubt we are in a manufacturing recession, but again, there are indications that we have seen the bottom, with solid growth – and perhaps a new expansionary cycle – ahead.
The 30-year Treasury yield sits at 2.28%, while the 10-year T-note is 1.83%, the 2-year T-note 1.56%, and the 3-month T-bill also at 1.56%. So, the 3-month/10-year spread is at +27 bps, matching the more closely followed 2-10 spread, as the Fed has restored investor confidence by shoring up the repo market, and its massive injections of liquidity have also found their way into stocks. Of course, the fleeting inversion of the yield curve last year (as I have frequently opined) was not due to fundamental reasons like an over-heated economy or rising inflation, but rather it was artificially inverted due to defensive global investor sentiment and low rates overseas, as the US continues to pay much more lucrative yields compared with other developed markets, and in fact, Germany, France, and Japan continue to offer negative rates across much of the yield curve (i.e., you have to pay them for the honor of holding their bonds).
The FOMC has made clear its intention to keep the benchmark rate stable in the current 1.50-1.75% range for the foreseeable future. Early last year, the plan was to raise the fed funds rate above 3% in 2020. Interestingly, CME Group fed funds futures are a little odd right now. First of all, they show a small 16% probability of a 25-bp rate hike later this month. I suppose it’s due to the surging stock market and expectations of rising growth (and perhaps inflation), but I personally wouldn’t bet on a hike this month. By June, there is roughly equal probability of a rate cut or hike, and by the December meeting the probability is 56% that the fed funds rate will be lower and only a 6% chance that it will be higher than today’s rate. Not sure what to make of that.
Investor sentiment continues to rotate risk-on:
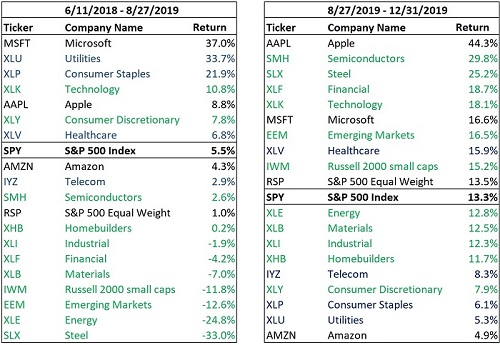
Last year in this column I predicted, “I think the bearish investor sentiment has set up a contrarian buying opportunity, particularly as short-covering adds fuel to a resurgence in bullish conviction, and perhaps those hated cyclical sectors will be the leaders in 2019.” Well, despite a few failed attempts to rotate from defensive to risk-on sentiment, we finally got that sustained resurgence in cyclical sectors and smaller caps starting on 8/27/19. As shown in the table below, starting on 6/11/18 when the trade war with China escalated from rhetoric to reality, markets were led by defensive sectors like Utilities and Consumer Staples, plus secular growth Technology names like mega-caps MSFT and AAPL. But it all looks quite different since 8/27/19, with new leadership from deep-cyclicals like semiconductors and steel, along with value plays in the Financial sector, emerging markets, and small caps. Moreover, we have seen much better performance from cyclical/value sectors Energy, Materials, and Industrial at the expense of defensive Utilities and Consumer Staples.
As I have described many times before, a stark and persistent market bifurcation commenced in mid-2018 favoring secular growth, low-volatility and momentum factors, “bond proxy” defensive sectors, and large caps (i.e., late-stage economic cycle behavior) over cyclical growth, value and high-beta factors, cyclical sectors, and small-mid caps (i.e., expansionary cycle behavior), creating what JP Morgan called the largest relative valuation divergence in history. Likewise, a Research Affiliates study found that valuations for Value companies had become about the cheapest they’ve ever been relative to Growth companies.
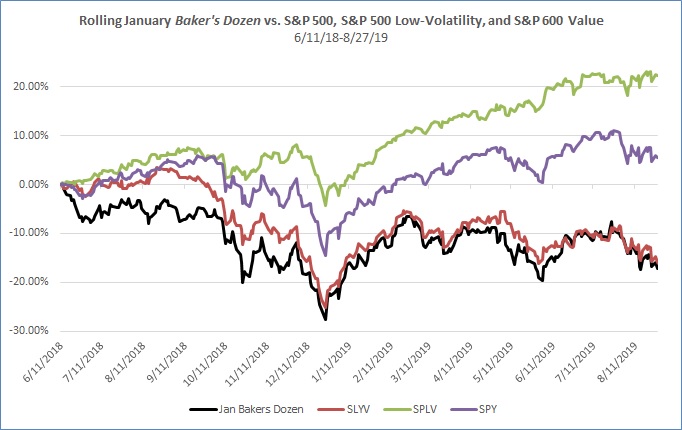
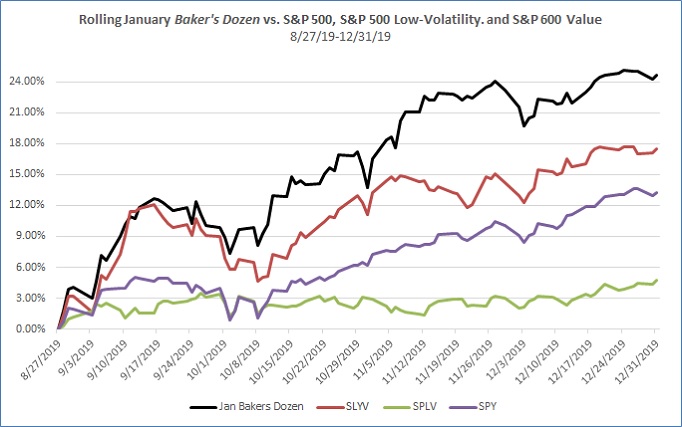
To further illustrate, the charts below compare a theoretical rolling January Baker’s Dozen model portfolio versus the SPDR S&P 500 (SPY), Invesco S&P 500 Low Volatility (SPLV, which performed so well during the period of defensive sentiment), and SPDR S&P 600 Small Cap Value (SLYV, which represents the risk-on value/small category) for two timeframes: Christmas Eve 2018 “capitulation day” until 8/27/19, and 8/27/19 to year-end. In the first chart, you can see the correlation during the initial period between the theoretical rolling January Baker’s Dozen and the SLYV, as well as the initial outperformance after Christmas Eve 2018 followed by the steady underperformance to the steady march higher of SPY and SPLV until 8/27/19. However, after that date, the second chart shows that the January Baker’s Dozen greatly outperformed all three of the other portfolios. This certainly was a welcome and long-overdue development!
New enhancements to Sabrient’s GARP model:
Of course, Sabrient has long been proud of the impressive theoretical back-test history (post-Internet Bubble) of our underlying GARP (growth at a reasonable price) model as well as the solid actual performance of our Baker’s Dozen portfolios since launch in 2009. But it has become evident to us that more recently the market has displayed persistently irrational behavior unlike anything we have seen (or tested) in the past – largely due to various macro events (like the China trade war and Federal Reserve monetary policy), but perhaps also due to the rise of algorithmic trading (which can amplify and prolong fluctuations in sentiment). Similarly, cautious corporate sentiment led to a slowdown in capital spending plans despite a positive outlook, which made many companies from the cyclical sectors like Industrials and Materials miss their estimates and push back guidance. As a result, investor sentiment has been largely misaligned with a sound fundamental outlook.
In response, as I discussed last month, we have implemented new enhancements to our existing quantitative GARP model and portfolio selection process with the goal of achieving better “all weather” performance relative to the benchmark S&P 500. Of course, we didn’t want to make any dramatic changes to Sabrient’s long-standing GARP model and portfolio selection process, which had produced so many high-performing portfolios. However, if such market conditions become the “new normal,” we want our process to still perform well as an all-weather strategy with minimal erosion in the potential for significant outperformance during the “rational” conditions. Of course, we might improve performance by either enhancing the model or reducing relative volatility versus the cap-weighted S&P 500 benchmark (which of course is dominated by mega-caps and passive investing and can retain capital even as it rotates among sectors). So, we have implemented the following process enhancements, which I detailed in my January Baker’s Dozen commentary:
- Additional sector constraints, to reduce relative volatility versus the benchmark. Whereas we previously limited sectors to a max allocation of 30%, without regard to the benchmark’s allocations, we found that more recently as the Tech sector that is more heavily weighted in the benchmark has been bid up to higher valuations, our model has pushed us more toward the cyclical sectors (like Industrial/Materials/Energy). And indeed, allowing those sector tilts toward the more attractive valuations has been beneficial at times, but it cuts both ways, such as when those sectors are shunned despite solid outlooks (however irrational it may be). So, we have implemented “guardrails” to prevent going too far astray of the benchmark’s sector allocations.
- Our newly developed Growth Quality Rank (GQR), as an additional alpha factor in our quant model. We set about to enhance our GARP model to better focus on consistency and predictability of earnings and a company’s likelihood of meeting consensus earnings estimates, in addition to the factors on which we have always focused (like strength of growth, relative valuation, recent sell-side revisions to estimates, and quality of earnings). The goal was to provide better “all-weather” performance, even when investor sentiment seems irrational, with minimal reduction to the upside potential that investors seek from the Baker’s Dozen. It also allows for more in the way of secular growth companies (even if they display higher forward P/Es) rather than letting the model push us so heavily into lower P/E cyclical growth companies, which often can become proverbial “value traps” that have been so impacted by the disconnect between persistently defensive investor sentiment and the positive economic outlook.
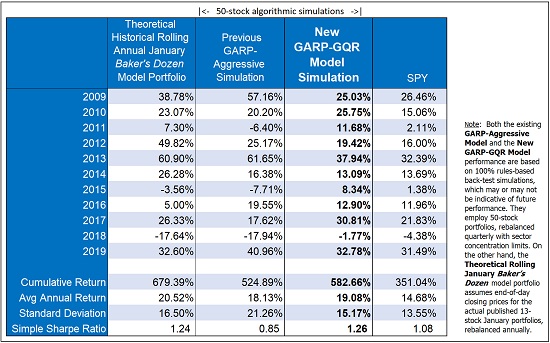
The table above shows the strong correlation between a theoretical rolling annual model portfolio of our actual published January Baker’s Dozen model portfolios since inception in 2009 and the underlying “GARP-Aggressive” model (as run in a 50-stock quant simulation with a quarterly rebalance), as you would expect. Likewise, the new GARP-GQR model historical simulation is also correlated during most years but is significantly less volatile. While displaying a similar cumulative return over the nearly 11-year test, it has a much lower standard deviation and thus a much higher Sharpe Ratio versus the existing model. And importantly, our simulation suggests that the down years should be significantly softened. Indeed, the weak performance shown in the table during 2018 for both the rolling Baker’s Dozen and the underlying GARP-Aggressive model is greatly improved in the new GARP-GQR model (and it even beats the benchmark S&P 500). [Note: The gross hypothetical back-tested performance shown in the table does not represent the results of actual trading and does not consider transaction costs or fees. Actual returns from live portfolios may differ materially from hypothetical returns.]
Of course, this is not the first enhancement to our original model from 2008. For example, we implemented a corporate integrity score to our fundamental review and final stock selection process in 2017, and we developed and introduced our proprietary Earnings Quality Rank (EQR) in 2013, with expert assistance from the Gradient Analytics forensic accounting team, to help us focus on companies with less aggressive accounting practices relative to their industry peers. Similarly, the new GQR will help us focus on those companies with more consistent and reliable earnings growth trends that are more likely to achieve their growth forecasts. The ramifications of this are quite promising for our future Baker’s Dozen portfolios – starting with the Q1 2020 portfolio that was released last Friday.
Expectations for 2020:
It remains pretty clear that there is no imminent recession in sight (as long as we don’t elect a socialist as president, that is). Typically, a recession would be triggered by a Black Swan geopolitical event, a hawkish Fed tightening cycle to pump the brakes on an overheated economy and fight inflation, or a massive spike in oil prices. Today, geopolitical risks have actually ameliorated (e.g., trade wars, Brexit, Middle East war), inflation remains low, interest rates remain near historic lows, and GDP growth is expected to be positive but nowhere near exuberant (at around 2% or so) – so the Fed has reverted to a dovish stance. And regarding the threat of an oil price shock, the landscape is far different today in that the US is effectively energy independent (although we still participate in the global oil market). Furthermore, technological advancements have both flattened growth in energy consumption and made it cheaper to extract “tight” oil formations, rendering the US essentially energy independent from foreign sources, if need be.
I think we will see at least one significant correction this year to test bullish conviction at these new highs – and the longer the market marches straight up, the more severe the technical correction might be – but there is no recession in sight. Q3 earnings turned out much better than expected and Q4 may turn out similarly, even though businesses have held back on capital spending until they had greater visibility vis-à-vis the trade war. One can only imagine the kind of boost we might see from a surge in capital investment. Tailwinds for 2020 include the various new trade deals, ongoing monetary stimulus (low interest rates and easy access to credit), ongoing fiscal stimulus (low tax rates and deregulation), record low unemployment, low inflation, lofty consumer confidence, and improving business confidence.
Moreover, real interest rates in the US are negative (which is historically bullish) and the yield curve is steepening. In addition, there is plenty of idle cash still on the sidelines, and although investor confidence is growing more optimistic, most investors are still far from “exuberant.” Instead of a recession, we may see a continued rotation out of wildly popular growth/momentum stocks of recent years and into the vast sea of overlooked names – especially from among the many in the small and mid cap segments that still sport attractive valuations. Notably, JP Morgan’s strategy team has predicted a rotation of retail investor capital this year from bond funds into equity funds, similar to what occurred in 2013. And any dollar weakness coupled with a resurgent manufacturing sector likely would give commodities a long overdue boost.
With all the ducks lining up for continued strength in consumer sentiment and spending, and a resurgence in economic growth, manufacturing, corporate capital spending, and corporate earnings, what could go wrong? No doubt, there are storm clouds on the horizon, but how soon or how severe will be the storm remain uncertain. To me, the most ominous clouds include:
- Wealth inequality (largely driven by central bank QE and “crony capitalism” that favors the biggest asset owners with greatest access to capital) has created a populist push toward socialism and Modern Monetary Theory (MMT). While Europe has been turning away from it, many in the US seem to be attracted to it.
- Growing tensions in the Middle East, and the prospect of a military confrontation with Iran. However, the risks here have greatly lessened ever since the Ukrainian passenger jet was mistakenly shot down.
- Global reliance on debt-fueled spending (especially China’s “house of cards”), which may eventually lead to a harsh reckoning for the global economy; I just don’t think it will happen over the next couple of years. Last year, China’s debt/GDP ratio surpassed 300% (government, corporate, household), plus an estimated $8 trillion in off-balance sheet “shadow banking” and so-called “wealth management products” (which are just other forms of loans) that have been shoring up failing enterprises. Funding for new but little used infrastructure – like gleaming highways to Kyrgyzstan on which no one drives, bullet trains through the Gobi Desert that no one rides, high-rise apartment buildings in which no one lives, and bridges to nowhere – provide little return on investment.
- A sudden about-face in the dwindling tariffs and trade war tensions would likely destroy the encouraging climate for capital investment and bring back uncertainty and defensive sentiment. The “Phase 2” trade deal negotiations with China will address the most difficult issues, like forced technology transfer (as the ticket for entry into its market), flouting of IP protections, and outright cybertheft, all of which China has relied upon to fuel its breakneck growth.
- The biggest “under the radar” risk hanging over us right now is the repo market (i.e., repurchase agreements), which has been squeezed by a lack of liquidity due to the federal government’s massive deficit spending. Banks and foreign entities are expected to buy our flood of Treasury issuances to keep the federal government funded, but as reserves have drawn down those funds have dried up, leaving the repo market gasping for dollars, and the Federal Reserve had to step in with new liquidity to shore it up – i.e., de facto quantitative easing (QE), although the Fed won’t call it QE because it is technically only buying T-bills of 1-year maturity or less rather than across the yield curve. (Note: I am personally maintaining a small allocation to gold and cryptocurrencies as a hedge on this situation.)
Of course, Sabrient’s flagship product since 2009 has been our Baker’s Dozen portfolio. Starting this year, we will issue a new portfolio on a quarterly basis. You can see the performance of all our previous model portfolios and their holdings by visiting: http://bakersdozen.sabrient.com. (Past performance is no guarantee of future results, and investors would be wise to remember that trading and investing always involve risk.) Sabrient founder and chief market strategist David Brown led the broad Sabrient team (which includes our wholly-owned subsidiary Gradient Analytics, a forensic accounting research firm that primarily serves the long/short hedge fund community) in making final selections for the Q1 2020 Baker’s Dozen, which launched on January 17. You are welcome to email us at support@sabrient.com to be put on the mailing list for details and rationale on the holdings in the new portfolio. You also might consider becoming a subscriber to our Financial Advisor research package.
I wish you a healthy and prosperous New Year!
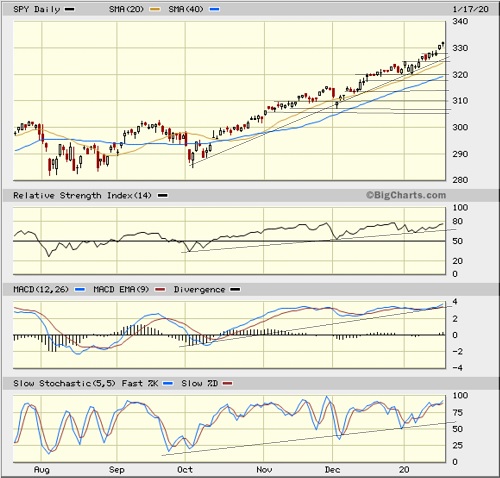
SPY Chart Review:
The SPDR S&P 500 ETF (SPY) closed last week at about 332, as it continues its tear higher. I discussed last month that late November brought about the third major upside breakout since the Financial Crisis, which I thought boded well for a continuation of the rally well into 2020 and beyond. Well, so far so good, and importantly the rally has shown great breadth, with strength in both defensive and cyclical sectors. All the major sectors (except Energy) have hit new 52-week or all-time highs except for Energy, and there is strength in important industries like transports, homebuilders, and pharma.
Looking at the SPY chart over the past year, we can see that it essentially has gone straight up since early October (more than three months), with just a fleeting dip in early December. Oscillators RSI, MACD, and Slow Stochastics have all remained firmly above neutral for these past three months, so they really need to cycle back down to shake out the weaker holders (and the momentum algo traders). Higher lows in price have been confirmed by higher lows in the oscillators. Price has become quite stretch above both the 20-day simple moving average (SMA) and the uptrend line from early October. There are various gaps and support levels to be tested at 328, 325, 320, 317, 312, and 310, as well as the 20-day and 50-day SMAs (currently nearing 325 and 318, respectively). Of course, there is no guarantee that they all will be tested, and perhaps the chart will just consolidate in place for a week or two to work off the overbought conditions, but nothing goes up in a straight line. If you pull up a chart of the Russell 2000 small cap index, it looks like it has already begun its pullback. Nevertheless, it would be healthy to see a pullback, the technical picture remains quite strong, and such a dip likely will be eagerly bought.
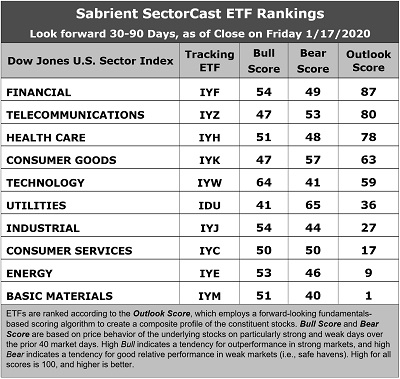
Latest Sector Rankings:
Relative sector rankings are based on our proprietary SectorCast model, which builds a composite profile of each of nearly 500 equity ETFs based on bottom-up aggregate scoring of the constituent stocks. The Outlook Score employs a forward-looking, fundamentals-based multifactor algorithm considering forward valuation, historical and projected earnings growth, the dynamics of Wall Street analysts’ consensus earnings estimates and recent revisions (up or down), quality and sustainability of reported earnings, and various return ratios. It helps us predict relative performance over the next 2-6 months.
In addition, SectorCast computes a Bull Score and Bear Score for each ETF based on recent price behavior of the constituent stocks on particularly strong and weak market days. A high Bull score indicates that stocks within the ETF recently have tended toward relative outperformance when the market is strong, while a high Bear score indicates that stocks within the ETF have tended to hold up relatively well (i.e., safe havens) when the market is weak.
Outlook score is forward-looking while Bull and Bear are backward-looking. As a group, these three scores can be helpful for positioning a portfolio for a given set of anticipated market conditions. Of course, each ETF holds a unique portfolio of stocks and position weights, so the sectors represented will score differently depending upon which set of ETFs is used. We use the iShares that represent the ten major U.S. business sectors: Financial (IYF), Technology (IYW), Industrial (IYJ), Healthcare (IYH), Consumer Goods (IYK), Consumer Services (IYC), Energy (IYE), Basic Materials (IYM), Telecommunications (IYZ), and Utilities (IDU). Whereas the Select Sector SPDRs only contain stocks from the S&P 500 large cap index, I prefer the iShares for their larger universe and broader diversity.
Here are some of my observations on this week’s scores:
1. There has been notable defensive shift in the rankings, likely due to the rapid rise in valuations among the risk-on sectors. Financial remains in the top spot with an Outlook score of 87, with generally solid scores across the board, including an attractive forward P/E (16.7x), improving sell-side analyst sentiment (net positive revisions to EPS estimates), a solid projected year-over-year aggregate EPS growth rate of 9.3%, and an attractive forward PEG ratio (forward P/E divided by projected EPS growth rate) of 1.77, and the best insider sentiment (open market insider buying). Moving into second is Telecom with a score of 80, mostly due to its low forward P/E (14.1x) and strong return ratios. Rounding out the top six are Healthcare, Consumer Goods (Staples/Noncyclical), Technology, and Utilities. Notably, Technology displays the highest projected EPS growth rate (13.0x) but also the highest forward P/E (23.5x).
2. At the bottom of the rankings we find four cyclical sectors: Basic Materials, Energy, Consumer Services (Discretionary/Cyclical), and Industrial. All have seen significant net reductions to earnings estimates from the sell-side analyst community. We will see if guidance changes as the Q4 earnings reports come out, particularly in light of the Phase 1 trade deal with China.
3. Looking at the Bull scores, Technology has the top score of 64, followed by Financial and Industrial at 54, as stocks within these sectors have displayed relative strength on strong market days. Defensive sector Utilities scores the lowest at 41. The top-bottom spread is a healthy 23 points, which reflects low sector correlations on strong market days. It is desirable in a healthy market to see low correlations reflected in a top-bottom spread of at least 20 points, which indicates that investors have clear preferences in the market segments and stocks they want to hold (rather than broad risk-on behavior).
4. Looking at the Bear scores, as usual we find defensive sector Utilities alone in the top spot with a score of 65, followed by Consumer Goods at 57, which means that stocks within these sectors have been the preferred safe havens lately on weak market days. Basic Materials displays the lowest score of 40, followed closely by Technology at 41, as investors have fled during recent market weakness (although there hasn’t been much of that lately). The top-bottom spread is 25 points, which reflects quite low sector correlations on weak market days. Ideally, certain sectors will hold up relatively well while others are selling off (rather than broad risk-off behavior), so it is desirable in a healthy market to see low correlations reflected in a top-bottom spread of at least 20 points.
5. Financial displays the best all-around combination of Outlook/Bull/Bear scores, followed by Telecom, while Materials is the worst. Looking at just the Bull/Bear combination, Utilities is the best, indicating superior relative performance (on average) in extreme market conditions (whether bullish or bearish), while Materials is the worst, and the best balance is displayed by Consumer Services (Discretionary/Cyclical).
6. I would say this week’s fundamentals-based Outlook rankings now reflect a neutral bias, given the mix of defensive and economically sensitive sectors among the top six. Perhaps it’s not a surprise given the rapid rise in the risk-on sectors since my last article in early December. It appears that the sell-side analyst community is still grappling with visibility in capital spending programs and earnings growth, while investors have already called a bottom and aren’t waiting around for those upward revisions. Keep in mind, the Outlook Rank does not include timing, momentum, or relative strength factors, but rather reflects the consensus fundamental expectations at a given point in time for individual stocks, aggregated by sector.
ETF Trading Ideas:
Our Sector Rotation model, which appropriately weights Outlook, Bull, and Bear scores in accordance with the overall market’s prevailing trend (bullish, neutral, or defensive), retains a bullish bias and suggests holding Technology (IYW), Financial (IYF), and Healthcare (IYH), in that order. (Note: In this model, we consider the bias to be bullish from a rules-based trend-following standpoint when SPY is above both its 50-day and 200-day simple moving averages.)
Besides iShares’ IYW, IYF, and IYH, other highly-ranked ETFs in our SectorCast model (which scores nearly 800 US-listed equity ETFs) from the Technology, Financial, and Healthcare sectors include First Trust NASDAQ Technology Dividend (TDIV), SPDR S&P Capital Markets (KCE), and Invesco Dynamic Biotech and Genome (PBE).
If you prefer a neutral bias, the Sector Rotation model suggests holding Financial, Telecom, and Healthcare, in that order. On the other hand, if you are more comfortable with a defensive stance on the market, the model suggests holding Utilities, Consumer Goods (Staples/Noncyclical), and Telecom, in that order.
An assortment of other interesting ETFs that are scoring well in our latest rankings include SPDR S&P Pharmaceuticals (XPH), First Trust NASDAQ ABA Community Bank (QABA), GraniteShares HIPS US High Income (HIPS), Invesco Financial Preferred (PGF), SPDR S&P Bank (KBE), Fidelity MSCI Financials (FNCL), Davis Select Financial (DFNL), Invesco S&P SmallCap Value with Momentum (XSVM), iShares Evolved US Innovative Healthcare (IEIH), Arrow QVM Equity Factor (QVM), Alerian MLP (AMLP), John Hancock Multifactor Financials (JHMF), Invesco S&P SmallCap 600 Pure Growth (RZG), iShares US Home Construction (ITB), and Direxion All Cap Insider Sentiment (KNOW, which tracks a Sabrient index).
Please email me your thoughts on this article! Do you use the information to gather talking points with your investors? Any and all feedback is appreciated!
IMPORTANT NOTE: I post this information periodically as a free look inside some of our institutional research and as a source of some trading ideas for your own further investigation. It is not intended to be traded directly as a rules-based strategy in a real money portfolio. I am simply showing what a sector rotation model might suggest if a given portfolio was due for a rebalance, and I do not update the information on a regular schedule or on technical triggers. There are many ways for a client to trade such a strategy, including monthly or quarterly rebalancing, perhaps with interim adjustments to the bullish/neutral/defensive bias when warranted, but not necessarily on the days that I happen to post this article. The enhanced strategy seeks higher returns by employing individual stocks (or stock options) that are also highly ranked, but this introduces greater risks and volatility. I do not track performance of the ideas mentioned here as a managed portfolio.
Disclosure: At the time of this writing, the author held short-term short positions on the SPY and IWM.
Disclaimer: This newsletter is published solely for informational purposes and is not to be construed as advice or a recommendation to specific individuals. Individuals should take into account their personal financial circumstances in acting on any opinions, commentary, rankings, or stock selections provided by Sabrient Systems or its wholly owned subsidiary Gradient Analytics. Sabrient makes no representations that the techniques used in its rankings or analysis will result in or guarantee profits in trading. Trading involves risk, including possible loss of principal and other losses, and past performance is no indication of future results.