Sector Detector: Preparing for reflation, expansionary economy, and commodity supercycle
 by Scott Martindale
President & CEO, Sabrient Systems LLC
Investors have endured some unnerving gyrations in the stock market the past couple of weeks. Although the S&P 500 has fully recovered to achieve a new record high on Thursday at 3,960, the formerly high-flying Nasdaq is still 5% below its recent high. The CBOE Volatility Index (VIX) has managed to remain below the 30 handle throughout the turbulence, where it has held since the end-of-January pullback. I have been saying regularly that I am bullish on equities but also expect to see occasional bouts of volatility, and this latest bout was driven by a sudden spike in Treasury yields (to above 1.6% on the 10-year!) due to tepid investor interest in the Treasury auctions and new inflation worries. However, Wednesday’s 10-year auction went just fine, boosting investor comfort. Obviously, a rapid rise in interest rates would wreak havoc on a heavily leveraged US economy, and it would hurt equity valuations versus bonds – especially long-duration growth stocks, which is why the high-flying Tech stocks have borne the brunt of the damage.
Nevertheless, optimism reigns given the explosive combination of rapid vaccine rollout, falling infection rates, new therapeutics (like monoclonal antibodies bamlanivimab and etesevimab), accelerated reopening of the economy, and the massive new fiscal stimulus package, coupled with the Fed’s promise not to tighten – in fact, the Fed may implement yield curve control (YCC) to balance its desire for rising inflation with limits on debt service costs. I see the recent pullback (or “correction” for the Nasdaq Composite) as exactly the sort of healthy wringing-out of speculative fervor that investors wish for (as a new buying opportunity) – but then often are afraid to act upon.
The “reflation trade” (in anticipation of higher real interest rates and inflation during an expansionary economic phase) would suggest overweighting cyclical sectors (Materials, Energy, Industrials, and Financials), small caps, commodities, emerging markets, and TIPS, as well as some attractively valued Technology and Healthcare stocks that offer disruptive technologies and strong growth trends. But investors must be more selective among the high-fliers that sport high P/E multiples as they likely will need to “grow into” their current valuations through old-fashioned earnings growth rather than through further multiple expansion, which may limit their upside. In addition, I think it is prudent to hedge against negative real interest rates and dollar devaluation by holding gold, gold miners, and cryptocurrencies. I elaborate on this below.
Regardless, with Sabrient’s enhanced stock selection process, we believe our portfolios – including the current Q1 2021 Baker’s Dozen that launched on 1/20/21, Small Cap Growth portfolio that launches on 3/15/21, Sabrient Dividend portfolio that launches on 3/19/21, and the Q2 2021 Baker’s Dozen that will launch next month on 4/20/21 – are better positioned for either: (a) continued broadening and rotation into value, cyclicals, and small/mid-caps, or (b) a return to the narrow leadership from secular growth that has been so prevalent for so long.
As a reminder, you can go to http://bakersdozen.sabrient.com/bakers-dozen-marketing-materials to find my latest presentation slide deck and market commentary (which includes an update on the Q1 2020 Baker’s Dozen portfolio that terminates next month), as well as a “talking points” sheet that describes each of the 13 stocks in the newest Q1 2021 portfolio.
I am particularly excited about our new portfolios because, whereas last year we were hopeful based on our testing that our enhanced portfolio selection process would provide better “all-weather” performance, this year we have seen solid evidence (over quite a range of market conditions!) that a better balance between secular and cyclical growth companies and across market caps – combined with a few stellar individual performers – has indeed provided significantly improved performance relative to the benchmark (as I discussed in my January article).
In this periodic update, I provide a comprehensive market commentary, offer my technical analysis of the S&P 500 chart, review Sabrient’s latest fundamentals based SectorCast quant rankings of the ten US business sectors, and serve up some actionable ETF trading ideas. To summarize, our outlook is bullish (but with occasional bouts of volatility, as we have been experiencing), our sector rankings reflect a solidly bullish bias, the technical picture is mixed (neutral to bullish near-term and long-term, but bearish mid-term), and our sector rotation model retains its bullish posture. Read on….
Commentary:
It goes without saying that 2020 was a highly anomalous year in many ways, including a huge selloff that took down many top performers in a highly correlated market flush, followed by a speculative recovery rally (aka “reopening trade”) led at first by the Big Tech darlings and new WFH / ecommerce / digitization / touchless transaction / precision medicine / genomics disruptors, and then rotating into many value/cyclical names that had been left for dead (mostly for good reason). Much of it was highly speculative with little regard for value, accounting practices, or earnings quality given that much of the “real economy” had essentially ground to a halt.
But more recently, economic reports have been looking quite strong, and Q4 2020 earnings reports far surpassed expectations (with +3.2% YOY increase in revenues and +3.9% in earnings). As you may recall, earnings and sales growth were initially expected to be significantly negative for Q4. But today, according to FactSet, YOY earnings growth expectations for 2021 is now at +21.5% in Q1, +49.7% in Q2, +16.9% in Q3, and +13.0% in Q4. Moreover, both investment grade (IG) and high yield (HY) corporate bond spreads recently hit post-pandemic lows, so investors are displaying confidence in the economy.
Amazingly, 4Q2020 earnings and revenues showed YOY growth over the pre-pandemic 4Q2019 numbers. So, as the reopening accelerates, likely faster than many people realize (could we be “fully” reopened by end of summer?), investors once again will be able to scrutinize the actual results reported by companies such that fundamental quality-oriented factors like Sabrient’s would be expected to outperform, along with fundamental active selection, strategic beta, and equal weighting, in my view.
When the rotation into cyclical sectors, the value factor, and smaller caps commenced in earnest at the beginning of November, I predicted the trend would continue, and indeed it has. The chart below shows the relative performance since the close on 10/30/21 through the close on 3/11/21 for various representative ETFs. In particular, note how the Invesco S&P SmallCap 600 Pure Value (RZV) is up +81% vs. the Invesco S&P 500 Pure Growth (RPG) at just +17%, illustrating the dramatic convergence (of a lengthy and historic divergence), with small caps and value stocks racing to catch up to large caps and growth stocks.
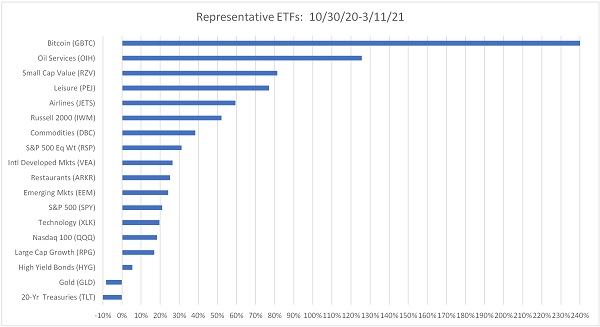
When Q1 earnings season kicks in next month, value stocks should benefit from relatively easy YOY comparisons, while growth stocks face tougher comps. As a result, market breadth has widened considerably over the past several months from the narrow mega-cap leadership that was so pervasive for so long. Equal weighting tends to outperform cap weighting during periods of economic strength, rising commodity prices, rising longer-term interest rates, and lower volatility. And indeed, the Invesco S&P 500 Equal Weight (RSP) has outperformed the cap-weighted SPDR S&P 500 (SPY) over the 10/30/20-3/11/21 timeframe (+31% vs. +21%). And on a trailing 12-month (TTM) basis, RSP is +54% vs. SPY at +46%, while RZV is +143%, Russell 2000 small caps (IWM) is +87%, iShares MSCI Emerging Markets (EEM) is +49%, and the long-shunned VanEck Vectors Oil Services (OIH) is +140%.
The tailwinds sure seem strong and durable, including falling COVID infection rates and highly effective vaccines and therapeutics that have opened the door for a rapid emergence from the economic effects of both the pandemic and the China trade war. In addition, we have healthy banks; rising corporate earnings, outlooks, and capex expectations; strong corporate balance sheets with high cash balances; escalation in corporate buybacks; stable (or rising) dividends; “reflation” after 30 years of disinflation (due to aging demographics, globalization, and tech disruption); unlimited global liquidity and massive pro-cyclical fiscal and monetary stimulus; low interest rates and perhaps yield curve control (YCC); pent-up consumer demand for travel and entertainment; modest taxes and a postponement in any new taxes or regulations until the economy is on stronger footing; and of course, an unflagging entrepreneurial spirit bringing the innovation, disruption, and productivity gains of rapidly advancing technologies like 5G, IoT, robotics, autonomous vehicles, AI/ML, virtual reality, cloud computing, 3-D printing, blockchain, computer vision (CV), and automated manufacturing that provide a boost across all industries.
And don’t ignore the huge cash balances on the sidelines, including $5 trillion in money market funds. In January, the personal savings rate (as a percentage of disposable income) hit 20.5%, as reported by the BEA. According to DataTrek, “US physical cash in circulation ended 2020 with 15% annual growth, a level unseen since the Y2K cash flush. Cash hoarding is a reliable signal of economic bottoms.”
David Kostin of Goldman Sachs predicts retail investors will be the largest source of equity demand this year (at about $350 billion), which has typically happened during periods of accelerating economic growth over the past 30 years. Furthermore, corporate demand through buyback programs is already pacing 50% higher than last year at this time, and Kostin predicts buybacks will total about $300 billion (net of new issuances).
Also, both investment grade (IG) and high yield (HY) corporate bond spreads have tightened (i.e., low perceived risk) to levels near or below their pre-crisis lows (although they have risen a bit during the recent market volatility) as investors seem confident about economic recovery and broadly improving corporate cash flows. The ICE BofA US IG spread is currently 104 bps, ICE BofA US HY spread is 363 bps, and the TED spread (between 3-Month LIBOR and 3-Month Treasury Bill) is a modest 14 bps.
The only caveat in my view is that although stocks historically do well during periods of economic growth and rising interest rates, we are dealing with an historically high level of indebtedness ($28 trillion of national debt, $82 trillion of total debt in the US, and a Fed balance sheet that has risen by $3.4 trillion in just over a year to over $7.5 trillion). Moreover, the latest $1.9 trillion COVID-19 relief bill comes on the heels of last year’s $3 trillion in fiscal stimulus, and the Biden Administration is working on a spending package that may provide another $3 trillion for a host of Democratic priorities, including infrastructure investment and the Green New Deal (GND). So, corporate earnings growth is going to have to outpace the rise in interest rates (and associated debt servicing costs) – which I expect will happen.
Money supply, interest rates, and inflation:
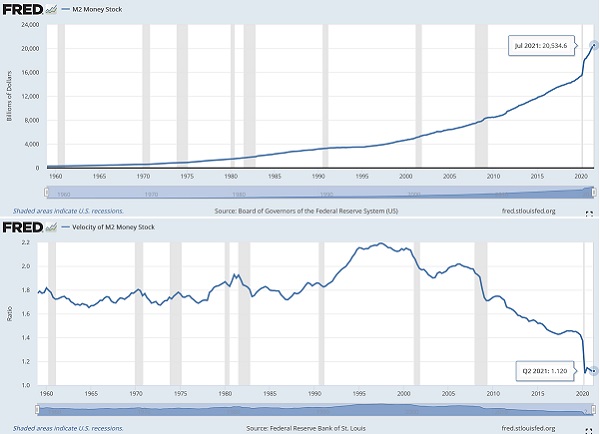
Given that stocks have been so greatly impacted lately by any perceived change in the direction of inflation and interest rates, I’d like to discuss this topic a bit deeper. It is true that the 5-year TIPS breakeven rate has risen to 2.47% as of 3/10/21, which exceeds 2011 levels and is now approaching pre-GFC levels from 2008. But this move may be temporary due to dislocations during the early stages of economic reopening. Much has been made about the astounding 27% rise in M2 money supply growth since the end of 2019 to a record high today, as shown in the first chart below. So, why no massive spike in inflation? Well, as shown in the second chart, you also must consider the velocity of M2 money supply, which recently hit a record low (currently at 1.134x), indicating little multiplier effect on the money being injected into the economy. Stimulating the Velocity of Money has been a challenge, as the St. Louis Fed shows that it has been in a downtrend since 1981 (when it measured about 3.5x). Thus, there has been little inflationary impact.
During the Financial Crisis, the Fed’s liquidity injections primarily went directly into bank reserves to deleverage a shaky banking system such that money supply growth lagged base money growth. But today, that is not the case as bank balance sheets are strong. So, the current monetary policies of unlimited liquidity and ultra-low interest rates means that there is little more the Fed can do to boost economic activity and inflation other than stand aside (and not tighten).
It has been pointed out that today’s situation is reminiscent of the early 1960s when inflation did not accelerate until demand began to outstrip supply while monetary and fiscal policies remained accommodative. Boosting the money multiplier effect will require a fully reopened economy and fiscal policies like tax incentives, deregulation, and government spending projects (e.g., infrastructure) to stimulate corporate capex, hiring, and wage growth – and by extension consumer and business confidence, consumer spending, aggregate demand, and inflation.
Investors got a little frantic watching rates climb rapidly from 0.92% on the 10-year Treasury at the end of 2020 to over 1.60% just recently, given that our highly leveraged economy depends upon interest rates staying low so that debt servicing costs remain manageable. The 30-year Treasury yield closed Thursday 3/11/21 at 2.28%, while the 10-year T-note is at 1.53%, the 2-year T-note 0.143%, and the 3-month T-bill 0.038%. So, the 3-month/10-year spread has steepened to +149 bps and the 2-10 spread is +139 bps, which are starting to look “normal” for this point in an economic cycle.
The market likes to climb a “wall of worry,” so as virus fears subside, it appears that worries of rampant inflation and premature Fed tightening have taken the baton. A rising 10-year Treasury yield implies increasing confidence in economic recovery, but it cannot rise too high without causing some damage to our heavily leveraged economy. While fed funds futures indicate some investor expectation of a rate hike later this year, I think it is quite unlikely. Instead, I think the Fed may choose to tweak policy in some way, perhaps even at its upcoming FOMC meeting on 3/17/21, to assuage investor concerns. Might we see another Operation Twist (i.e., sell the short end and buy the long end of the curve)? Or perhaps a direct comment on YCC?
Research Affiliates recently observed that the equity risk premium versus bonds is close to its historical average, which helps to justify current equity valuations. But if long-term rates do try to rise too quickly, the Fed may choose to implement yield curve control (YCC) by holding the 10-year Treasury to a max of, say, 2.0-2.5%. This could perpetuate negative real interest rates, i.e., nominal interest rates below the level of inflation, but would be the same tactic employed during and after World War II when interest rates were held below the inflation rate for nearly 10 years to support economic recovery. Regardless, high growth expectations, pricing power, and increasing cash flows should offset the debt service.
YCC would be favorable for US equities and corporate bonds (both IG and HY), as well as gold and other commodities, as real yields and the dollar fall. In fact, given plans for major infrastructure investment and investment and incentives for alternative energy, I think we are entering a “commodity supercycle,” which implies inflationary pressures. But I don’t believe it will entail the rapid rise in inflation that many are predicting – certainly not a continuation of the rise we have seen recently due to constraints on production capacity – simply because there are still many disinflationary factors in play like aging demographics, slowing global population growth, re-globalization of trade and supply chains, and technological disruption that can offset the inflationary drivers.
By the way, the global push to address climate change is yet another of the drivers of a “commodities supercycle” and an accelerating need to mine for rare earth metals and lithium (since a typical battery-powered car needs 20 lbs of lithium.
A liquidity trap?
Today’s combination of massive monetary and fiscal policy with the extreme political and technological disruption is truly unprecedented. The Fed knows that monetary policy alone has hit its limits, which is why it has been urging Congress for quite some time to take the wheel (or at least help the cause) with fiscal stimulus. Well, Congress has come through, but the Fed still must print the money to fund the massive federal deficit spending, including stimulus checks, Payroll Protection Program (PPP), bailouts of schools and state & local governments (and perhaps ultimately their pension liabilities), an infrastructure bill, GND, expanded healthcare, shortfalls in Social Security, and whatever else comes down the pike.
As a result, the Fed now finds itself in a “liquidity trap” in which interest rates must remain low while debt keeps growing (at an accelerating pace). With a growing proportion of the federal budget going to debt service and social welfare programs rather than productive investments, the hope is that fiscal stimulus programs can help turbocharge corporate earnings growth such that tax receipts accelerate while rising inflation gradually devalues the amount of debt owed. For now, the debt service is manageable and growth is promising, but longer term remains uncertain. However, because the US is not alone in this debt bind (and potential “Minsky Moment”), I’m wondering if the solution might be some kind of coordinated effort among the major global economies to cancel/forgive the sovereign debt held by their central banks. Inflationary, you say? Not so much if all the major economies do the same thing in unison. And then, preferably, I would like to see a return to the gold standard. But as usual, I digress.
Final comments:
I have heard commentators cautioning that February of 2021 bears an eerie likeness to February of 2000, when the dot.com bubble was bursting and a major bear market was just getting underway. But looking back to what caused the dot.com bubble and ultimate selloff, it is evident to me that today’s situation is quite different. First, the leading Tech names today are not just speculative business models with no earnings and weak balance sheets. Profitability, cash flow generation, and cash balances throughout the sector are all much higher today than in 2000, while the cost of capital is much lower. Moreover, most of the leading Tech companies today enjoy steady and reliable secular growth stories (rather than the cyclical Y2K spending surge), and our burgeoning economic reopening appears poised to launch a new expansionary economic growth cycle favorable to the continued development and adoption of new technologies.
Regardless, after 30 years of disinflation and 39 years of falling rates, the ducks have lined up for a sustained change of character in these cyclical trends – much more so than during the last (sluggish) post-GFC recovery – with a much longer-lasting recovery/expansionary economic cycle and a more gradual inflationary climate than many are forecasting, in my view.
I think the key is to remain bullish and invested in both cyclical and secular growth equities but refrain from chasing the big momentum stocks that prospered from the changes in our work and leisure activities caused by the pandemic. Moreover, I expect fundamental active selection, strategic beta ETFs, and equal weighting will outperform the cap-weighted passive indexes that have been so hard to beat over the past few years. This should be favorable for Sabrient’s enhanced growth-at-a-reasonable-price (aka GARP) approach, which combines value, growth, and quality factors while providing for a more “all-weather” portfolio with balance between secular growth and cyclical/value stocks and across market caps.
Moreover, I think commodities, emerging markets, and TIPS are good bets, with hedges in gold, gold miners, and cryptocurrencies. Keep in mind, while TIPS help to preserve capital in the face of rising inflation, gold tends to rise (as a “store of value”) when real interest rates (nominal rates minus inflation) are negative and the dollar is weakening, regardless of the direction in nominal interest rates – such as if the Fed implements yield curve control, which I think is likely. In other words, rising real interest rates mean a higher opportunity cost of holding non-interest-bearing assets like gold (i.e., good for TIPS but bad for gold); however, gold would benefit from a softer US dollar due to “lower-for-longer” interest rates, rising debt levels, and global central banks diversifying exposure to the US dollar by shifting reserves into gold and other reserve currencies (e.g., euro, yuan, yen, Swiss franc). As for cryptocurrencies (e.g., bitcoin, ether, and other altcoins) besides having a growing use case, they also help hedge against a devaluation and loss of confidence in fiat currencies globally.
By the way, I also favor some exposure to startups (e.g., through crowdfunding sites, thanks to Reg CF in 2016) and cannabis (due to solid growth in Canada and a growing push for federal legalization in the US) for both reasonable speculation and portfolio diversification.
SPY Chart Review:
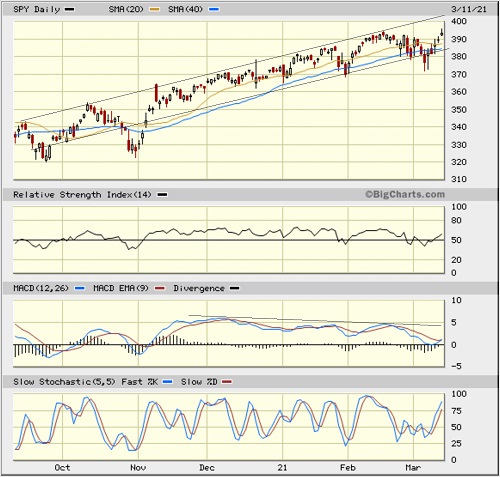
The SPDR S&P500 Trust (SPY) closed out Thursday at 393.53 after attaining a new record intraday high. It continues its 4.5-month internal broadening and rotation into the value and cyclical sectors. Notably, since the value rotation kicked in decisively on 11/1/20, the Invesco S&P 500 Equal Weight ETF (RSP) has outperformed the SPY by 10 percentage points (pps) while the Russell 2000 small caps (IWM) have outperformed by a whopping 31 pps! The daily chart below displays a 6-month bullish rising channel that continues to hold at both resistance and support, albeit with a few downside violations (due to various negative news events) that quickly reversed. Price is now back in the center of the channel with a neutral posture, and although oscillators RSI, MACD, and Slow Stochastics are all pointing upwards, all could go either way from here, and MACD displays a negative divergence (lower highs).
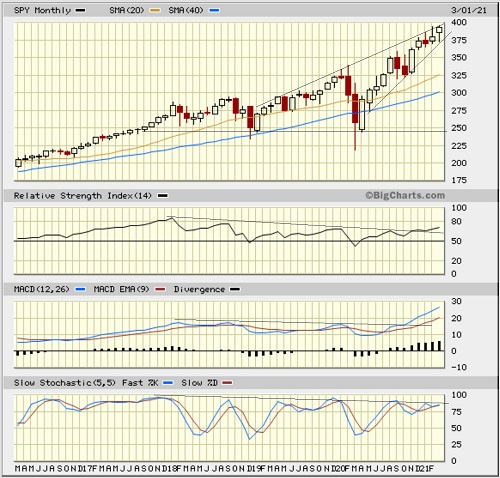
However, below is a monthly chart that looks a bit more ominous. Notice that as price has risen over the past couple of years, oscillators RSI, MACD, and Slow Stochastics display a negative divergence (lower highs), although MACD has broken out decisively to the upside over the past 4 months, corresponding with the value rotation. However, I fear that price is forming a bearish ascending wedge formation, while also stretching much too far above its 20-month simple moving average. Also, you can see that last month formed a bearish “inverted hammer” candlestick pattern, and March so far is forming a bearish “hanging man” candlestick pattern. So, I think there is a good chance we will see some price consolidation and churning in place, if not an outright pullback to “fill gaps” and test support levels (including the rising 20-month SMA).
Latest Sector Rankings:
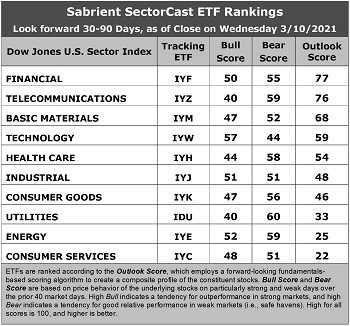
Relative sector rankings are based on our proprietary SectorCast model, which builds a composite profile of each of over 900 equity ETFs based on bottom-up aggregate scoring of the constituent stocks. The Outlook Score employs a forward-looking, fundamentals-based multifactor algorithm considering forward valuation, historical and projected earnings growth, the dynamics of Wall Street analysts’ consensus earnings estimates and recent revisions (up or down), quality and sustainability of reported earnings, and various return ratios. It helps us predict relative performance over the next 2-6 months.
In addition, SectorCast computes a Bull Score and Bear Score for each ETF based on recent price behavior of the constituent stocks on particularly strong and weak market days. A high Bull score indicates that stocks within the ETF recently have tended toward relative outperformance when the market is strong, while a high Bear score indicates that stocks within the ETF have tended to hold up relatively well (i.e., safe havens) when the market is weak.
Outlook score is forward-looking while Bull and Bear are backward-looking. As a group, these three scores can be helpful for positioning a portfolio for a given set of anticipated market conditions. Of course, each ETF holds a unique portfolio of stocks and position weights, so the sectors represented will score differently depending upon which set of ETFs is used. We use the iShares that represent the ten major U.S. business sectors: Financial (IYF), Technology (IYW), Industrial (IYJ), Healthcare (IYH), Consumer Goods (IYK), Consumer Services (IYC), Energy (IYE), Basic Materials (IYM), Telecommunications (IYZ), and Utilities (IDU). Whereas the Select Sector SPDRs only contain stocks from the S&P 500 large cap index, I prefer the iShares for their larger universe and broader diversity.
Here are some of my observations on this week’s scores:
1. Notably, the top 3 are closely bunched within 9 points of each other. Financial remains in the top spot with an Outlook score of 77, which is somewhat low for a top score and lacks conviction. The sector displays good sell-side analyst sentiment (recent positive net revisions to EPS estimates), good return ratios, a reasonable forward P/E of 18.6x, an attractive forward PEG (forward P/E divided by projected EPS growth rate) of 1.73, and the best insider sentiment (open market buying). Telecom is close behind in the second spot with an Outlook score of 76, given its low forward P/E of 13.3x, good analyst sentiment, and reasonable return ratios. Rounding out the top six are Basic Materials, Technology, Healthcare, and Industrial, which is bullish. Of the 10 sectors, only Healthcare has net negative revisions to EPS estimates.
2. The bottom two sectors once again are Consumer Services (Discretionary/Cyclical) with an Outlook score of 22, despite having one of the highest projected EPS growth rates at 14.9%, and Energy at 25, despite continuing to display strong positive revisions to EPS estimates. Energy has long been the cellar-dweller given its poor near-term growth prospects and high forward P/E and PEG ratios, but its PEG is falling precipitously (now at 1.76) as oil catches a bid and analysts are raising EPS estimates. Notably, high-flying Technology has jumped in the rankings due to its forward P/E falling from around 30.0x to 26.2x today (thanks to its price correction), which is a reasonable valuation given its strong growth rate of 15.4% and suddenly modest PEG of 1.70.
3. Looking at the Bull scores, Technology displays the top score of 57, followed by Energy at 52, as stocks within these sectors have displayed relative strength on strong market days. Utilities scores the lowest at 40. The top-bottom spread of 17 points reflects fairly low sector correlations on strong market days. It is desirable in a healthy market to see low correlations reflected in a top-bottom spread of at least 20 points, which indicates that investors have clear preferences in the market segments and stocks they want to hold.
4. Looking at the Bear scores, defensive sector Utilities scores the highest at 60, followed by Energy and Telecom at 59 and Healthcare at 58, as stocks within these sectors have been the preferred safe havens lately on weak market days. Technology displays by far the lowest score of 44, as investors have fled in droves during recent market weakness. The top-bottom spread of 16 points reflects moderately low sector correlations on weak market days. Ideally, certain sectors will hold up relatively well while others are selling off (rather than broad risk-off behavior), so it is desirable in a healthy market to see low correlations reflected in a top-bottom spread of at least 20 points.
5. Financial displays the best all-around combination of Outlook/Bull/Bear scores, while Consumer Services (Discretionary/Cyclical) is the worst. Looking at just the Bull/Bear combination, Energy is by far the best, followed by Financial, indicating superior relative performance (on average) in extreme market conditions (whether bullish or bearish). Both represent economically sensitive value/cyclicals market segments. Consumer Services (Discretionary/Cyclical), Telecom, and Materials all tie for the worst.
6. This week’s fundamentals-based Outlook rankings display a solidly bullish bias, given that 5 of the top 6 sectors are economically sensitive. The near-term earnings outlook in our fundamentals-based model continues to gain visibility as a nascent reopening has begun. Keep in mind, the Outlook Rank does not include timing, momentum, or relative strength factors, but rather reflects the consensus fundamental expectations at a given point in time for individual stocks, aggregated by sector.
ETF Trading Ideas:
Our Sector Rotation model, which appropriately weights Outlook, Bull, and Bear scores in accordance with the overall market’s prevailing trend (bullish, neutral, or defensive), continues to display a bullish bias and suggests holding Technology (IYW), Financial (IYF), and Industrial (IYJ), in that order. (Note: In this model, we consider the bias to be bullish from a rules-based trend-following standpoint when SPY is above both its 50-day and 200-day simple moving averages.)
If you prefer a neutral bias, the Sector Rotation model suggests holding Financial, Telecom, and Basic Materials, in that order. On the other hand, if you are more comfortable with a defensive stance on the market, the model suggests holding Telecom, Financial, and Utilities, in that order.
An assortment of other interesting ETFs that are scoring well in our latest rankings include iShares US Home Construction (ITB), Invesco International Dividend Achievers (PID), First Trust Dorsey Wright Momentum & Value (DVLU), First Trust Financial AlphaDEX (FXO), First Trust Dividend Leaders (FDL), SPDR S&P Capital Markets (KCE), WBI Power Factor High Dividend (WBIY), iShares Mortgage Real Estate (REM), iShares Focused Value Factor (FOVL), Invesco Dynamic Building & Construction (PKB), WBI BullBear Yield 3000 (WBIG), VanEck Vectors Steel (SLX), WisdomTree US High Dividend (DHS), VanEck Vectors BDC Income (BIZD), Invesco BuyBack Achievers (PKW), First Trust NASDAQ Technology Dividend (TDIV), First Trust NASDAQ Bank (FTXO), Invesco S&P MidCap Value with Momentum (XMVM), VanEck Vector Semiconductor (SMH), and ETFMG Treatments Testing & Advancements (GERM).
As always, I welcome your thoughts on this article! Please email me anytime. Any and all feedback is appreciated!
IMPORTANT NOTE: I post this information periodically as a free look inside some of our institutional research and as a source of some trading ideas for your own further investigation. It is not intended to be traded directly as a rules-based strategy in a real money portfolio. I am simply showing what a sector rotation model might suggest if a given portfolio was due for a rebalance, and I do not update the information on a regular schedule or on technical triggers. There are many ways for a client to trade such a strategy, including monthly or quarterly rebalancing, perhaps with interim adjustments to the bullish/neutral/defensive bias when warranted, but not necessarily on the days that I happen to post this article. The enhanced strategy seeks higher returns by employing individual stocks (or stock options) that are also highly ranked, but this introduces greater risks and volatility. I do not track performance of the ideas mentioned here as a managed portfolio.
Disclosure: At the time of this writing, among the securities mentioned, the author held positions in SPY, EEM, gold, and bitcoin.
Disclaimer: This newsletter is published solely for informational purposes and is not to be construed as advice or a recommendation to specific individuals. Individuals should take into account their personal financial circumstances in acting on any opinions, commentary, rankings, or stock selections provided by Sabrient Systems or its wholly owned subsidiary, Gradient Analytics. Sabrient makes no representations that the techniques used in its rankings or analysis will result in or guarantee profits in trading. Trading involves risk, including possible loss of principal and other losses, and past performance is no indication of future results.