Sector Detector: Stocks are itching for year-end breakout rally, but who will lead it?
 by Scott Martindale
President, Sabrient Systems LLC
The early weeks of September were looking so promising as a brief but impressive surge gave hope of a revival in the long-neglected market segments. This sustained risk-on rotation seemed to be marking a bullish change of market character from the risk-off defensive sentiment that I have been writing about extensively for the past 18 months (ever since the China trade war escalated in June of last year), specifically the massive divergence favoring the low-volatility, growth, and momentum factors, defensive sectors, and large caps over the value and high-beta factors, cyclical sectors, and small-mid caps. But then, for the next few weeks, those risk-on market segments were once again lagging, as fickle investors keep returning to stocks displaying stronger balance sheets, high dividend yields, and/or secular growth stories – in spite of high valuations – rather than the more speculative cyclical growth stocks selling at attractive valuations that typically lead an upside breakout. It appeared that the fledging bullish rotation was caput – or perhaps not. Suddenly, there have been positive developments in the trade negotiations and in the Brexit saga, and the past several days have brought back renewed signs of a pent-up desire to take stocks higher. Signs of a better than expected Q3 earnings season may be the final catalyst.
Of course, although YTD returns in US stocks are impressive, if you look back over the past year to when the major indexes peaked in 3Q2018, stocks really have made very little headway. As of the close on Tuesday, the S&P 500 is +21.3% YTD but only +1.7% since its 2018 high on 9/20/18, while the more speculative Russell 2000 small cap index is still more than -12% below its all-time high from over a year ago – way back on 8/31/18. The biggest difference this year versus the 9/20/18 high for the S&P 500 is that Treasury yields have fallen (from 3.1% to about 1.8% on the 10-year), which has allowed for P/E multiple expansion (from 16.8x last year to 17.2x today) despite the earnings recession of the past three quarters.
I suppose one can hardly blame investors for their trepidation at this moment in time, given the overabundance of extremely negative news, which only expanded during Q3. We have an intractable trade war with the world’s second largest economy, intensifying protectionist rhetoric, North Korean missiles, rising tensions with Iran, a brewing war in northern Syria, drone attacks in Saudi Arabia, riots in Hong Kong, China’s feud with the NBA (and the animated TV show South Park!), a slowing global economy, a US corporate earnings recession, flattish yield curve, surging US dollar, low-yield/high-volatility Treasury bonds, falling consumer sentiment, Business Roundtable’s CEO Economic Outlook Index down six consecutive quarters (as hiring is strong but capital investment and sales expectations lag), the steepest contraction in the manufacturing sector since June 2009, UAW strike against General Motors (GM), looming Hard Brexit, top-polling Democratic candidates espousing MMT and business-unfriendly socialist policies, and yet another desperate attempt to impeach the President before the next election. Need I go on?
But somehow the US economy has maintained positive traction while stocks have held their ground given a persistent economic expansion, supported by dovish central banks around the world and a rock-solid US consumer. Indeed, the very fact that stocks have held up amid such a negative macro environment suggests to me that investors are just itching for a reason to rotate cash and pricey bonds into stocks – perhaps in a big way. And from a technical standpoint, such a long sideways consolidation over the past several months suggests that an upside breakout may be imminent – and likely led by those risk-on market segments. Notably, every such bullish rotation has helped Sabrient’s various growth-at-a-reasonable-price (GARP) portfolios gain ground against the SPY benchmark, so a sustained rotation would be quite welcome!
And some good news this week is offering some hope, with strong Q3 earnings reports from JPMorgan Chase (JPM) and UnitedHealth (UNH), a resumption in trade talks, progress in the GM strike, and a possible breakthrough in the Brexit negotiations. Moreover, the highly cyclical semiconductor and homebuilding industries are on fire, with iShares PHLX Semiconductor ETF (SOXX) setting a new high, and Treasury yields are creeping up.
By the way, our Sabrient Select SMA portfolio (separately managed account wrapper) is available to financial advisors as an alternative investment opportunity. The portfolio actively manages 25-35 stocks based on our “quantamental” GARP strategy. Let me know if you’d like more information.
In this periodic update, I provide a detailed market commentary, offer my technical analysis of the S&P 500, review Sabrient’s latest fundamentals-based SectorCast rankings of the ten US business sectors, and serve up some actionable ETF trading ideas. In summary, our sector rankings now look neutral to me, while the technical picture remains bullish, and our sector rotation model retains a solidly bullish posture. Read on…
Market Commentary:
A solid year so far, and optimism about Q4:
Through September, the S&P 500 posted an impressive total return of +20.6%, marking its best first nine months of any year since 1998. But because of the dismal 4Q2018 performance, it has mainly been making up lost ground, and remains below its all-time high of 3,026 from 7/26/19. Although all eleven GICS sectors were up during September, the top-performer YTD is Technology at +31.4%, while the worst is Healthcare at +5.6%. During Q3, the leading market segments were the highly defensive Treasury bonds, gold, Utilities, and Consumer Staples, while the laggards were the highly cyclical sectors Metals & Mining, Energy, Basic Materials, and Banking, along with the aforementioned Healthcare – likely due to threatening presidential campaign rhetoric attacking drug pricing (sounds like 2015 redux) and “Medicare for All.” In fact, fund flows into Healthcare funds have been negative on a rolling 3-month basis for the past 6 months, which should be surprising given the solid earnings trends within the sector.
Interestingly, while high-flying Technology is among the worst for EPS growth forecast, laggard Healthcare is among the best. FactSet reported that companies in the Healthcare sector are expected to report the highest YOY revenue growth this quarter, following a Q2 in which 97% of firms beat earnings expectations, and guidance has been relatively strong (with a preponderance of analyst upgrades). So, what gives? Well, given the harsh election rhetoric, it appears that investors are skeptical of the rosy outlook – yet another example of fickle, headline-driven investor behavior that can be so upsetting. The last time Healthcare flows were so negative was during the previous US presidential campaign, when Hillary Clinton was harping on drug price gouging. Nevertheless, intrepid investors may find this sector to be a good contrarian play.
As Q3 corporate earnings season gets underway, investors will be closely watching for clues on margin compression, capital spending, and forward guidance. In addition, the FOMC meets on October 30, and the Brexit deadline is October 31. The pervasive negative news has been starting to chip away at the strong consumer sentiment, as the Consumer Confidence Index came in at 125.1, down from 134.2 the previous month. However, this is still a robust number from an historical perspective (recall that during the last recession the index dropped to a low of 38). Furthermore, individual income tax withholding receipts have been quite strong, the percentage of “job leavers” is at lofty levels (showing confidence in the labor market), and the latest jobs report was solid (with unemployment at 3.5%). Also, the AAII reported last week that bullish sentiment among individual investors dropped to 20%, the lowest since May 2016, which is usually bullish as a contrarian indicator. So, unless we start to see companies cutting jobs in earnest (perhaps due to surging wages and falling margins), there seems to be little reason to worry, and the US consumer appears to be in fine shape.
Another key concern you often see written about is rising debt levels, with the total public debt reaching a record high $22.5 trillion. But as I often point out, a favorite tactic of the doomsayers is to talk about a given metric in isolation and out of context. In this case, as First Trust has pointed out, the net interest owed on the debt is only about 1.8% of GDP (compared to, for example, an average of 2.7% during the period 1980-2001), as borrowers enjoy ultra-low interest rates. And when you also consider the value of assets held, US household net worth (assets minus liabilities) registers near a record high at 4.3x GDP.
As for the incessant talk about the yield curve inversion and generally low yields, both of which are normally signs of economic pessimism (thus driving capital into the safety of bonds) and imminent recession, I have often discussed the many other factors at play, including abundant global liquidity and the flight of capital into the relatively attractive yields in the US. Moreover, there has been no commensurate widening of credit spreads, which would indicate greater risk of defaults among lesser quality issuers. But the TED spread is only 33 bps, which is quite well within the 10-50 bps considered normal and calm. In addition, Moody's reported that its global speculative-grade default rate stood at 2.4% in September, versus an historical average default rate of 4.1%. Moreover, recessions are normally preceded by fiscal tightening (i.e., higher taxes, reduced spending, or onerous regulation), which is not the case under President Trump, or monetary tightening (i.e., raising rates and pulling liquidity out of the financial system), which is not in Fed chair Jay Powell’s playbook now, either.
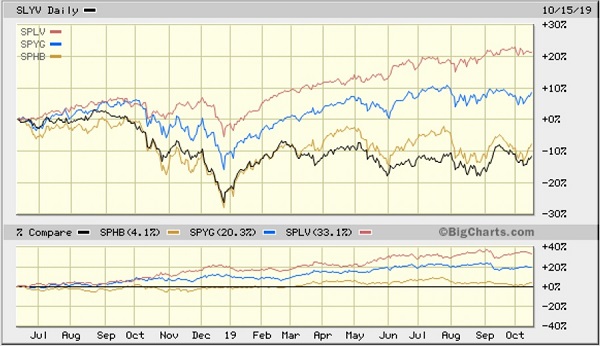
Again, I have been writing in previous articles about the huge performance divergence that has been building since 6/11/18 (when the trade war escalated in a big way) between the low-volatility, growth, and momentum factors, bond-proxy (solid dividend-paying) defensive sectors, and large caps over the value and high-beta factors, cyclical sectors, and small-mid caps. The latter are generally more speculative and historically tend to show leadership in a healthy economy and rising stock market. So, to provide an update, the chart below illustrates the approximate -32 percentage points (pps) underperformance of SPDR S&P 600 Small Cap Value (SLYV), down -11% since 6/11/18, versus Invesco S&P 500 Low Volatility (SPLV) up about +21%. Also shown for comparison are the investor-favorite SPDR S&P 500 Growth (SPYG) and the more-speculative Invesco S&P 500 High Beta (SPHB). You can see the handful of risk-on rally attempts ever since the Christmas Eve capitulation day, with each being led by SLYV and/or SPHB.
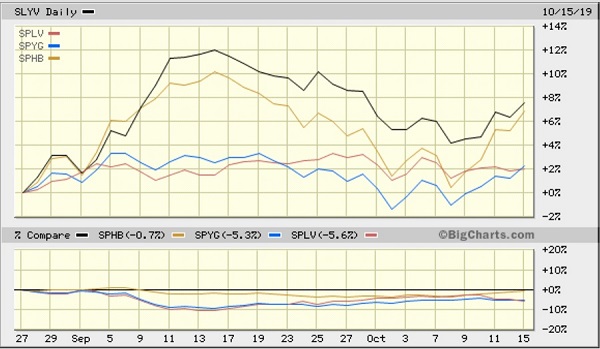
And zooming in to look just since 8/27/19, when the market seemed to want to close that massive divergence in a hurry, you can see that after pulling back from their rapid rally, SLYV and SPHB are again leading the charge over the past several days (albeit along with SPYG) at the expense of low-volatility SPLV.
Historically, because value stocks tend to be cyclical and capital intensive (e.g., airlines, semiconductors, homebuilders, and industrial equipment makers, along with the banks that support those industries), the value factor has tended to outperform during risk-on recovery periods but also tends to lag during economic slowdowns. As such, value companies typically perform better when the economy is growing and the yield curve is steepening. But because of the pervasive uncertainty, primarily involving the China trade war, Brexit, global growth, and US political disharmony and elections (including last year’s mid-cycle election), investors have preferred to play the momentum and growth factors focused on secular growth (rather than cyclical growth) stories in the Technology sector, as well as solid dividend-paying “bond proxies” like Utilities and Consumer Staples stocks with robust balance sheets.
Interest rates, GDP, and corporate earnings:
At its September meeting, the FOMC raised the fed funds rate by 25 bps, as was widely expected. Fed chair Powell said the committee is examining ways to help the central bank “symmetrically and sustainably” achieve its 2% inflation target. Looking ahead to the October 30 meeting, CME Group fed funds futures are showing 73% probability of another 25-bp rate cut, which would bring the rate down to the 1.50-1.75% range. But by the January meeting, there’s only a 35% chance of another cut. I’m hoping that they don’t feel a need to cut any further after this month, as a good earnings season and an interim trade deal (that removes tariffs and boosts Chinese purchases of US goods) would be all the catalysts needed to get at least some increase in corporate capital spending plans and entice a continued rotation of cash off the sidelines and out of long-term bonds and into attractive GARP and value stocks.
The 30-year Treasury yield closed Friday at 2.23%, while the 10-year T-note is at 1.77%, the 2-year T-note 1.62%, and the 3-month T-bill 1.67%. So, the 3-month/10-year spread is no longer inverted at +10 bps, while the more closely followed 2-10 spread is +15 bps. The US continues to pay much more lucrative yields compared with other developed markets, which continues to attract capital and suppress rates. Troubled Italy’s 10-year pays only +1.05%, while Canada is +1.56%, Australia +1.06%, UK +0.70%, France at -0.15%, Japan -0.17%, and Germany -0.40%. (Notably, only the 30-year pays a positive yield in Germany.)
As for US GDP, following Q1 growth of +3.1%, the BEA’s third estimate of Q2 growth (as of 9/26) is +2.0%. For 3Q2019, the Atlanta Fed’s GDPNow model issued an updated estimate (as of 10/26) of +1.8% GDP growth, while the NY Fed’s NowCast sees +2.0% for Q3 (as of 10/11) and +1.3% for Q4, and the St. Louis Fed NowCast sees a more robust (and rising) +3.3% (as of 10/11). Looking globally, the IMF just lowered its forecast for 2019 global growth to 3.0% (which would be the weakest since 2008), primarily due to the trade war impacts, and cut US expectation to 2.4%. The implication is that stimulating stronger growth is now up to politicians rather than central banks.
The road ahead:
The current climate seems a lot like 2015-2016, with concerns about economic growth, an earnings recession, manufacturing contraction offset by a strong consumer, China’s slowing growth and currency manipulation, Fed policy changes in the midst of ultra-low interest rates, and a contentious election campaign (including attacks on the Healthcare sector). The biggest difference is the trade war, which of course is quite a big thing.
But despite all the doom-and-gloom propagating the airwaves, which seems bound-and-determined (whether intentional or not) into creating a US recession through self-fulfilling prophesy, I think investors should chill and take heart. Overall, the US economy remains solid, as the weak manufacturing segment is only about 10% of the overall economy, while the consumer remains quite strong, interest rates and debt carrying costs are low, credit spreads are tight, and the sell-side analyst community still forecasts rising corporate revenues and positive earnings growth resuming in Q4 and beyond. And despite low yields and a flattish yield curve (distorted by massive global capital inflows), both of which historically indicate impending recession, the reality is that recessions are usually preceded by widening credit spreads, spiking oil prices, rising interest rates from a hawkish Fed (to suppress runaway inflation, surging wages, and an overheated economy), none of which are in play right now – or even in the foreseeable future. I still believe we have at least a few years left in this cycle.
To be sure, whenever a risk-on rotation has tried to get traction, nervous investors (exacerbated by program trading) have continually retreated back to the safety of bonds, “bond-proxy” defensive sectors, low-volatility factor strategies, and other risk-off segments. Of course, despite numerous instances of optimism about the trade talks with China and a possible interim deal, it still has not happened, and both parties and many outside pundits are coming to the realization that a comprehensive agreement simply may not be in the cards anytime soon.
As I have written about extensively in the past, simply doing business with and in China and allowing it into the WTO has required us to compromise our values and ideals to an extent, and now we are suddenly waking up to the existential ramifications of China’s incredible success at leveraging our compromises. To suddenly forgo its long-standing unfair trade practices may be more destructive in the long run to China’s plans for global hegemony (economic, technological, and military) than some pesky tariffs, given its reliance on those practices to power its incredible growth – after all, it is so much more expedient and lucrative for China to continue operating the way we have allowed them to.
Although the media is breathlessly covering the impeachment inquiry, the bigger issue for Trump’s reelection is that he finds himself between a rock and hard place regarding China. He desperately wants/needs to get past the trade war and get something done before stagnant corporate capital spending and flagging consumer sentiment pushes the economy into recession, while still extracting some semblance of significant commitments from China on fairer trade practices, not to mention national security concerns (e.g., Huawei and spying). But while China is absorbing the brunt of the damage of the trade war, its leaders are willing to string things out even longer (while further inflating its massive debt bubble), knowing that Trump has a much firmer deadline to deal with (the 2020 election). So, a few token baby steps may be the best Trump can get before the election.
Nevertheless, with plenty of idle cash on the sidelines, additional capital rotating out of pricey bonds, and with hedge funds and individual investors under-allocated to equities, I believe there is plenty of fuel for an upside breakout in Q4. And given that the Financial sector dominates the small cap and value indexes, if the yield curve continues to steepen (perhaps from a rotation from bonds into equities), this sector is likely to lead the breakout. Notably, Credit Suisse recently announced a move from neutral to overweight in equities given what it sees as improving prospects of a US-China trade détente, diminishing political risk in the UK and Europe, and dovish central banks. And according to FactSet, as of 10/10, the bottom-up year-end target price for the S&P 500 was 3,321. Moreover, Oppenheimer technical strategist Ari Wald said the S&P could reach 3,150-3,200 by the end of this year and 3,500-3,600 next year. All of those numbers sound plausible to me.
Some final thoughts:
Amazingly, some prominent personalities from the left have bluntly stated that they want to see the US plunge into recession just to ensure our “evil” president is not reelected. But the very idea of wishing recession, joblessness, and destitution upon so many citizens (i.e., collateral damage) just to achieve political ends is astonishing. Moreover, it seems that many politicians are willing if not eager to tear down our long-standing principles and institutions (including the Constitution, the Electoral College, capitalism, the Rule of Law, free speech, and liberty) that have made our country the strongest in the world and the beacon of hope for freedom-loving people around the world. Those are just relics of a bygone era, in need of modernizing, they say.
I wrote back on 7/4/2017 about President Trump’s proposed fiscal policies, including tax cuts, regulatory rollbacks, infrastructure spending, and entitlement reform (including overhauling our rapidly imploding healthcare system). But only the first two have been enacted, and any notion of spending cuts has been thrown out the window, even by Trump himself, as the welfare state expands inexorably. To be sure, scaling back on entitlements and fixing our dysfunctional healthcare system is no easy task. The siren song of entitlements always sounds so good but overpromising and overreaching always seem to find a way back to haunt us.
Keep in mind the observation attributed to Scottish judge and historian Alexander Tytler, circa 1800, regarding the Cycle of Democracy:
- “A democracy cannot exist as a permanent form of government. It can only exist until the voters discover they can vote themselves largess from the public treasury. From that moment on, the majority always votes for the candidates promising them the most benefits from the public treasury, with the result that a democracy always collapses over loose fiscal policy, always followed by a dictatorship.”
Also, Alexis de Tocqueville is credited with quite a number of insights, circa 1850, including such gems as:
- “The American Republic will endure until the day Congress discovers that it can bribe the public with the public's money.”
- “Democracy and socialism have nothing in common but one word: equality. But notice the difference: while democracy seeks equality in liberty, socialism seeks equality in restraint and servitude.”
Indeed, so many of the Democratic presidential candidates seem to be playing the “politics of aggrievement” by stoking envy and resentment, and many of our young people are eagerly lining up behind all the freebies they are promising, such as free college or student debt forgiveness, the Green New Deal, “Medicare for All,” a $15 minimum wage, illegal immigration amnesty, free education and healthcare for any foreigner who manages to cross the border, slavery reparations, bailing out all the unfunded public and private pension liabilities, etc. But as First Trust’s Brian Wesbury has opined, “The problem is that out of control spending gradually erodes the character of the American people. It pushes citizens toward dependence on government checks for their income, rather than their own efforts. In a democracy, we want our fellow citizens to know the value of hard work, shrewd investment, and entrepreneurship. Having too many people living off taxpayers is no way to conserve those traits.” Perhaps Michael Bloomberg ultimately will come swooping in like Mighty Mouse “to save the day” – and give moderates and conservatives a palatable alternative candidate.
An old college fraternity brother of mine is on the leadership team of the Joe Foss Institute, which seeks to put civics education for students back on an even keel with the other primary subjects. It’s such an important cause at this critical moment in history. Young people (and indeed, the candidates themselves) today seem ignorant of – or all too willing to abandon – the principles that made our country great in the first place, like freedom, individual rights, liberty, and the opportunity to pursue greatness and prosperity. I think it is at least partly due to them having grown up in the midst of the dot-com crash and the Financial Crisis, which may have made them lose faith in the system and the American Dream. But those principles are precisely why so many immigrants are so desperate to get to the US. I saw an episode of Shark Tank recently about a contestant who immigrated from Malaysia. Her parents had spent all their money sending her to the US and helping her through college, and she was now working a corporate job while pursuing her entrepreneurial dream with hope and vigor. Amazingly, such new immigrants embrace the American Dream while so many US-born citizens no longer do. Although Fed monetary policies and “crony capitalism” have indeed distorted opportunities in favor of the powerful and widened income inequality, the truth is that as long as the overall “pie” is expanding, there is more opportunity for prosperity for everyone – much more so than redistributing a static pie could ever provide. The “fix” to income inequality is not tighter regulation, wealth redistribution, socialism, or Chinese style “state capitalism,” but instead it is the removal of unnecessary barriers to a freer market within a system that honors liberty, intellectual property rights, and the rule of law – and generally leads us toward equal opportunity, but not equal outcomes.
Should we be worried about the economy or the future direction of our country? Well, I do not believe voters will allow socialism to take hold in this country, even if a socialist president is elected. And if he is impeached, I think there is virtually no chance President Trump will be convicted and removed from office by a 2/3 vote of a Republican-controlled Senate. And despite everything you hear in the financial news about an impending recession and the last vestiges of a 10-year bull market, I see no signs of the excesses that always presage a recession. In fact, our sluggish economy has yet to “run hot” at any time since the recovery began in 2009, and no economy dies of old age. Rather, with the fiscal stimulus and deregulation coupled with the “Fed Put” of dovish monetary policy, the only thing hindering the economy right now is the impact of uncertainty on business capital spending. At first, I thought that was due entirely to the China trade war, but increasingly I think both business and consumer sentiment are also being eroded by: 1) a fear that we may actually elect a socialist president and 2) the self-fulfilling prophecy (whether intentional or not) of an incessant drumbeat of impending recession. Luckily, those are things over which we as citizens have control.
SPY Chart Review:
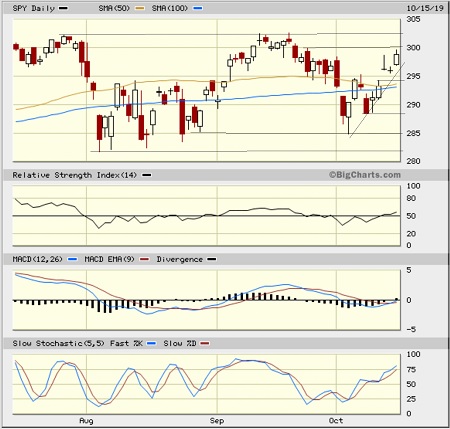
The SPDR S&P 500 ETF (SPY) closed Tuesday near 299 and once again touched the 300 level, as it continues churning along its sideways path, just waiting for the right conditions to breakout (or breakdown). The all-time high is just above at 302.63. The risk-on rally in the first half of September brought extreme overbought conditions that were alleviated during the early October pullback, and the past several days have filled some bullish gaps and firmed up the bullish technical picture. Oscillators RSI, MACD, and Slow Stochastics are all pointing upward. Support comes at the last gap at 294 and recent support near 288. I believe an upside breakout is in store, but it will need renewed leadership from those risk-on sectors and broad participation from small-mid caps to hold up.
Latest Sector Rankings:
Relative sector rankings are based on our proprietary SectorCast model, which builds a composite profile of each of nearly 500 equity ETFs based on bottom-up aggregate scoring of the constituent stocks. The Outlook Score employs a forward-looking, fundamentals-based multifactor algorithm considering forward valuation, historical and projected earnings growth, the dynamics of Wall Street analysts’ consensus earnings estimates and recent revisions (up or down), quality and sustainability of reported earnings, and various return ratios. It helps us predict relative performance over the next 2-6 months.
In addition, SectorCast computes a Bull Score and Bear Score for each ETF based on recent price behavior of the constituent stocks on particularly strong and weak market days. A high Bull score indicates that stocks within the ETF recently have tended toward relative outperformance when the market is strong, while a high Bear score indicates that stocks within the ETF have tended to hold up relatively well (i.e., safe havens) when the market is weak.
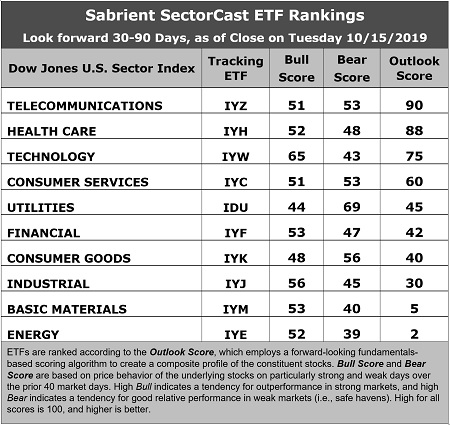
Outlook score is forward-looking while Bull and Bear are backward-looking. As a group, these three scores can be helpful for positioning a portfolio for a given set of anticipated market conditions. Of course, each ETF holds a unique portfolio of stocks and position weights, so the sectors represented will score differently depending upon which set of ETFs is used. We use the iShares that represent the ten major U.S. business sectors: Financial (IYF), Technology (IYW), Industrial (IYJ), Healthcare (IYH), Consumer Goods (IYK), Consumer Services (IYC), Energy (IYE), Basic Materials (IYM), Telecommunications (IYZ), and Utilities (IDU). Whereas the Select Sector SPDRs only contain stocks from the S&P 500 large cap index, I prefer the iShares for their larger universe and broader diversity.
Here are some of my observations on this week’s scores:
1. Not much change this month. Telecom remains in the top spot with an Outlook score of 90, primarily due to the lowest forward P/E (13.2x), and reasonably good sell-side analyst sentiment (revisions to EPS estimates), although it should be noted that all sectors across the board have seen net negative revisions. IYZ also displays reasonably good return ratios. (It is worth noting that the IYZ ETF is dominated by just two stocks: VZ and CSCO.) However, its pure GARP metrics are only average, with projected year-over-year EPS growth rate of 7.4% and a forward PEG ratio (forward P/E divided by projected EPS growth rate) of 1.79. Taking second once again is Healthcare with a score of 88, as it similarly displays among the best sell-side analyst sentiment and a low P/E (15.5x), as well as the lowest forward PEG ratio of 1.47. Rounding out the top six are Technology, Consumer Services (Discretionary/Cyclical), Utilities, and Financial.
2. At the bottom of the rankings we find the three most highly cyclical sectors: Energy, Basic Materials, and Industrial, primarily because these sectors have seen significant net reductions to their earnings estimates from the sell-side analyst community.
3. Looking at the Bull scores, Technology enjoys the top score of 65, followed by Industrial at 56, as stocks within these sectors have displayed relative strength on strong market days. Defensive sector Utilities scores the lowest at 44. The top-bottom spread is a healthy 21 points, which reflects low sector correlations on strong market days. It is desirable in a healthy market to see low correlations reflected in a top-bottom spread of at least 20 points, which indicates that investors have clear preferences in the market segments and stocks they want to hold (rather than broad risk-on behavior).
4. Looking at the Bear scores, as usual we find defensive sector Utilities alone in the top spot with a score of 69, followed by Consumer Goods at 56, which means that stocks within these sectors have been the preferred safe havens lately on weak market days. Energy has the lowest score of 39, followed by Materials at 40, as investors have fled during recent market weakness. The top-bottom spread is 29 points, which reflects very low sector correlations on weak market days. Ideally, certain sectors will hold up relatively well while others are selling off (rather than broad risk-off behavior), so it is desirable in a healthy market to see low correlations reflected in a top-bottom spread of at least 20 points.
5. Telecom displays the best all-around combination of Outlook/Bull/Bear scores, followed by Healthcare, while Energy is the worst. Looking at just the Bull/Bear combination, Utilities is the best, followed by Technology, indicating superior relative performance (on average) in extreme market conditions (whether bullish or bearish). Energy scores the worst.
6. I would say this week’s fundamentals-based Outlook rankings now reflect a neutral bias, given that the bottom of the rankings is populated by highly cyclical sectors Energy, Materials, and Industrial, but defensive sectors Utilities and Consumer Goods are stuck in the middle, while all-weather Telecom and Healthcare are at the top along with risk-on sectors Technology and Consumer Services – so no clear bias. Keep in mind, the Outlook Rank does not include timing, momentum, or relative strength factors, but rather reflects the consensus fundamental expectations at a given point in time for individual stocks, aggregated by sector.
ETF Trading Ideas:
Our Sector Rotation model, which appropriately weights Outlook, Bull, and Bear scores in accordance with the overall market’s prevailing trend (bullish, neutral, or defensive), retains a bullish bias and suggests holding Technology (IYW), Healthcare (IYH), and Telecom (IYZ) in that order. (Note: In this model, we consider the bias to be bullish from a rules-based trend-following standpoint when SPY is above both its 50-day and 200-day simple moving averages.)
Besides iShares’ IYW, IYH, and IYZ, other highly-ranked ETFs in our SectorCast model (which scores nearly 500 US-listed equity ETFs) from the Technology, Healthcare, and Telecom sectors include First Trust NASDAQ Technology Dividend (TDIV), iShares Evolved US Innovative Healthcare (IEIH), and Invesco S&P 500 Equal Weight Communications Services (EWCO).
If you prefer a neutral bias, the Sector Rotation model suggests holding Telecom, Healthcare, and Technology, in that order. On the other hand, if you are more comfortable with a defensive stance on the market, the model suggests holding Utilities, Telecom, and Healthcare, in that order.
An assortment of other interesting ETFs that are scoring well in our latest rankings include Amplify CrowdBureau Peer-to-Peer Lending & Crowdfunding (LEND), VanEck Vectors Pharmaceutical (PPH), iShares Nasdaq Biotechnology (IBB), Pacer US Small Cap Cash Cows 100 (CALF), Direxion Zacks MLP High Income (ZMLP), Aptus Fortified Value (FTVA), US Global Jets (JETS), Amplify EASI Tactical Growth (EASI), Arrow QVM Equity Factor (QVM), iShares Latin America 40 (ILF), Loncar Cancer Immunotherapy (CNCR), Invesco BRIC (EEB), and Invesco S&P SmallCap Consumer Discretionary (PSCD).
IMPORTANT NOTE: I post this information periodically as a free look inside some of our institutional research and as a source of some trading ideas for your own further investigation. It is not intended to be traded directly as a rules-based strategy in a real money portfolio. I am simply showing what a sector rotation model might suggest if a given portfolio was due for a rebalance, and I do not update the information on a regular schedule or on technical triggers. There are many ways for a client to trade such a strategy, including monthly or quarterly rebalancing, perhaps with interim adjustments to the bullish/neutral/defensive bias when warranted, but not necessarily on the days that I happen to post this article. The enhanced strategy seeks higher returns by employing individual stocks (or stock options) that are also highly ranked, but this introduces greater risks and volatility. I do not track performance of the ideas mentioned here as a managed portfolio.
Disclosure: At the time of this writing, the author held long positions on the SPY.
Disclaimer: This newsletter is published solely for informational purposes and is not to be construed as advice or a recommendation to specific individuals. Individuals should take into account their personal financial circumstances in acting on any opinions, commentary, rankings, or stock selections provided by Sabrient Systems or its wholly owned subsidiary Gradient Analytics. Sabrient makes no representations that the techniques used in its rankings or analysis will result in or guarantee profits in trading. Trading involves risk, including possible loss of principal and other losses, and past performance is no indication of future results.