Sector Detector: Could a Fed policy pivot come sooner than expected?
 by Scott Martindale
President & CEO, Sabrient Systems LLC
As expected, last week the FOMC left the fed funds rate as is at 5.25-5.50%. Fed funds futures suggest the odds of a hike at the December meeting have fallen to less than 10%, and the odds of at least three 25-bp rate cuts by the end of 2024 have risen to nearly 80%, with a 25% chance the first cut comes as soon as March. As a result, after moving rapidly to cash for the past few months, stock and bond investors came rushing back with a vengeance. But what really goosed the market were underwhelming economic reports leading to Fed Chair Jerome Powell’s comments suggesting the lag effects on surging interest rates and the strong US dollar are finally manifesting. Investors apparently believed the Fed’s promise of “higher for longer” (making the Fed’s job easier), which spiked Treasury yields (and by extension, mortgage rates) much faster and more severely than the Fed intended.
The S&P 500 had fallen well below all major moving averages, accelerating downward into correction territory, and was down 10% from its 7/31 high. Moreover, the S&P 500 Bullish Percent Index (BPSPX), which rarely drops below 25, had fallen to a highly oversold 23 (anything below 30 is considered oversold), and the CBOE Volatility Index (VIX) had surged above the 20 “panic threshold” to hit 23. Both were contrarian bullish signals. Then stocks began to recover ahead of the FOMC meeting, and after the less-than-hawkish policy announcement, it triggered short covering and an options-driven “gamma squeeze,” with the S&P 500 surging above its 200-day, 50-day, and 20-day moving averages (leaving only the 100-day still above as potential resistance), the BPSPX bullish percent closed the week at 43 (which is still well below the overbought level of 80 last hit on 7/31), and the VIX closed the week below 15.
The recovery rally was broad, and in five short days put the major indexes back to where they were two weeks ago. The best performers were those that sold off the most, essentially erasing the late-October swoon in any instant. As for Treasury yields, the week ended with the 2-year at 4.84% (after hitting 5.24% in mid-October) and the 10-year at 4.57% (after touching 5.0% in mid-October), putting the 2-10 inversion at -27 bps. The 30-year mortgage rate has fallen back below 7.50%. Recall that my “line in the sand” for stocks has been the 2-year staying below 5.0%, and indeed falling below that level last week correlated with the surge in equities.
Looking ahead, investors will be wondering whether last week’s huge relief rally is sustainable, i.e., the start of the much-anticipated Q4 rally. After all, it is well known that some of the most startling bull surges happen during bear markets. Regardless, stock prices are ultimately based on earnings and interest rates, and earnings look quite healthy while interest rates may have topped out, as sentiment indicators are flashing contrarian buy signals (from ultra-low levels). But much still hinges on the Fed, which is taking its cues from inflation and jobs reports. Last week’s FOMC statement suggests a lessening of its hawkishness, but what if the Fed has viewed our post-pandemic, return-to-normalcy, sticky-inflation economic situation—and the need for harsh monetary intervention—all wrong?
Much of the empirical data shows that inflation was already set to moderate without Fed intervention, given: 1) post-lockdown recovery in supply chains, rising labor force participation, and falling excess savings (e.g., the end to relief payments and student debt forbearance); and 2) stabilization/contraction in money supply growth. These dynamics alone inevitably lead to consumer belt-tightening and slower economic growth, not to mention the resumption in the disinflationary secular trends and the growing deflationary impulse from a struggling China.
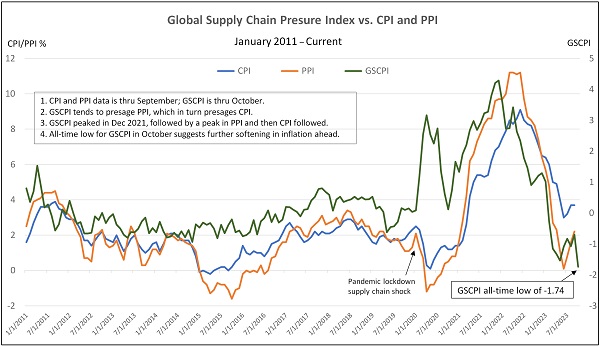
Notably, the New York Fed’s Global Supply Chain Pressure Index (GSCPI), which measures the number of standard deviations from the historical average value (aka Z-score) and generally presages movements in PPI (and by extension, CPI), was released earlier today for October, and it plummeted to -1.74, which is its lowest level ever. This bodes well for CPI/PPI readings next week and PCE at month end, with a likely resumption in their downtrends. So, although the Fed insists the economy and jobs are strong and resilient so it can focus on taming the scourge of inflation through “higher for longer” interest rates, I remain less concerned about inflation than whether the Fed will pivot quickly enough to avoid inducing an unnecessary recession.
Assuming the Fed follows through on its softer tone and real yields continue to fall (and we manage to avoid World War III), I think this latest rally has given investors renewed legs—likely after a profit-taking pullback from last week’s 5-day moonshot. With over 80% of the S&P 500 having reported, Q3 earnings are handily exceeding EPS expectations (3.7% YoY growth, according to FactSet, driven mostly by a robust profit margin of 12.1%), and optimistic forecasts for 2024-2025 earnings growth are holding up. Meanwhile, a renewed appetite for bonds promises to drive down interest rates.
I like the prospects for high-quality/low-debt technology companies, bonds and bond-proxies (e.g., utilities and consumer staples), oil and uranium stocks, gold miners, and bitcoin in this macro climate. Furthermore, we continue to believe that, rather than the broad-market, passive indexes that display high valuations, investors may be better served by active stock selection Sabrient’s portfolios include the new Q4 2023 Baker’s Dozen (launched on 10/20), Small Cap Growth 40 (just launched on 11/3), and Sabrient Dividend 45 (launched on 9/1, and today offers a 5.5% dividend yield).
In today’s post, I discuss the trend in supply chains and inflation, equity valuations, and Fed monetary policy implications. I also discuss Sabrient’s latest fundamentals based SectorCast quantitative rankings of the ten U.S. business sectors (which is topped by Technology and Industrials), current positioning of our sector rotation model (which is switching from neutral to a bullish bias, assuming support at the 50-day moving average holds for the S&P 500), and some actionable ETF trading ideas.
Click here to continue reading my full commentary … or if you prefer, here is a link to this post in printable PDF format (as some of my readers have requested).
Market commentary:
Powell suggested in his discussion that it was “historically unusual” to achieve “progress on inflation without seeing the kind of increase in unemployment” expected. In other words, he is referencing the Phillips Curve economic model, which has been largely debunked as a causal relationship (i.e., if you bring down inflation, unemployment goes up, and vice versa, like an old balance scale). Instead, the empirical data suggests instead that both are influenced by aggregate demand and productivity. But because the Fed’s dual mandate is to achieve maximum employment and price stability, it is assumed there is a direct tradeoff between them.
According to Mickey Levy, chief economist at Berenberg, “The Phillips Curve, which correctly posits that lower unemployment raises wages, incorrectly presumes that [higher] wages always lead to higher product prices without considering the impact of productivity on production costs, or how nominal aggregate demand influences businesses flexibility to raise product prices.” In other words, wage inflation does not cause price inflation. Likewise, in the view of acclaimed economist Ed Yardeni, “…strong economic growth isn't inflationary if it is driven by productivity growth. Fed officials have been trying to slow the economy down to subdue inflation. Our analysis suggests that they should allow productivity-led growth to flourish because it is the main driver of prosperity while also containing inflation. Productivity boosts real wages, profit margins, and keeps a lid on prices.” In other words, the Fed needed to stop jawboning interest rates higher and crushing the housing market.
Indeed, Austan Goolsbee, president of the Chicago Federal Reserve Bank, essentially has argued that the Fed’s high-profile intervention had little to do with the fall in inflation but may be following “a recipe for overshooting and causing an unnecessary downturn” in the economy. I agree that Fed manipulation of market rates has had less impact on inflation compared to the stagnant/falling money supply (down 4.4% from the July 2022 peak). And in fact, I think it’s time for Powell & Co. to being the process of gradually cutting the fed funds rate back toward the neutral rate (around 2.5-3.0% nominal, i.e., 2% target inflation plus 0.5-1.0% r-star), before it crushes the housing market and, by extension, the broader economy.
Needless to say, it remains a sore spot for me to consider how much influence this unelected body wields on our economy and personal investments. The US economy has been contending with: 1) the diminishing impact of the previous fiscal spending impulse, 2) the Fed continuing its QT liquidity drain and banks tightening credit conditions (less incentive to lend), and 3) the consumer becoming “tapped out” by slowing growth in jobs and wages, rising consumer debt, and falling personal savings rate. Nevertheless, the Fed has insisted our economy remains strong and resilient, and indeed Q3 real GDP growth of 4.9% (8.5% nominal) seems to support that view on its face—although the Atlanta Fed GDPNow forecasts Q4 GDP at just 1.2%, down significantly from its previous 2.3% forecast and the robust (and likely anomalous) Q3 GDP. So, Powell & Co. do not admit to a need to lower rates anytime soon, instead maintaining a singular focus on the scourge of inflation.
The Fed certainly has a lot of concerning developments to ponder. High interest rates are finally revealing their lag effects, and continued balance sheet reduction will likely keep bond prices under pressure. Despite heavy capex on new domestic (onshore) manufacturing facilities, the manufacturing indexes measuring activity continue to remain mired in contraction territory, except those areas enjoying government subsidies. Notably, the ISM New Orders Index has been in contraction for 14 consecutive months, the Dallas Fed’s Selling Prices and Selling Price Expectations Indexes in October showed big drops, and construction spending is down. Even the latest ISM Services Index came in light, although still above 50 (expansion). All suggest a return to disinflationary trends.
Meanwhile, jobs growth badly missed estimates (99k versus 158k expected), and wage inflation is slowing (to just 0.2% MoM from 0.3% in September). Although consumer spending remains solid, it’s largely due to falling personal savings rate (down to 3.4%) and a surge in household debt, credit card and auto loan delinquencies. Commercial loan demand has fallen to levels only seen at the tail end of recessions, just prior to a recovery. And yet, we have not been in an official recession…or have we? Maybe we have been amidst what economist Ed Yardeni has calls a “rolling recession” across segments of the economy that is now turning into a “rolling expansion.” Furthermore, as wages continue to rise (albeit at a slowing rate), household debt as a percentage of disposable personal income has leveled off at pre-pandemic levels, the household debt to GDP ratio continues to decline, and homeowners enjoy about $3.2 trillion in home equity (according to the Fed) in homes largely holding fixed-rate mortgages, which are favorable signs.
As I discussed in my 10/2 Sector Detector blog post, we must move past this pesky interest rate problem and its attendant impacts on the economy, debt carrying costs, and federal debt payments (nearly 2.5% of GDP on a balance sheet at 33% of GDP), as well as valuation multiples (e.g., P/E) and the equity risk premium. No doubt, the Fed’s “higher for longer” mantra, lack of Fed buying (due to QT), and the so-called “bond vigilantes” protesting the fiscal malfeasance of massive (and rising) deficit spending and new issuances of $80+ billion/month created a Treasury supply/demand imbalance that has pushed market rates to an overly restrictive level that has squeezed credit conditions and dampened economic activity (despite the robust Q3 GDP reading), as the lag effects accelerate. Perhaps this is why the Fed has been consistently selling fewer Treasuries than its June 2022 guidance, with its actual runoff falling well below its intended $60 billion/month. But then the latest Treasury Quarterly Refunding Process announcement showed less issuance and more demand than feared.
As for stocks, valuations are driven by earnings and interest rates, so assuming we indeed see a combination of rising earnings offset by elevated interest rates, valuation multiples (e.g., P/E ratio) will be constrained. Of course, the perfect situation for stocks would be rising earnings, falling interest rates, and multiple expansion. One can dream.
My “line in the sand” for equity valuations has been the 2-year Treasury yield remaining below the 5% handle, and it reached as high as 5.24%, pressuring stocks along with bond prices. The 10-year rose even faster to bump up against 5.0% (the highest in 15 years), which nearly flattened out the inverted yield curve. After a brief flight to the safety of Treasuries on news of the large-scale terrorist attack on Israel, bonds fell back into their downtrend, but then rallied with equities into and after the FOMC meeting on optimism about an end to rate hikes. Also, Bespoke Investment Group observed that speculator positioning just switched from net short to net long in S&P 500 futures contracts for the first time in 70 weeks, which was the longest weekly streak since the data began in the late 1990s.
Trends in inflation and supply chains:
As for inflation, because the Fed can do little about energy and food prices, which have relatively inelastic demand, it is best to focus on core inflation (excluding food & energy). In September, core CPI (excluding food and energy) was up 4.1% year-over-year (YoY), which was an improvement from August’s 4.3% print. While the focus tends to be on headline YoY numbers, I prefer to focus on current price trends using the month-over-month (MoM) readings rather than comparing to the price index 12 months ago. And because inflation can be volatile, computing a rolling 3-month annualized average smooths it out a bit. So, the chart below compares a variety of rolling 3-month annualized inflation metrics—including CPI, core CPI (ex-food & energy), and the Fed’s preferred core PCE (ex-food & energy)—along with the 10-year Treasury yield, starting in December 2017 through current. As shown, core inflation had been improving dramatically, showing a steep downtrend since the middle of last year. The September uptick looks like normal month-to-month volatility.
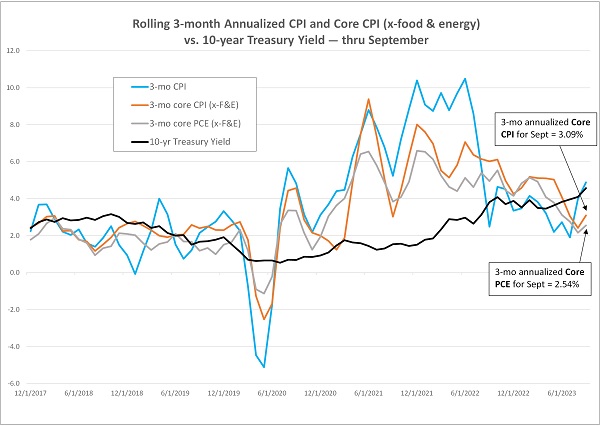
The 3-month annualized headline CPI fell to a post-pandemic-recovery low of 1.90% in July but has since resurged in August (3.98%) and September (4.88%), mainly due to a spike in gasoline prices in August (driven by a supply shortage of oil) followed by a surprising 7.2% YoY surge in shelter cost (which accounts for 40% of CPI) in September. But there is a long lag between the data used in CPI calculation and current shelter prices (which includes rent, owner’s equivalent rent, and hotel lodging), so actual inflation today is likely lower.
As for core CPI, while it did not uptick in August—instead, the 3-month annualized fell to a low of 2.41%—in September it jumped back up to 3.09%, reflecting at least a temporary reversal to its steep downtrend, primarily driven by that pesky shelter index, which accounted for over 70% of the total increase. And as for the Fed’s preferred core PCE, the 3-month annualized average in August was only 2.16%, and then September upticked to 2.54%. So, the core numbers are hovering just above the Fed’s 2% target, and based on the latest economic data, will likely fall further.
Importantly, today brought the October release of the New York Fed’s Global Supply Chain Pressure Index (GSCPI), which measures the number of standard deviations from the historical average value (aka Z-score) and generally presages movements in PPI ,and by extension, CPI. It plummeted from a December 2021 all-time high of +4.31 down to today’s October 2023 reading of -1.74—its lowest level ever, even lower than during the Financial Crisis. As shown in the chart below, GSCPI tends to presage PPI, which in turn tends to presage CPI. So, this bodes well for October CPI/PPI readings next week and PCE at month end, with a likely resumption in their downtrends.
Final thoughts:
To summarize, Treasury yields and core inflation have been trending in opposite directions (yields up, core inflation down) and creating a surge in real rates, with the 10-year real yield challenging its highest levels of the Financial Crisis. This has threatened our economy by burdening indebted corporations and households, excessively strengthening the dollar, and contributing to distress among our trading partners and emerging markets—including capital flight, destabilization, and economic migration. So, again, although the Fed insists the economy and jobs are strong and resilient so it can focus on taming the scourge of inflation through “higher for longer” interest rates, I remain less concerned about inflation than whether the Fed will pivot quickly enough to avoid inducing an unnecessary recession.
Regardless, with forward P/Es on the S&P 500 (SPY) at 18.4x and Nasdaq 100 (QQQ) at 23.3x versus the equal-weight S&P 500 (RSP) at 14.8x and the quality-oriented S&P 600 SmallCap (SPSM) at only 12.8x, outsized gains going forward for the Big Tech titans (including the “Magnificent Seven”) might be more difficult if it relies upon multiple expansion. So, rather than passive positions in the broad market indexes, investors may be better served by strategies that seek to exploit improving market breadth and performance/valuation dispersion among individual stocks to identify the under-the-radar and undervalued companies primed for explosive growth.
Indeed, many market commentators expect mean reversion in the large/small valuation divergence and suggest increased small cap exposure. To that end, the new Sabrient Small Cap Growth (SCG 40) portfolio provides an alpha-seeking alternative to the passive Russell 2000 index (IWM) for gaining such exposure. In addition, Q4 2023 Baker’s Dozen holds a small/mid-cap bias relative to the SPY benchmark (4/5/4 in large/mid/small cap holdings) and offers potential “rocket fuel” for outsized gains, and as dividend strategies gain traction again, the Sabrient Dividend 45 portfolio seems like a good bet as it seeks both capital appreciation and reliable income—offering a current yield of 5.5% (as of 11/3).
As a reminder, if you have an interest in our quant rankings, we have a new product called Sabrient SmartSheets—one for individual stocks and one for ETFs. They are posted weekly in Excel format and show how your stocks and ETFs score in our various alpha factors…or for identifying the top-ranked stocks and ETFs for each alpha factor (or for weighted combinations of the factors).

Latest Sector Rankings:
Relative sector rankings are based on our proprietary SectorCast model, which builds a composite profile of each of over 1,000 equity ETFs based on bottom-up aggregate scoring of the constituent stocks. The Outlook Score is a Growth at a Reasonable Price (GARP) model that employs a forward-looking, fundamentals-based multifactor algorithm considering forward valuation, historical and projected earnings growth, the dynamics of Wall Street analysts’ consensus earnings estimates and recent revisions (up or down), quality and sustainability of reported earnings, and various return ratios. It helps us predict relative performance over the next 3-6 months.
In addition, SectorCast computes a Bull Score and Bear Score for each ETF based on recent price behavior of the constituent stocks on particularly strong and weak market days. A high Bull score indicates that stocks within the ETF recently have tended toward relative outperformance when the market is strong, while a high Bear score indicates that stocks within the ETF have tended to hold up relatively well (i.e., safe havens) when the market is weak. Outlook score is forward-looking while Bull and Bear are backward-looking.
As a group, these three scores can be helpful for positioning a portfolio for a given set of anticipated market conditions. Of course, each ETF holds a unique portfolio of stocks and position weights, so the sectors represented will score differently depending upon which set of ETFs is used. We use the iShares that represent the ten major U.S. business sectors: Financials (IYF), Technology (IYW), Industrials (IYJ), Healthcare (IYH), Consumer Staples (IYK), Consumer Discretionary (IYC), Energy (IYE), Basic Materials (IYM), Telecommunications (IYZ), and Utilities (IDU). Whereas the Select Sector SPDRs only contain stocks from the S&P 500 large cap index, I prefer the iShares for their larger universe and broader diversity.
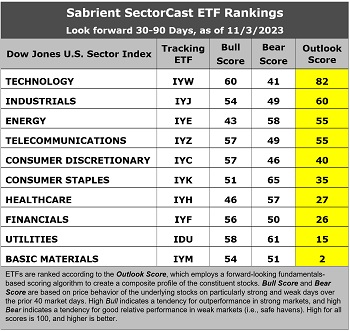
The latest fundamentals-based Outlook rankings continue to display a bullish bias given the dominance of economically sensitive and cyclical sectors at the top. Technology (IYW) takes the top spot with a robust Outlook Score of 82, followed by the Industrials sector (IYJ) at 60, Energy (IYE) at 55, and Telecom (IYZ) at 55, all of which are either cyclical or high-growth secular sectors. On the other hand, “deep cyclical” sectors Basic Materials and Financials continue to dwell in the bottom three, which is somewhat cautionary.
Also notable is that the cyclical Energy sector displays the lowest Bull scores and a high Bear score. Low Bull and high Bear score is usually reflective of a defensive sector, but in this case, I believe it reflects current investor sentiment about the impact of rising oil prices on a fragile economy, i.e., helpful to Energy stocks’ earnings outlook but negative for the broader market (like a quasi-tax and inflationary).
Strong EPS growth forecasts include IYC at 15.7%, IYW at 15.5%, and IYJ at 11.8%. Stocks composing top-scoring Telecom (IYZ) have received by far the largest net positive revisions to EPS estimates among sell-side analysts, at 13.2%, and while all the others have negative revisions, IYW and IYE are the least negative. IYE, IYZ, and Financials (IYF) also boast the lowest forward P/Es at around 11x.and the lowest forward PEGs (forward P/E divided by projected EPS growth rate) at 1.1-1.2.
Defensive sector Utilities and beleaguered Basic Materials (IYM) remain in the bottom two, with low EPS growth forecasts of around 7%. In fact, analysts continue to cut EPS expectations for stocks within IYM by an aggregate of -32%, which actually bodes well for lower producer prices in the other sectors. Keep in mind, the Outlook Rank does not include timing, momentum, or relative strength factors, but rather reflects the consensus fundamental expectations at a given point in time for individual stocks, aggregated by sector.
ETF Trading Ideas:
Our rules-based Sector Rotation model, which appropriately weights Outlook, Bull, and Bear scores in accordance with the overall market’s prevailing trend (bullish, neutral, or defensive), appears to be switching from neutral to a bullish bias, assuming SPY support holds at the 50-day moving average for a couple of days. If so, the model suggests holding Technology (IYW), Telecom (IYZ), and Consumer Discretionary (IYC), in that order. (Note: In this model, we consider the bias to be bullish from a rules-based trend-following standpoint when SPY is above both its 50-day and 200-day simple moving averages, but neutral if it is between those SMAs while searching for direction, and defensive if below both SMAs.)
If you prefer a neutral bias, the Sector Rotation model suggests holding Technology (IYW), Industrials (IYJ), and Energy (IYE), in that order. Or, if you prefer to maintain a defensive stance, the model suggests holding Consumer Staples (IYK), Energy (IYE), and Utilities (IDU), in that order.
An assortment of other interesting ETFs that are scoring well in our latest rankings include: Alpha Architect US Quantitative Momentum (QMOM), Cambria Cannabis (TOKE), Global X Social Media (SOCL), WealthTrust DBS Long Term Growth (WLTG), VanEck BDC Income (BIZD), Alger 35 (ATFV), Nuveen Growth Opportunities (NUGO), Fidelity Metaverse (FMET), SoFi Web 3 (TWEB), GraniteShares HIPS US High Income (HIPS), WBI BullBear Quality 3000 (WBIL), Pinnacle Focused Opportunities (FCUS), Virtus Private Credit Strategy (VPC), Invesco Building & Construction (PKB), Invesco Next Gen Media and Gaming (GGME), QRAFT AI-Enhanced US Large Cap Momentum (AMOM), Clockwise Core Equity & Innovation (TIME), First Trust International Equity Opportunities (FPXI), First Trust Multi-Manager Large Growth (MMLG), First Trust Natural Gas (FCG), Goldman Sachs Future Consumer Equity (GBUY), Pacer US Small Cap Cash Cows Growth Leaders (CAFG), ETFMG Prime Mobile Payments (IPAY), MUSQ Global Music Industry (MUSQ), Global X Clean Water (AQWA), and iShares Expanded Tech Sector (IGM). All score in the top decile (90-100) of Outlook scores.
As always, I welcome your thoughts on this article! Please email me anytime. Any and all feedback is appreciated! In particular, tell me what sections you find the most valuable—commentary, chart analysis, SectorCast scores, or ETF trading ideas / sector rotation model. Also, please let me know of your interest in a Sabrient index for TAMP or ETF investing…or in the new Sabrient SmartSheets to our full rankings of stocks and ETFs…or in having me speak at your event.
IMPORTANT NOTE: I post this information periodically as a free look inside some of our institutional research and as a source of some trading ideas for your own further investigation. It is not intended to be traded directly as a rules-based strategy in a real money portfolio. I am simply showing what a sector rotation model might suggest if a given portfolio was due for a rebalance, and I do not update the information on a regular schedule or on technical triggers. There are many ways for a client to trade such a strategy, including monthly or quarterly rebalancing, perhaps with interim adjustments to the bullish/neutral/defensive bias when warranted, but not necessarily on the days that I happen to post this article. The enhanced strategy seeks higher returns by employing individual stocks (or stock options) that are also highly ranked, but this introduces greater risks and volatility. I do not track performance of the ideas mentioned here as a managed portfolio.
Disclosure: At the time of this writing, of the securities mentioned, the author held options positions in SPY, QQQ, and IWM.
Disclaimer: Opinions expressed are the author’s alone and do not necessarily reflect the views of Sabrient. This newsletter is published solely for informational purposes and is not to be construed as advice or a recommendation to specific individuals. Individuals should take into account their personal financial circumstances in acting on any opinions, commentary, rankings, or stock selections provided by Sabrient Systems or its wholly owned subsidiary, Gradient Analytics. Sabrient makes no representations that the techniques used in its rankings or analysis will result in or guarantee profits in trading. Trading involves risk, including possible loss of principal and other losses, and past performance is no indication of future results.