Sector Detector: Falling core inflation, solid earnings, and favorable seasonality suggest upside for stocks
 by Scott Martindale
President & CEO, Sabrient Systems LLC
Federal shutdown averted, at least for another 6 weeks, which may give investors some optimism that cooler heads will prevail in the nasty tug-of-war between the budget hawks and the spendthrifts on the right and left flanks. Nevertheless, I think stocks still may endure some turmoil over the next few weeks before the historically bullish Q4 seasonality kicks in—because, yes, there are still plenty of tailwinds.
From a technical standpoint, at the depths of the September selloff, 85% of stocks were trading below their 50-day moving averages, which is quite rare, and extreme September weakness typically leads to a strong Q4 rally. And from a fundamental standpoint, corporate earnings expectations are looking good for the upcoming Q3 reporting season and beyond, as analysts are calling for earnings growth of 12.2% in 2024 versus 2023, according to FactSet. But that still leaves us with the interest rate problem—for the economy and federal debt, as well as valuation multiples (e.g., P/E) and the equity risk premium—given that my “line in the sand” for the 2-year Treasury yield at the 5% handle has been solidly breached.
But the good news is, we learned last week that the Fed’s preferred inflation metric, core PCE (ex-food & energy), showed its headline year-over-year (YoY) reading fall to 3.9% in August (from 4.3% in July). And more importantly in my view, it showed a month-over-month (MoM) reading of only 0.14%, which is a better indicator of the current trend in consumer prices (rather than comparing to prices 12 months ago), which annualizes to 1.75%—which of course is well below the Fed’s 2% inflation target. Even if we smooth the last 3 MoM reports for core PCE of 0.17% in June, 0.22% in July, and 0.14% in August, the rolling 3-month average annualizes to 2.16%. Either way, it stands in stark contrast to the upward reversal in CPI that previously sent the FOMC and stock and bond investors into a tizzy.
Notably, US home sales have retreated shelter costs have slowed, wage inflation is dropping, and China is unleashing a deflationary impulse by dumping consumer goods and parts on the global market in a fit of desperation to maintain some semblance of GDP growth while its critical real estate market teeters on the verge of implosion.
So, core inflation is in a downtrend while nominal interest rates are rising, which is rapidly driving up real rates, excessively strengthening the dollar, threatening our economy, and contributing to distress among our trading partners and emerging markets—including capital flight, destabilization, and economic migration. Also, First Trust is projecting interest on federal debt to hit 2.5% of GDP by year-end, up sharply from 1.85% last year (which was the highest since 2001 during a steep decline from its 1991 peak of 3.16%).
Therefore, I believe the Fed is going to have to lighten up soon on hawkish rate policy and stagnant/falling money supply. When the Fed decides it’s time to cut rates—both to head off escalating crises in banking and housing and to mitigate growing strains on highly leveraged businesses, consumers, and foreign countries (from an ultra-strong dollar and high interest rates when rolling maturing debt)—it would be expected to ignite a sustained rally in both stocks and bonds.
But even if the AI-leading, Big Tech titans can justify their elevated valuations with extraordinary growth—and according to The Market Ear, they trade at the largest discount to the median stock in the S&P 500 stock in over 6 years on a growth-adjusted basis—investors still may be better served by active strategies that exploit improving market breadth by seeking “under the radar” opportunities poised for explosive growth, rather than the broad passive indexes. So, we believe this is a good time to be invested in Sabrient’s portfolios—including the new Q3 2023 Baker’s Dozen (launched on 7/20), Forward Looking Value 11 (launched on 7/24), Small Cap Growth 39 (launched on 8/7), and Sabrient Dividend 45 (launched on 9/1 and today offers a 5.5% dividend yield).
In today’s post, I discuss inflation, stock-bond relative performance, equity valuations, and Fed monetary policy implications. I also discuss Sabrient’s latest fundamentals based SectorCast quantitative rankings of the ten U.S. business sectors (which continues to be topped by Technology and Energy), current positioning of our sector rotation model (neutral bias), and some actionable ETF trading ideas. Your feedback is always welcome!
Click here to continue reading my full commentary … or if you prefer, here is a link to this post in printable PDF format (as some of my readers have requested).
Market commentary:
I recently listened to the views of economist Andrew Lees of MacroStrategy (U.K.) in his interview with Oxbow Advisors. To summarize, he believes the Federal Reserve’s monetary policy is behind the curve, and after creating the combined CPI inflation and asset inflation we face today through monetary expansion, the economy is soon to be crushed into deflation by the Fed’s needlessly high interest rates and monetary contraction, combined with bad federal energy policy and a deflation impulse from China. He makes a compelling argument.
He also described the 3-month annualized CPI, because examining recent month-over-month (MoM) gives a better indication of current price trends rather than comparing relying upon the YoY price difference today versus the level 12 months ago. So, as shown below, I decided to chart a variety of rolling 3-month annualized inflation metrics, including CPI, core CPI (ex-food & energy), the Fed’s preferred core PCE (ex-food & energy), and the 10-year Treasury yield starting in December 2017.
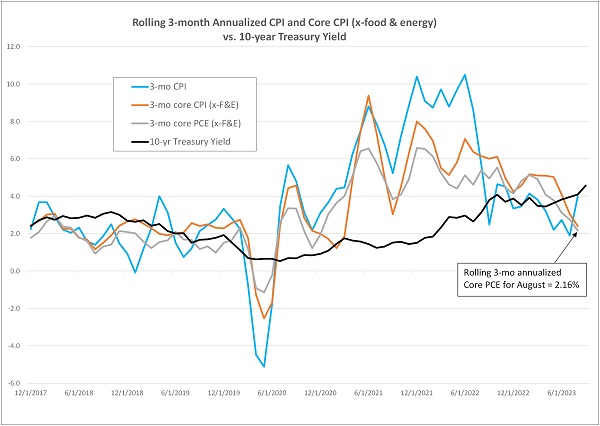
You can see that headline CPI showed a slight resurgence in August (to a 3-mo annualized 3.98%), mainly due to a spike in gasoline prices (driven by a supply shortage of oil), which has riled the FOMC as well as stock and bond markets. But 3-mo annualized core CPI is 2.41% and in a marked downtrend. Similarly, 3-month annualized core PCE is only 2.16% (based on the aforementioned reports of 0.17% in June, 0.22% in July, and 0.14% in August). So, if the Fed’s target is 2% based on core PCE inflation, it appears we are just about there—and suggests to me that no further rate hikes are necessary.
However, the 10-year yield (now at a 15-year high above 4.5%) and core CPI/PCE are heading in opposite directions (yields up, core inflation down), which suggests a surge in real rates for indebted corporations and households. So, as businesses face a falling nominal GDP growth rate, rising real rates, and much higher interest on debt rollovers (indeed, corporations are still borrowing at a robust pace), profit margins likely will be squeezed.
Moreover, the GDP Price Deflator (a measure of prices of all goods and services produced domestically including exports, as opposed to CPI which uses prices for a fixed basket of consumer goods and services including imports) has fallen to just 1.7%. And because PPI and CPI historically approximate each other (both averaging about 2.6% over the past 12 years) but CPI remains about 2.1% higher than PPI right now (3.7% vs. 1.6%), the likely direction ahead in my view will be mean reversion driven by a falling CPI. In addition, with weakness in Europe and a deflationary impulse from China due to its intractable economic issues, including dumping of parts and finished goods on the global market, we could be headed for a deflationary recession in the US—unless the Fed changes course from its hawkish policy.
As George Gilder recently wrote, “Rising rates will suppress production and supply. They may also put a lot of people out of work and drive a lot of businesses bust. And yes, when businesses and people are poor, they won’t be able to buy things and prices may come down. But trying to solve a supply crisis [of oil and all things that depend upon it] by collapsing production and impoverishing the people is as foolish as it is wicked.” Certainly, previous monetary and fiscal interventions can take some blame for today’s elevated inflation (when demand was supported while supply chains were disrupted), the wealth gap, workers’ strikes, and the economic migration crisis.
As I have written frequently in the past, the Fed is constrained in continuing to raise rates by the unintended impacts (and “lag effects”) outside of its focus on US inflation and unemployment—particularly as real rates rise. These include the critical banking sector and housing market, as well as emerging markets and our primary international trading partners. But it’s not the height of interest rates that matters as much as how long they stay high. The lag effects—once they arrive in earnest—may be onerous…and perhaps difficult to recover from. As Powell said in his Jackson Hole speech, the Fed’s job is “complicated by uncertainty about the duration of the lags with which monetary tightening affects economic activity and especially inflation.” Notably, Alpine Macro has observed in a new publication that “unrealized loss in the banking system is getting bigger every day as bond yields move higher, suggesting that a large number of US lending institutions are already technically bankrupt.” No wonder our SectorCast rankings show the Financial sector near the bottom (as discussed below).
So, how does this impact stocks? I have considered the 2-year Treasury yield of 5% to be a critical “line in the sand,” so to speak, for stocks because it reflects a broad expectation of inflation and the duration of the Fed’s “higher for longer” policy, which negatively impacts the equity risk premium and valuation multiples (on a DCF basis). After trying three other times this year (in March, July, August) to breach the 5% mark in a sustained way, it finally did so in September, reaching as high as 5.15% before closing the month at 5.05%. Accordingly, stocks struggled and became deeply oversold from a technical standpoint during the final week of September. Although due for a bounce, there may be even more downside in store for stocks as we enter Q4, despite the favorable seasonality.
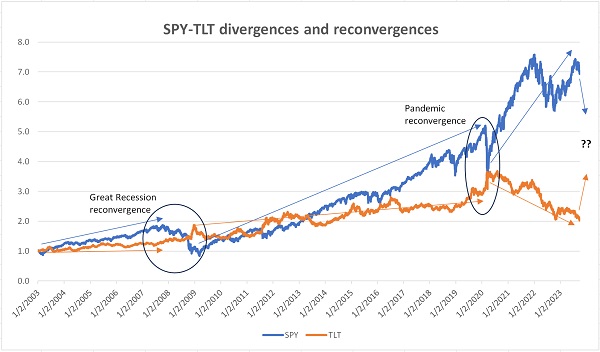
Furthermore, focusing on longer-term yields, the chart below compares the 20-year return histories of the iShares 20+ year Treasury Bond ETF (TLT) and the SPDR S&P 500 (SPY). They tend to gradually diverge during equity bull markets, and then converge when something bad happens to induce a flight to safety—such as the Great Recession and pandemic lockdowns shown. You can see that they have diverged to historic levels over the past few years (since the recovery from the pandemic selloff commenced), with stocks surging and bonds cratering. This suggests mean reversion eventually will push bonds higher and/or stocks lower.
I believe its misguided policy of “higher for longer” rates and shrinking money supply are unnecessarily boxing the FOMC—and our economy—into a corner. Although rising velocity of money stock over the past 2 years (after many years of decline) has helped to offset the fall in money supply, economist Andrew Lees believes that velocity might be expected to retreat again as debt rises and capital continues to be consumed by rising (and often unproductive) government spending on pet projects and debt service. Indeed, total interest payments on government debt are now the highest since 1995, and may keep rising as new debt is issued...unless rates come down sharply.
Nevertheless, we still might have to wait for the September CPI report next week before the Fed is ready pronounce its war on inflation done, leading to a policy pivot that would be expected to spark a market rally across risk assets. Hopefully, they will do it soon, before much more damage is done.
The chart below shows YTD performances of various segments of the equities market, as well as the improving market breadth since June 1. It compares the cap-weighted and equal-weight Nasdaq 100 (QQQ and QQQE) with the cap-weight and equal-weight S&P 500 (SPY and RSP) and the Russell 2000 small caps (IWM), S&P 500 High Dividend (SPYD), and iShares 20+ Year Treasury (TLT).
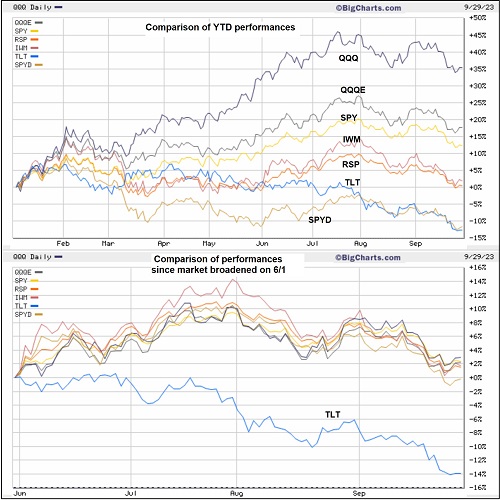
From the beginning of the year through June 1, the gap between cap-weighted QQQ over equal-weight QQQE, and SPY over RSP illustrates the investor preference for the mega-cap Tech juggernauts (aka “Magnificent Seven”) … and no love at all for the higher dividend payers. But the market became much more egalitarian starting on 6/1, with greater breadth as investors showed some love for promising “under the radar” names, smaller caps, and the higher dividend payers. However, the Treasury market (represented by TLT) has been a dumpster fire, falling 14% as of 9/29—mainly due to the Fed’s “higher for longer” mantra as well as lesser foreign purchases to better support their own currencies, and “bond vigilantes” protesting (by withholding their purchases) new issuances for deficit spending.
Regarding the low equity risk premium and elevated valuations in the major indexes (even after the market pullback over the past two months), my observation is that they are primarily driven by a handful of mega-cap Tech names. Minus those stocks, valuations across the broader market are much more reasonable. For example, the forward P/E for the cap-weight SPY (dominated by the “Magnificent Seven”) is 18.5x (as of 9/29), but equal-weight RSP is only 14.8x and small cap IWM is 13.9x.
So, looking at the market Equity Risk Premium (ERP), one way to calculate it is to add earnings yield (EY) plus dividend yield (DY) to get total expected return and compare it to the risk-free 10-yr Treasury yield. Using the inverse of its forward P/E, EY for SPY is 5.4% plus a DY of 1.4%, which totals 6.8%. Subtracting the 10-yr yield of 4.5% implies an ERP of 2.3%, which is low. But if we instead use the forward EY of equal-weight RSP of 6.7% plus its average DY of 1.7%, it totals 8.4% and implies an ERP of 3.9%—which is much more appealing. And for IWM, it has earnings yield of 7.2% plus dividend yield of 1.5%, totaling 8.7% and implying a 4.2% small cap ERP. Perhaps stock valuations in general—outside of the Big Tech juggernauts—may not be so bad after all.
Of course, the higher-valuation Big Tech companies might be able to justify their current valuations given their wide moats, huge cash balances, and market position as leaders in cutting-edge generative AI applications, intelligent software, and the promise to help virtually any company leverage these disruptive/transformational technologies for improved products, greater productivity and efficiency, and reduced costs, while driving a huge demand surge for data centers, cloud networking, and enterprise software systems. In other words, the hype today is not at all like the “pie in the sky,” “wish upon a star” stuff like we saw during the Internet bubble, which was also driven by a huge capex surge in preparation for the big nothing-burger Y2K scare, and then dried up. Today’s capex surge is just getting started.
Nevertheless, outsized gains going forward for the titans might be more difficult. So, rather than passive positions in the broad market indexes, investors may be better served by strategies that seek to exploit improving market breadth and performance dispersion among individual stocks to identify the under-the-radar and undervalued companies primed for explosive growth.
Indeed, many market commentators expect mean reversion in the large/small valuation divergence and suggest increased small cap exposure. To that end, the new Sabrient Small Cap Growth (SCG 39) portfolio provides an alpha-seeking alternative to the passive Russell 2000 index for gaining such exposure. In addition, Q3 2023 Baker’s Dozen holds a small/mid=cap bias relative to the SPY benchmark (5/4/4 in large/mid/small holdings) and offers potential “rocket fuel” for outsized gains, the annual Forward Looking Value (FLV 11) portfolio is a more diversified (34 positions) version of the Baker’s Dozen but with a slightly greater value bias, and as dividend strategies gain traction again, the Sabrient Dividend 45 portfolio seems like a good bet as it seeks both capital appreciation and reliable income—offering a current yield of 5.5% (as of 9/29).
As a reminder, if you have an interest in our quant rankings, we have a new product called Sabrient SmartSheets—one for individual stocks and one for ETFs. They are posted weekly in Excel format and show how your stocks and ETFs score in our various alpha factors…or for identifying the top-ranked stocks and ETFs for each alpha factor (or for weighted combinations of the factors).
Latest Sector Rankings:
Relative sector rankings are based on our proprietary SectorCast model, which builds a composite profile of each of over 1,000 equity ETFs based on bottom-up aggregate scoring of the constituent stocks. The Outlook Score is a Growth at a Reasonable Price (GARP) model that employs a forward-looking, fundamentals-based multifactor algorithm considering forward valuation, historical and projected earnings growth, the dynamics of Wall Street analysts’ consensus earnings estimates and recent revisions (up or down), quality and sustainability of reported earnings, and various return ratios. It helps us predict relative performance over the next 3-6 months.
In addition, SectorCast computes a Bull Score and Bear Score for each ETF based on recent price behavior of the constituent stocks on particularly strong and weak market days. A high Bull score indicates that stocks within the ETF recently have tended toward relative outperformance when the market is strong, while a high Bear score indicates that stocks within the ETF have tended to hold up relatively well (i.e., safe havens) when the market is weak. Outlook score is forward-looking while Bull and Bear are backward-looking.
As a group, these three scores can be helpful for positioning a portfolio for a given set of anticipated market conditions. Of course, each ETF holds a unique portfolio of stocks and position weights, so the sectors represented will score differently depending upon which set of ETFs is used. We use the iShares that represent the ten major U.S. business sectors: Financials (IYF), Technology (IYW), Industrials (IYJ), Healthcare (IYH), Consumer Staples (IYK), Consumer Discretionary (IYC), Energy (IYE), Basic Materials (IYM), Telecommunications (IYZ), and Utilities (IDU). Whereas the Select Sector SPDRs only contain stocks from the S&P 500 large cap index, I prefer the iShares for their larger universe and broader diversity.
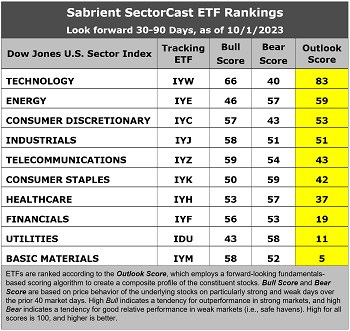
The latest fundamentals-based Outlook rankings continue to display a bullish bias given the dominance of economically sensitive and cyclical sectors at the top. Technology (IYW) takes the top spot with a robust Outlook Score of 83, followed by the Energy sector (IYE) at 59, Consumer Discretionary (IYC) at 53, and Industrials (IYJ) at 51, all of which are either cyclical or high-growth secular sectors. On the other hand, “deep cyclical” sectors Basic Materials and Financials continue to dwell in the bottom three, which is somewhat cautionary.
Also notable is that the cyclical Energy sector displays one of lowest Bull scores and a high Bear score. A high Bear score is usually reflective of a defensive sector, but in this case, I believe it reflects current investor sentiment about the impact of rising oil prices on a fragile economy, i.e., helpful to Energy stocks’ earnings outlook but negative for the broader market (a quasi-tax and inflationary).
Strong EPS growth forecasts include IYC at 18.4%, IYW at 15.4%, and IYJ at 12.0%. Stocks composing top-scoring IYW and IYE have received by far the largest net positive revisions to EPS estimates among sell-side analysts, at 13.3% and 11.1%, respectively, and IYE also boasts one of the lowest forward P/Es at 11.9x. IYC displays the lowest forward PEG (forward P/E divided by projected EPS growth rate) at 1.11. Honors for the lowest combination of P/E and PEG go to Telecom (IYZ), at 10.9x and 1.11.
Defensive sector Utilities and beleaguered Basic Materials (IYM) remain in the bottom two. In fact, analysts continue to cut EPS forecasts for stocks within IYM by an aggregate of -5.3%, which actually bodes well for lower producer prices in the other sectors. Keep in mind, the Outlook Rank does not include timing, momentum, or relative strength factors, but rather reflects the consensus fundamental expectations at a given point in time for individual stocks, aggregated by sector.
As a reminder, if you have an interest in our quant rankings, we have a new product called Sabrient SmartSheets—one for individual stocks and one for ETFs. They are posted weekly in Excel format and show how your stocks and ETFs score in our various alpha factors…or for identifying the top-ranked stocks and ETFs for each alpha factor (or for weighted combinations of the factors).
ETF Trading Ideas:
Our rules-based Sector Rotation model, which appropriately weights Outlook, Bull, and Bear scores in accordance with the overall market’s prevailing trend (bullish, neutral, or defensive), changed to a neutral bias in early September when SPY crashed back down through its 50-day simple moving average, much like it did during the August market turmoil. It suggests holding Technology (IYW), Energy (IYE), and Consumer Discretionary (IYC), in that order. (Note: In this model, we consider the bias to be neutral from a rules-based trend-following standpoint when SPY is between its 50-day and 200-day simple moving averages, searching for direction.)
If you prefer a bullish bias as we enter seasonally bullish Q4, the Sector Rotation model suggests holding Technology, Industrials (IYJ), and Consumer Discretionary, in that order. Or, if you prefer to maintain a defensive stance, the model suggests holding Energy, Consumer Staples (IYK), and Healthcare (IYH), in that order.
An assortment of other interesting ETFs that are scoring well in our latest rankings include: Valkyrie Bitcoin Miners (WGMI), Alger 35 (ATFV), Global X Metaverse (VR), Invesco Large Cap Growth (PWB), KraneShares CSI China Internet (KWEB), QRAFT AI-Enhanced US Large Cap Momentum (AMOM), ProShares Nasdaq-100 Dorsey Wright Momentum (QQQA), Putnam BDC Income (PBDC), Invesco Building & Construction (PKB), Nuveen Growth Opportunities (NUGO), Alpha Architect US Quantitative Momentum (QMOM), EMQQ Emerging Markets Internet & Ecommerce (EMQQ), ETC 6 Meridian Quality Growth (SXQG), WealthTrust DBS Long Term Growth (WLTG), Invesco S&P SmallCap Energy (PSCE), First Trust Expanded Technology (XPND), Pinnacle Focused Opportunities (FCUS), ProShares Global Listed Private Equity (PEX), First Trust Natural Gas (FCG), and Alpha Dog (RUFF). All score in the top decile (90-100) of Outlook scores.
As always, I welcome your thoughts on this article! Please email me anytime. Any and all feedback is appreciated! In particular, tell me what sections you find the most valuable—commentary, chart analysis, SectorCast scores, or ETF trading ideas / sector rotation model. Also, please let me know of your interest in a Sabrient index for TAMP or ETF investing…or in the new Sabrient SmartSheets to our full rankings of stocks and ETFs…or in having me speak at your event.
IMPORTANT NOTE: I post this information periodically as a free look inside some of our institutional research and as a source of some trading ideas for your own further investigation. It is not intended to be traded directly as a rules-based strategy in a real money portfolio. I am simply showing what a sector rotation model might suggest if a given portfolio was due for a rebalance, and I do not update the information on a regular schedule or on technical triggers. There are many ways for a client to trade such a strategy, including monthly or quarterly rebalancing, perhaps with interim adjustments to the bullish/neutral/defensive bias when warranted, but not necessarily on the days that I happen to post this article. The enhanced strategy seeks higher returns by employing individual stocks (or stock options) that are also highly ranked, but this introduces greater risks and volatility. I do not track performance of the ideas mentioned here as a managed portfolio.
Disclosure: At the time of this writing, of the securities mentioned, the author held positions in QQQ, TLT, IWM, and PSCE.
Disclaimer: Opinions expressed are the author’s alone and do not necessarily reflect the views of Sabrient. This newsletter is published solely for informational purposes and is not to be construed as advice or a recommendation to specific individuals. Individuals should take into account their personal financial circumstances in acting on any opinions, commentary, rankings, or stock selections provided by Sabrient Systems or its wholly owned subsidiary, Gradient Analytics. Sabrient makes no representations that the techniques used in its rankings or analysis will result in or guarantee profits in trading. Trading involves risk, including possible loss of principal and other losses, and past performance is no indication of future results.