Sector Detector: Valuation divergence suggests rotation to small-mid caps, value, and dividend payers
 by Scott Martindale
President & CEO, Sabrient Systems LLC
Stocks continued their impressive 2023 rally through July, buoyed by rapidly falling inflation, steady GDP and earnings growth, improving consumer and investor sentiment, and a fear of missing out (FOMO). Of course, the big story this year has been the frenzy around the promise of artificial intelligence (AI) and leadership from the “Magnificent Seven” Tech-oriented mega caps—Apple (AAPL), Amazon (AMZN), Alphabet (GOOGL), NVIDIA (NVDA), Meta (META), Tesla (TSLA), and Microsoft (MSFT), which have led the powerhouse Nasdaq 100 (QQQ) to a +44.5% YTD return (as of 7/31) and within 5% of its all-time closing high of $404 from 11/19/2021. Such as been the outperformance of these 7 stocks that Nasdaq chose to perform a special re-balancing to bring down their combined weighting in the Nasdaq 100 index from 55% to 43%!
Because the Tech-heavy Nasdaq badly underperformed during 2022, mostly due to the long-duration nature of aggressive growth stocks in the face of a rising interest rate environment, it was natural that it would lead the rally, particularly given: 1) falling inflation and an expected Fed pause/pivot on rate hikes, 2) resilience in the US economy, corporate profit margins (largely due to cost discipline), and the earnings outlook; 3) the exciting promise of disruptive/transformational technologies like regenerative artificial intelligence (AI), blockchain and distributed ledger technologies (DLTs), and quantum computing.
But narrow leadership isn’t healthy—in fact, it reflects defensive sentiment, as investors prefer to stick with the juggernauts rather than the vast sea of economically sensitive companies. However, since June 1, there have been clear signs of improving market breadth, with the iShares Russell 2000 small caps (IWM), S&P 400 mid-caps (MDY), and S&P 500 Equal Weight (RSP) all outperforming the QQQ and S&P 500 (SPY). Industrial commodities oil, silver, and copper prices rose in July. This all bodes well for market health through the second half of the year (and perhaps beyond), as I discuss in today’s post below.
But for the moment, an overbought stock market is taking a breather to consolidate gains, take some profits, and pull back. The Fitch downgrade of US debt is helping fuel the selloff. I view it as a welcome buying opportunity.
Although rates remain elevated, they haven’t reached crippling levels (yet), and although M2 money supply has topped out and fallen a bit, the decline has been offset by a surge in the velocity of money supply, as I discuss in today’s post. So, assuming the Fed is done raising rates—and I for one believe the fed funds rate is already beyond the neutral rate (and thus contractionary)—and as long as the 2-year Treasury yield remains below 5% (it’s around 4.9% today), I think the economy and stocks will be fine, and the extreme yield inversion will begin to reverse.
The Fed’s dilemma is to facilitate the continued process of disinflation without inducing deflation, which is recessionary. Looking ahead, Nick Colas at DataTrek recently highlighted the disconnect between fed funds futures (which are pricing in 1.0-1.5% in rate cuts early next year) and US Treasuries (which do not suggest imminent rate cuts). He believes, “Treasuries have it right, and that’s actually bullish for stocks” (bullish because rate cuts only become necessary when the economy falters).
So, today we see inflation has fallen precipitously as supply chains improve (manufacturing, transport, logistics, energy, labor), profit margins are beating expectations (largely driven by cost discipline), corporate earnings have been resilient, earnings forecasts are seeing upward revisions, capex and particularly construction spending on manufacturing facilities has been surging, hiring remains robust (almost 2 job openings for every willing worker), the yield curve inversion is trying to flatten, gold and high yield spreads have been falling since May 1 (due to recession risk receding, the dollar firming, and real yields rising), risk appetite (“animal spirits”) is rising, and stock market leadership is broadening. It all sounds promising to me.
Regardless, the passive broad-market mega-cap-dominated indexes that were so hard for active managers to beat in the past may well face tough constraints on performance, particularly in the face of elevated valuations (i.e., already “priced for perfection”), slow real GDP growth, and an ultra-low equity risk premium. Thus, investors may be better served by strategic-beta and active strategies that can exploit the performance dispersion among individual stocks, which should be favorable for Sabrient’s portfolios including Baker’s Dozen, Forward Looking Value, Small Cap Growth, and Dividend.
As a reminder, Sabrient’s enhanced Growth at a Reasonable Price (GARP) “quantamental” selection process strives to create all-weather growth portfolios, with diversified exposure to value, quality, and growth factors, while providing exposure to both longer-term secular growth trends and shorter-term cyclical growth and value-based opportunities—with the potential for significant outperformance versus market benchmarks. Indeed, the Q2 2022 Baker’s Dozen that recently terminated on 7/20 handily beat the benchmark S&P 500, +28.3% versus +3.8% gross total returns. In addition, each of our other next-to-terminate portfolios are also outperforming their relevant market benchmarks (as of 7/31), including Small Cap Growth 34 (16.9% vs. 9.9% for IWM), Dividend 37 (24.0% vs. 8.5% for SPYD), Forward Looking Value 10 (38.9% vs. 20.8% for SPY), and Q3 2022 Baker’s Dozen (28.4% vs. 17.9% for SPY).
Also, please check out Sabrient’s simple new stock and ETF screening/scoring tools called SmartSheets, which are available for free download for a limited time. SmartSheets comprise two simple downloadable spreadsheets—one displays 9 of our proprietary quant scores for stocks, and the other displays 3 of our proprietary scores for ETFs. Each is posted weekly with the latest scores. For example, Lantheus Holdings (LNTH) was ranked our #1 GARP stock at the beginning of February. Accenture (ACN) was at the top for March, Kinsdale Capital (KNSL) in April, Crowdstrike (CRWD) in May, and at the start of both June and July, it was discount retailer TJX Companies (TJX). Each of these stocks surged higher (and outperformed the S&P 500)—over the ensuing weeks after being ranked on top. We invite you to download the latest weekly sheets for stocks and ETFs using the link above—it’s free of charge for now. And please send me your feedback!
Here is a link to my full post in printable format. In this periodic update, I provide a comprehensive market commentary, including discussion of inflation, money supply, and why the Fed should be done raising rates; as well as stock valuations and opportunities going forward. I also review Sabrient’s latest fundamentals based SectorCast quant rankings of the ten U.S. business sectors and serve up some actionable ETF trading ideas. Read on…
Market commentary:
Keeping the bull run alive has been the markedly bullish turn in consumer and investor sentiment as recession fears abate. The AAIA survey jumped 10.4 percentage points to 51.4% on 7/19, which is unusually high, and this week came in aat 49.0% marking the 9th consecutive week that bullish sentiment is above its historical average of 37.5%. The Conference Board’s Consumer Confidence survey turned positive in June for the first time since January of 2022 (17 straight negatives months!), with a reading of 110.1, and then surged even further in July to 117.0. In addition, the CBOE Volatility Index (VIX) has remained well below 20 since late March, which suggests investor calm and complacency.
So, arguably, the proverbial “Wall of Worry” investors have been climbing has shrunk as inflation has continued to fall without a rise in unemployment while GDP growth has improved rather than fall into recession (as many have feared)—i.e., the “Goldilocks scenario.”
It is interesting to note that past bull markets have tended to be driven by one primary disruptive/transformational technology, led by a handful of powerhouse stocks at the forefront of that technology. For example, the 1980’s Tech boom was led by the personal computer, the 1990’s were driven by the Internet, the 2000’s were led by the smartphone, and the 2010’s were about application software and the cloud. Here in the 2020’s, it appears that AI, DLT, and quantum computing have emerged as the key drivers of digital transformation—and lifechanging in many ways.
But these technologies consume massive amounts of energy, which conflicts with the urgent push for climate-friendly, net-zero sources of green energy, which are still quite expensive and unreliable compared to fossil fuels. By far, the most efficient, practical, and scalable long-term energy solution is nuclear fusion (the same perpetual energy generation process of the Sun), and both the US and China are aggressively developing technologies to make this perpetual energy source a reality, with the promise of no emissions, radioactive waste, or risk of disaster (like nuclear fission). You might recall several months ago when our Lawrence Livermore National Laboratory in California announced the first-ever (albeit brief) fusion reaction, after decades of failures. Perhaps nuclear fusion will become the disruptive/transformational technology of the 2030’s.
Inflation and Fed policy:
Of course, the big story continues to be the path of inflation and the Fed’s reaction to it in the form of monetary policy, specifically interest rates and money supply. CPI continues its rapid decline, falling from 4.9% YoY in April, to 4.0% in May, and now 3.0% in June (similarly, June PCE came in at 3.0%). PPI dropped even more, plunging from 2.3% YoY in April, to 1.1% in May, and now 0.1% (essentially flat) in June. Many commentators believe PPI will go negative in July (aided by deflation in China). And notably, Industrial Production registered a -0.5% decline, and ISM Manufacturing has been in contraction for 8 straight months.
Importantly, housing rents are showing signs of weakening while the jobs market remains strong. Nearly half of CPI is housing, and as John Rutledge, chief investment strategist at Safanad, opined back in June, "Forget Powell's tough talk at last week's FOMC press conference. Interest rates are heading down from here. Excluding homeowners' ‘imaginary shelter cost’ (Owners' Equivalent Rent, or OER), the May CPI report shows inflation of -0.1% between April and May, and 2.6% over the previous 12 months."
Keep in mind, PPI is a leading economic indicator, while CPI is a lagging economic indicator. As such, price movements measured by PPI do not show immediate impacts on the economy, while price changes observed in the CPI are already manifest in the economy. Helping to keep PPI in check, the New York Fed’s Global Supply Chain Pressure Index (GSCPI), which measures the number of standard deviations from the historical average value (aka Z-score), has fallen from a December 2021 high of +4.31 to the May 2023 reading of -1.56 before ticking up a bit in June to -1.20. In other words, supply chain pressures have crashed to historic lows, mostly due to softer consumer goods demand, an easing of parts shortages, and less shipping congestion (and lower freight rates).
The chart below compares trends in CPI and PPI versus GSCPI, M2 money supply, and the S&P 500 (SPY) since 2011. The peaks and troughs in inflation tend to follow those in GSCPI with a slight lag. CPI and GSCPI both surged when M2SL surged and COVID lockdowns were instituted, and both have fallen precipitously as M2SL has crested. You can also see that GSCPI and SPY both peaked in Dec 2021, followed by M2SL and CPI a few months later. SPY then bottomed in October 2022 and has been rising on growing optimism about falling inflation and a Fed pause/pivot.
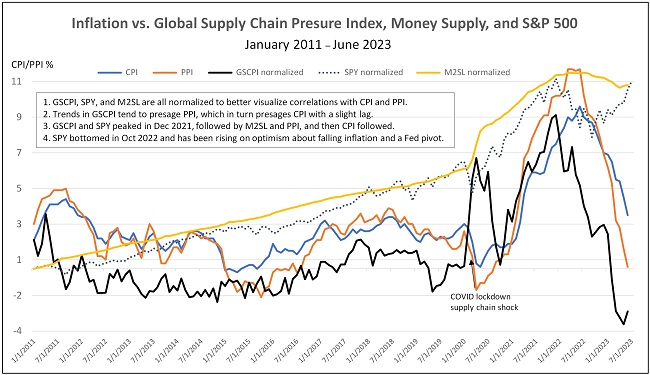
Recall that the Fed created a 40% pandemic-response surge in money supply in 2020-21. The chart shows that GSCPI and SPY both peaked in Dec 2021, followed by M2SL and CPI a few months later. M2SL crested during the 5-month March-July 2022 timeframe to $21.7 trillion and then retreated by about 5% to $20.6 trillion in April, as the Fed let maturing Treasuries roll off the balance sheet without replacement. However, the May and June readings have shown slight upticks in M2SL to nearly $20.9 trillion.
Notably, the average monthly annualized CPI and PPI readings over the period 2011-to-current are equal at 2.6%. CPI and PPI have both fallen from their peaks in June 2022 of 9.1% and 11.2%, respectively, to 3.0% and 0.1% (essentially zero) in June 2023. So, assuming both indexes eventually equalize again (i.e., mean reversion), it suggests CPI will continue to fall over the next few months while PPI stabilizes and consumer goods demand remains soft—and so it seems that the Fed should be done raising rates.
I have been opining for several months that it has already gone beyond the neutral rate. But I don’t believe the Fed needs to cut rates unless the economy falters and corporate earnings contract. And in my view, that depends upon two things: 1) how companies and individuals manage their maturing lower-rate debt (e.g., pay down or roll into higher-rate debt) and 2) how the global economy holds up as our trading partners cope with their own inflation, interest rates, liquidity needs, and currency exchange rates. For example, FactSet reported this week that during the current earnings reporting season, companies that generate more than 50% of sales outside the US are showing a blended EPS decline of -21%. Indeed, Europe and China are both struggling with recessionary forces, but Europe is facing the specter of stagflation while China is facing deflation.
Much of the eurozone remains in recession while the ECB raises rates to control high inflation (much due to green energy mandates). China’s currency has weakened dramatically this year, and the country may be on the brink of recession. After 45 years of uninterrupted growth (and no inflation surge), China’s exports plunged 12.4% in June, imports declined 6.8%, manufacturing sector is in decline, services sector is decelerating, and the total value of new home sales has fallen precipitously YoY. Indeed, according to Reuters, China “faces deflationary risks, mounting local government debts, record youth unemployment, and weakening global demand,” forcing the PBOC to cut interest rates and implement other measures to support its critical real estate sector and massive shadow banking system, which I have long called a “house-of-cards” (private sector debt now totals over 200% of GDP). Lastly, China has not helped itself by saber-rattling with the US while aligning itself with the pariah countries of the world against the West.
But the bigger question in my mind is the direction of money supply and its impact on stock prices. The previous chart illustrates the long-term correlation between rising/falling money supply and stocks—at least until October 2022 when stocks bottomed. Since then, stocks have shown impressive resilience despite contraction in M2 money supply, which topped out in July 2022, thus reducing liquidity in the financial system. I think this largely has to do with the offsetting impact of rising velocity of money supply, which has been ramping up (i.e., more transactions and economic activity for each dollar in circulation) after a long period of decline, as shown in the 5-year chart comparison below.
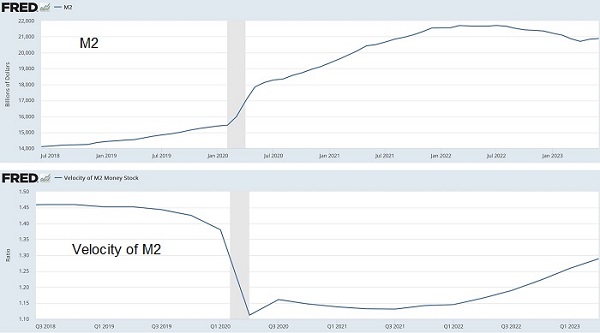
For a long time, we had no inflation even while M2 was rising because velocity was falling, as the liquidity was mostly just padding bank reserves. But for the past year or so, M2 has leveled off and pulled back while velocity has ramped up, as cash multiplies itself through the economy. And now we also see a slight uptick in money supply in May and June.
Nevertheless, it begs the question of whether stocks can continue to rally without the tailwind of new money creation. Or is there still plenty of available fuel from cash on the sidelines, including several trillion dollars in high-yielding money market funds? Many of those MMFs pay a risk-free 5%+ from the Fed’s reverse repo market, so it will take strong FOMO to get that capital to move over to stocks. And what about the accumulated wealth of retiring Baby Boomers and the vast inheritances they are passing along to eager beneficiaries? Will that help maintain consumer spending on goods, services, and risk assets?
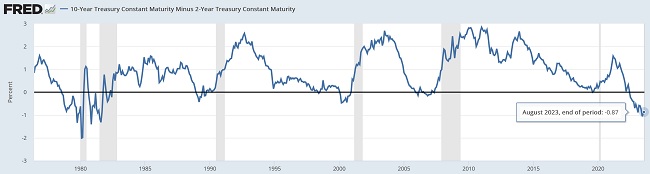
Next let’s check on the yield curve inversion. As the inversion begins to flatten, the economic outlook becomes more sanguine, and it appears to be trying to pound out a bullish double-bottom chart pattern. As shown in the chart below, the 10-2 spread hit its lowest level (i.e., steep inversion) since 1981 when it closed at -1.08 on 7/3. But the spread seems to be on the rebound and is currently approaching -0.70. By the way, the US dollar tends to be relatively strong (in a flight to safety) when the yield curve inverts more steeply.
The Bear case:
Look, I get the Bear case, and it is compelling, too. In a nutshell, it holds that a recession is imminent given the deeply inverted yield curve (suggesting the Fed has overtightened), waning demand in oil and commodities (suggesting a slowing global economy), and tighter bank lending standards and shrinking money supply combining to choke liquidity—the lifeblood of a robust economy. Notably, the 5-year real yield hit 2.15% on 7/3 (as inflation has plunged while rates remain elevated), making it the most restrictive Fed policy since the Financial Crisis, before pulling back to 1.91% as of 7/31.
Furthermore, the Conference Board’s Leading Economic Index has been in decline for 15 straight months. Justyna Zabinska-La Monica, Senior Manager, Business Cycle Indicators, at The Conference Board, wrote, “The US LEI fell again in June, fueled by gloomier consumer expectations, weaker new orders, an increased number of initial claims for unemployment, and a reduction in housing construction…The Leading Index has been in decline for fifteen months—the longest streak of consecutive decreases since 2007-08, during the runup to the Great Recession. Taken together, June’s data suggests economic activity will continue to decelerate in the months ahead. We forecast that the US economy is likely to be in recession from Q3 2023 to Q1 2024. Elevated prices, tighter monetary policy, harder-to-get credit, and reduced government spending are poised to dampen economic growth further.” Of course, this stands in stark contrast to The Conference Board’s aforementioned Consumer Sentiment survey, which just turned positive for the first time since January of 2022.
Other concerns include the aforementioned economic struggles in Europe and China (i.e., the specter of stagflation and deflation, respectively). US corporate debt has surged to a record $13 trillion, which is nearly twice its peak during the 2008 financial crisis. Corporate bankruptcies are rising as higher interest rates and tighter bank lending standards are increasing financing costs, concurrent with a loss in inflation-assisted pricing power. Similarly, household debt has hit a record $17 trillion, exacerbated by those same higher interest rates and tighter lending standards, as well as the resumption of student loan payments. Not surprisingly, auto loan and credit card delinquencies and defaults are rising, while consumer borrowing application rejection rates are rising.
On the other hand, the rise in household debt service as a percentage of disposable income appears to have crested at 9.74% in Q4 2022 and then fell to 9.63% in Q1 2023, which is still modest relative to longer-term history and below pre-pandemic levels—just as the Fed appears to be near the end of its rate hikes. Mortgage applications are rising, and housing starts have been better than expected. The consumer seems fine, and confidence is on the rise. So for me, the bull case seems more likely. And again, as long as the 2-year Treasury yield stays below 5%, I think the economy and stocks will be fine, and the extreme yield inversion will begin to reverse.
Also worth mentioning are the improving fundamentals of blockchain and cryptocurrencies, which of course are another risk asset. As Eric Peters of Coinbase Digital wrote, “Incumbent financial institutions have begun the long process of integrating blockchain into their operations. As they do, more and more assets will be tokenized. This will create great efficiencies and open opportunities for firms with deep expertise in the space. Certain crypto assets should appreciate substantially. And institutions own almost nothing [today].”
Valuations and opportunities:
For much of the year to date, the mega caps soared almost alone while overall market breadth has been poor.. To illustrate, the mega-cap-dominated Nasdaq 100 (QQQ) and S&P 500 (SPY) are up +44.5% and +20.6% YTD (as of 7/31) while the equal-weight S&P 500 (RSP) is up only +10.7% (half the return of its cap-weight counterpart), and Russell 2000 small cap (IWM) is up +14.7%. As a result, relative valuations have seen a huge divergence, with the next-twelve-months forward P/E on the QQQ at 27.5x and cap-weighted SPY at 20.4x, while equal-weighted S&P (RSP) is 16.4x and small cap IWM at 15.5x.
This is actually a solid improvement from several weeks ago, when small caps were displaying their largest discount relative to large caps in 23 years, right before the dot-com bubble burst (after which small caps staged incredible outperformance, by the way). Although we are unlikely to see a similar Tech collapse (given the solid financial strength of the sector today versus 2000 and the absence of a similar Y2K “nothing burger” that had brought forward tremendous capex), it still suggests a buying opportunity in laggards like small caps due to relative valuation, improving market breadth, and mean reversion (on both performance and valuation).
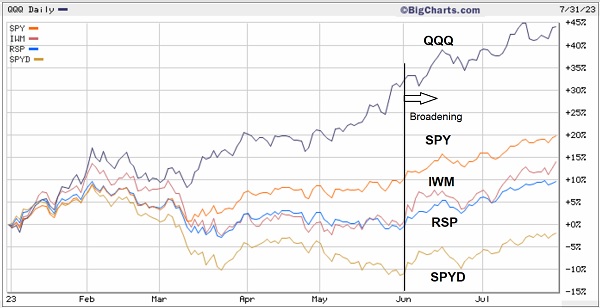
The chart below compares the YTD returns of the cap-weighted QQQ and SPY versus equal-weighted RSP, small cap IWM, and S&P 500 High Dividend (SPYD). You can see that SPYD is badly trailing the other three. All of this is the complete opposite of calendar-year 2022, when SPYD outperformed RSP, which outperformed SPY, which outperformed QQQ. This all reflects the extreme investor preference for the mega-cap Tech juggernauts, which counterintuitively serve as a defensive play due to their market dominance and “wide moats.” Today, the Magnificent Seven” mega-cap Tech companies account for about 28% of the S&P 500’s market capitalization and 55% of Nasdaq 100.
While last year saw a preference for quality and value [led by small cap pure value (RZV)], this year has been dominated by the AI trade. But AI applications and adoption will be a gradual process, and many commentators are expecting a continued resurgence in small caps and the value factor (led by Financials and Energy), as markets move beyond the banking crisis (given the de facto Fed backstop) and oil prices move higher on production cuts and rising global demand. Moreover, we are seeing some energy companies make moves to diversify revenue streams outside of hydrocarbons—such as Exxon’s (XOM) intended expansion into lithium mining (for electric vehicles) and carbon capture.
Indeed, style factors like size, value, quality, and dividend recently perked up. Just since the start of June (through 7/31), small cap IWM is up +14.7% (representing all its YTD gains!), small-cap pure-value (RZV) +18.3%, RSP +11.4%, and S&P 500 high-dividend (SPYD) +11.9%, while QQQ is up +10.4% and SPY +10.0%. So, we are seeing much broader participation, and more sectors are participating (although so far it has been driven more by P/E expansion than by fundamentals). For example, the critical transports (IYT) are up +20.0% since 6/1, and even the beleaguered regional banks (KRE) joined the party, up an impressive +26.1% (although still down -15.6% YTD). Homebuilders (XHB) have been surging all year, up +23.0% since 6/1 and +40.8% YTD. This bodes well for Sabrient’s portfolios, and indeed, since 6/1, we have enjoyed some of our best outperformance days ever relative to SPY.
Moreover, IWM still remains slightly below its early-February peak while mega-cap QQQ is about 23% above its February peak, which suggests a further catch-up from small caps is likely—and perhaps a breakout above its lengthy trading range and Q1 peak. Indeed, many market commentators are recommending adding small cap exposure.
On that note, the Sabrient Small Cap Growth (SCG 38) portfolio offers an alpha-seeking alternative to the passive Russell 2000 index for gaining that exposure. It provides balanced exposure between cyclical and secular-growth sectors, and it has been generally outperforming the Russell 2000 index. In fact, the only recent portfolios to have underperformed are the ones launched in Q4 2022 and Q1 2023 holding much higher allocations to the Energy and Financial sectors than the index. Those sectors took a hit in Q1 from recession fears and the banking crisis but appear to be finding their footing again.
Latest Sector Rankings:
Relative sector rankings are based on our proprietary SectorCast model, which builds a composite profile of each of over 1,000 equity ETFs based on bottom-up aggregate scoring of the constituent stocks. The Outlook Score is a Growth at a Reasonable Price (GARP) model that employs a forward-looking, fundamentals-based multifactor algorithm considering forward valuation, historical and projected earnings growth, the dynamics of Wall Street analysts’ consensus earnings estimates and recent revisions (up or down), quality and sustainability of reported earnings, and various return ratios. It helps us predict relative performance over the next 3-6 months.
In addition, SectorCast computes a Bull Score and Bear Score for each ETF based on recent price behavior of the constituent stocks on particularly strong and weak market days. A high Bull score indicates that stocks within the ETF recently have tended toward relative outperformance when the market is strong, while a high Bear score indicates that stocks within the ETF have tended to hold up relatively well (i.e., safe havens) when the market is weak. Outlook score is forward-looking while Bull and Bear are backward-looking.
As a group, these three scores can be helpful for positioning a portfolio for a given set of anticipated market conditions. Of course, each ETF holds a unique portfolio of stocks and position weights, so the sectors represented will score differently depending upon which set of ETFs is used. We use the iShares that represent the ten major U.S. business sectors: Financials (IYF), Technology (IYW), Industrials (IYJ), Healthcare (IYH), Consumer Staples (IYK), Consumer Discretionary (IYC), Energy (IYE), Basic Materials (IYM), Telecommunications (IYZ), and Utilities (IDU). Whereas the Select Sector SPDRs only contain stocks from the S&P 500 large cap index, I prefer the iShares for their larger universe and broader diversity.
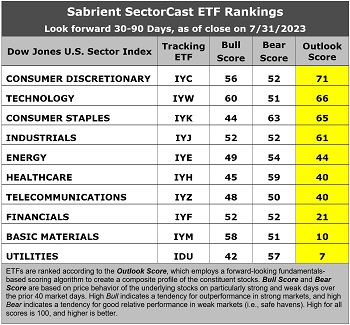
This week’s fundamentals-based Outlook rankings display a solidly bullish bias given the dominance of economically sensitive and cyclical sectors at the top. Consumer Discretionary (IYC) takes the top spot with an Outlook Score of 71, followed by Technology (IYW) at 66, despite both sectors displaying the highest next-twelve-months forward P/E ratios (22.9x and 27.5x, respectively).
IYC and IYW have received the largest upward revisions to EPS estimates among sell-side analysts. They also display strong insider sentiment, solid return ratios, and by far the highest EPS growth forecasts of 19.2% and 15.2%, respectively. Given its strong EPS growth forecast, IYC also displays the lowest forward PEG ratio (forward P/E divided by projected long-term EPS growth rate) of 1.19. Notably, Financials and Telecom have very similar forward P/Es (12.4x and 11.9x, respectively) and projected EPS growth rates (9.1% and 8.8%, respectively).
Consumer Staples, Industrials, Energy, and Healthcare round out the top six. Defensive sector Utilities remains at the bottom with an Outlook Score of 7, which is to be expected in a GARP model for a low-growth industry in an expanding economy. Keep in mind, the Outlook Rank does not include timing, momentum, or relative strength factors, but rather reflects the consensus fundamental expectations at a given point in time for individual stocks, aggregated by sector.
As a reminder, if you have an interest in our quant rankings, we have a new product called Sabrient SmartSheets—one for individual stocks and one for ETFs. They are posted weekly in Excel format and show how your stocks and ETFs score in our various alpha factors…or for identifying the top-ranked stocks and ETFs for each alpha factor (or for weighted combinations of the factors).
ETF Trading Ideas:
Our rules-based Sector Rotation model, which appropriately weights Outlook, Bull, and Bear scores in accordance with the overall market’s prevailing trend (bullish, neutral, or defensive), has retained a bullish posture since SPY rose above both its 50-day and 200-day simple moving averages back in late March. It suggests holding Technology (IYW), Consumer Discretionary (IYC), and Industrials (IYJ), in that order. (Note: In this model, we consider the bias to be bullish from a rules-based trend-following standpoint when SPY is above both its 50-day and 200-day simple moving averages.)
If you prefer a neutral bias, the Sector Rotation model suggests holding Consumer Discretionary, Technology, and Consumer Staples (IYK), in that order. Or, if you prefer a defensive stance, the model suggests holding Consumer Staples, Healthcare (IYH), and Consumer Discretionary, in that order. Note that IYC is suggested for all three scenarios.
An assortment of other interesting ETFs that are scoring well in our latest rankings include: US Global Jets (JETS), iShares US Home Construction (ITB), Defiance Hotel Airline and Cruise (CRUZ), Alger 35 (ATFV), First Trust Expanded Technology (XPND), Hartford Large Cap Growth (HFGO), WBI BullBear Quality 3000 (WBIL), AdvisorShares Vice (VICE), Nuveen Winslow Large Cap Growth ESG (NWLG), Inspire Fidelis Multi Factor (FDLS), WBI BullBear Value 3000 (WBIF), WisdomTree Growth Leaders (PLAT), Alpha Architect US Quantitative Momentum (QMOM), T. Rowe Price Growth Stock (TGRW), Corbett Road Tactical Opportunity (OPPX), JPMorgan Social Advancement (UPWD), AdvisorShares DNA Equity Sentiment (SENT), SEI Enhanced US Large Cap Quality Factor (SEIQ), PGIM Jennison Focused Growth (PJFG), VanEck BDC Income (BIZD), Fidelity Disruptive Finance (FDFF), Guru Favorite Stocks (GFGF), and Innovator IBD Breakout Opportunities (BOUT). All score in the top decile (90-100) of Outlook scores.
As always, I welcome your thoughts on this article! Please email me anytime. Any and all feedback is appreciated! In particular, tell me what sections you find the most valuable—commentary, chart analysis, SectorCast scores, or ETF trading ideas / sector rotation model. Also, please let me know of your interest in a Sabrient index for TAMP or ETF investing…or in the new Sabrient SmartSheets to our full rankings of stocks and ETFs!
IMPORTANT NOTE: I post this information periodically as a free look inside some of our institutional research and as a source of some trading ideas for your own further investigation. It is not intended to be traded directly as a rules-based strategy in a real money portfolio. I am simply showing what a sector rotation model might suggest if a given portfolio was due for a rebalance, and I do not update the information on a regular schedule or on technical triggers. There are many ways for a client to trade such a strategy, including monthly or quarterly rebalancing, perhaps with interim adjustments to the bullish/neutral/defensive bias when warranted, but not necessarily on the days that I happen to post this article. The enhanced strategy seeks higher returns by employing individual stocks (or stock options) that are also highly ranked, but this introduces greater risks and volatility. I do not track performance of the ideas mentioned here as a managed portfolio.
Disclosure: At the time of this writing, of the securities mentioned, the author held positions in SPY, QQQ, XHB, XOM, and NVDA.
Disclaimer: Opinions expressed are the author’s alone and do not necessarily reflect the views of Sabrient. This newsletter is published solely for informational purposes and is not to be construed as advice or a recommendation to specific individuals. Individuals should take into account their personal financial circumstances in acting on any opinions, commentary, rankings, or stock selections provided by Sabrient Systems or its wholly owned subsidiary, Gradient Analytics. Sabrient makes no representations that the techniques used in its rankings or analysis will result in or guarantee profits in trading. Trading involves risk, including possible loss of principal and other losses, and past performance is no indication of future results.