Scott Martindale


  by Scott Martindale
  CEO, Sabrient Systems LLC


Quick note: Sabrient’s new Q3 2026 Baker’s Dozen Portfolio will launch on Monday 7/20 as a 15-month portfolio with a mid-cap bias and a diverse group of 13 stocks across 8 business sectors, including several under-the-radar names. Notably, the next-to-terminate Q2 2025 Baker’s Dozen shows a gross total return of +54.7% from its inception date of 4/17/25 through 7/10/26, vs. +45.6% for SPY. Until 7/17, the Q2 2026 portfolio remains in primary market for new investment. Its top performers so far are Seagate Technologies (STX), Roku (ROKU), and AbbVie (ABBV).

Overview

During Q2 2026, the S&P 500 and Nasdaq Composite indexes posted their best quarter since the pandemic recovery in 2020, rising +14.9% and +21.4%, respectively, driven by AI-related chip stocks, as the resilient bull market powers on. And encouragingly, market breadth expanded nicely as the Russell 2000 small cap index was up +21.4% (following a flat +0.9% Q1), giving it its best H1 since 1991 (+22.6%) as investors sought to broaden their exposure into growing companies poised to benefit from the One Big Beautiful Bill Act’s (OBBBA) tax policies, deregulation, and incentives.

After ChatGPT arrived in November 2022, the market was all about AI-dominant Big Tech, creating hyperscale, and spending unprecedented capex (consuming all the hyperscalers’ massive cash flow, plus some new debt) that drove a 150% gain in the Nasdaq over the ensuing 3.5+ years (annualizing around 30%/yr). But so far this year, the “S&P 493” have vastly outperformed the MAG7 (which peaked on 5/14 and then sold off 15% by 6/26 before bouncing), and investors have invited small caps—and other “trickle down” industries benefiting from massive AI capex—to join the party, despite the event-driven oil price shock, inflation spike, and rising Treasury yields. But Treasury yields are likely being driven more by the hawkish Fed talk than from concerns about structural inflation, and although the coast isn’t entirely clear of macro hurdles, it would be highly unusual for this broadening advance to spell the end of the bull market.

In my full commentary below, I discuss:

1. The trend in consumer sentiment vs. stock prices
2. AI capex and power demand
3. Fundamental tailwinds and the impact on China
4. The “SaaSpocalyse” and what happens next
5. Global liquidity concerns
6. Status and outlook for GDP, inflation, jobs, and productivity
7. My final comments section on stanching the insidious rise of socialism in this country
8. Sabrient’s sector rankings, positioning of our sector rotation model, and some top-ranked ETF ideas

Investor preferences even within Big Tech are definitely rotating. Suddenly, Apple (AAPL) has caught up with Alphabet (GOOGL) as the top performing MAG7 stocks YTD. Apple is expanding its relationship with Broadcom (AVGO) in a $30 billion chipmaking deal to produce more than 15 billion chips in the US, including expansion of Broadcom’s Fort Collins, CO facility. There are now 13 stocks in the $1 trillion market cap club—the MAG7 plus tech sector comrades Taiwan Semi (TSM), Broadcom (AVGO), SpaceX (SPCX), and Micron (MU), along with financial Berkshire Hathaway (BRK-B) and healthcare name Lilly & Co (LLY).

Meanwhile, previous investor darling NVIDIA (NVDA) is now trading at its lowest multiple since 2019. Despite posting an 85% YoY increase in revenue, hitting a whopping $81.6 billion last quarter, share price has been flat such that its forward P/E at around 22x is on par with the broad S&P 500’s composite forward P/E. Compare that to its 5-year average of 72x. The chart below is from Phil Rosen of Opening Bell Daily.
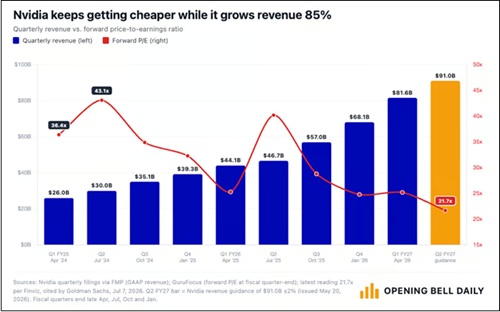
NVIDIA growth trend

After pulling back nearly 20% from its all-time high on 5/14, NVIDIA has recovered some ground and is up about +13% YTD, but rival Advanced Micro (AMD) is up +160% and Intel (INTC) is up +200% over the same timeframe, with forward P/Es around 75x and 125x, respectively. More broadly, according to Morgan Stanley, the P/E premium for the MAG7 versus the other S&P 493 has compressed from above 30% to roughly 10%. I suppose investors don’t see how it can continue to achieve such amazing growth and huge margins, which are attracting more competition in the space. Regardless, analysts continue to raise estimates, and NVIDIA should remain a growth juggernaut for the foreseeable future—particularly with hyperscaler capex (much of which buys NVIDIA products) projected to reach $1 trillion in 2027.

Incredibly, although NVIDIA lost around $1 trillion in market cap during its May-June correction, it is now back above $5 trillion in market cap and is the world’s largest company—on par with Germany’s entire nominal GDP, which is the third-largest economy in the world behind the US and China. NVIDIA represents about 8.5% of the S&P 500 index market cap, and it is larger than: 1) the entire Russell 2000 small cap index ($3.5 trillion), 2) 6 of the world’s top 10 stock exchanges (including UK, France, Italy, India, and Spain); 3) 6 of the 11 sectors of the S&P 500 individually; and 4) the combined market cap of the S&P 500’s Materials, Real Estate, and Utilities sectors.

Broadening beyond the market’s biggest stocks is well in motion. Both the Russell 2000 small cap index (+20% YTD) and the Dow Jones Transportation Average (+18% YTD) have had their best start to a year since 1991. Financials, Healthcare, and Industrials all displayed outperformance versus the broad S&P 500 during June. Corporate profitability has been solid across industries, reflecting resilient demand, disciplined cost management, technological innovation, and sustainable productivity gains—not to mention the trillions of dollars in capex for the gradual onshoring/reshoring of manufacturing, much of it already underway. Net corporate income now accounts for 12.4% of GDP.

As I write about regularly, the outlook for inflation continues to improve, particularly given the many underlying global disinflationary trends. This week brings the June CPI/PPI numbers, which I expect will be lower—although the resumption this month in hostilities in Iran and the resultant jump in oil and gasoline prices might signal some inflationary pressures for the July metrics and cause investors (and the Fed) to hold off on any celebration. Notably, seven OPEC+ countries (Saudi Arabia, Russia, Iraq, Kuwait, Kazakhstan, Algeria, and Oman) agreed to increase oil production by a combined 188,000 barrels per day starting in August. But beyond that announcement, supply chains have rapidly diversified in response to the Strait of Hormuz bottleneck—and what the International Energy Agency (IEA) has called “the largest supply disruption in history”—such that it is no longer strangling the global economy, as I discussed in my April post. Indeed, this was long overdue as Iran has not been a reliable observer of the “right of transit passage” in narrow international straits under the UN Convention on the Law of the Sea (UNCLOS) in 47 years.

In my full commentary below, I discuss the divergence between poor consumer sentiment versus strong advisor sentiment and a rising stock market, as well as the shift in focus from both the federal government and institutional investors into hard assets and infrastructure. Moreover, through the end of this decade and likely beyond, I expect to see smaller government and less low-ROI government spending in favor of more high-ROI capital allocation from an unleashed private sector as the primary engine of organic economic growth through fiscal support like favorable tax policy, deregulation, and other supply-side incentives for reshoring/onshoring to increase productive capacity.

This should lead to strong real GDP growth, a peace dividend, rising productivity and a resumption in other disinflationary trends that bring back inflation under 2.5%, and a new “hands-off” Federal Reserve under new chairman Kevin Warsh that aims for less market intervention and does not fear that robust economic growth (aka “overheated” or “above trend”) fuels inflation. Instead, Warsh believes as I do that inflation in general is driven by excessive monetary expansion and deficit spending (including massive spending bills, “helicopter money,” and QE), rather than by a strong and productive private economy.

As such, I still think the S&P 500 might hit 8,000 by year end, although I also think gold, silver, copper, and bitcoin remain long-term accumulation plays, even though they might see further near-term headwinds (e.g., war, a hawkish Fed, and a strong dollar). Given the market broadening beyond the Big Tech titans, and assuming the Fed does not become overly hawkish, we continue to see opportunities in active stock selection, small caps, and bond-alternative dividend payers.

Indeed, Sabrient’s Baker’s Dozen, Forward Looking Value, Small Cap Growth, and Dividend portfolios have been largely outperforming their benchmarks. Our latest Q2 2026 Baker’s Dozen Portfolio launched on 4/17 as a 15-month portfolio with a mid-cap bias and a diverse group of 13 stocks across eight business sectors. It remains in primary market until Friday 7/17, and then the new Q3 2026 Baker’s Dozen launches on Monday 7/20. And, as a reminder, our Earnings Quality Rank (EQR) is licensed as a quality prescreen to the actively managed, low-beta First Trust Long-Short ETF (FTLS), which now has over $2.4 billion in AUM.

Sabrient employs a variety of fundamental financial factors in our quantitative models and portfolio selection process. Sabrient Scorecards for Stocks and ETFs are investor tools that provide access to several of our proprietary models for idea generation and portfolio monitoring. To learn more, I invite you to visit https://MoonRocksToPowerStocks.com where you can download founder David Brown’s latest book (an Amazon international bestseller) and 2 bonus reports (on investing in the Future of Energy and Space Exploration)—all in PDF format—and start subscribing to the Scorecards, which make David’s process easy for idea generation and portfolio monitoring. They include our Top 30 stocks each week for 4 distinct investing strategies—Growth, Value, Dividend, and Small Cap. To go straight to the Scorecard subscription, go to: https://www.moonrockstopowerstocks.com/sabrient-scorecard

Here is a link to this post in printable PDF format. As always, I’d love to hear from you! Please feel free to email me your thoughts on this article or if you’d like me to speak on any of these topics at your event!  Read on….

Scott Martindale  by Scott Martindale
  President & CEO, Sabrient Systems LLC

Stocks continued their impressive 2023 rally through July, buoyed by rapidly falling inflation, steady GDP and earnings growth, improving consumer and investor sentiment, and a fear of missing out (FOMO). Of course, the big story this year has been the frenzy around the promise of artificial intelligence (AI) and leadership from the “Magnificent Seven” Tech-oriented mega caps—Apple (AAPL), Amazon (AMZN), Alphabet (GOOGL), NVIDIA (NVDA), Meta (META), Tesla (TSLA), and Microsoft (MSFT), which have led the powerhouse Nasdaq 100 (QQQ) to a +44.5% YTD return (as of 7/31) and within 5% of its all-time closing high of $404 from 11/19/2021. Such as been the outperformance of these 7 stocks that Nasdaq chose to perform a special re-balancing to bring down their combined weighting in the Nasdaq 100 index from 55% to 43%!

Because the Tech-heavy Nasdaq badly underperformed during 2022, mostly due to the long-duration nature of aggressive growth stocks in the face of a rising interest rate environment, it was natural that it would lead the rally, particularly given: 1) falling inflation and an expected Fed pause/pivot on rate hikes, 2) resilience in the US economy, corporate profit margins (largely due to cost discipline), and the earnings outlook; 3) the exciting promise of disruptive/transformational technologies like regenerative artificial intelligence (AI), blockchain and distributed ledger technologies (DLTs), and quantum computing.

But narrow leadership isn’t healthy—in fact, it reflects defensive sentiment, as investors prefer to stick with the juggernauts rather than the vast sea of economically sensitive companies. However, since June 1, there have been clear signs of improving market breadth, with the iShares Russell 2000 small caps (IWM), S&P 400 mid-caps (MDY), and S&P 500 Equal Weight (RSP) all outperforming the QQQ and S&P 500 (SPY). Industrial commodities oil, silver, and copper prices rose in July. This all bodes well for market health through the second half of the year (and perhaps beyond), as I discuss in today’s post below.

But for the moment, an overbought stock market is taking a breather to consolidate gains, take some profits, and pull back. The Fitch downgrade of US debt is helping fuel the selloff. I view it as a welcome buying opportunity.

Although rates remain elevated, they haven’t reached crippling levels (yet), and although M2 money supply has topped out and fallen a bit, the decline has been offset by a surge in the velocity of money supply, as I discuss in today’s post. So, assuming the Fed is done raising rates—and I for one believe the fed funds rate is already beyond the neutral rate (and thus contractionary)—and as long as the 2-year Treasury yield remains below 5% (it’s around 4.9% today), I think the economy and stocks will be fine, and the extreme yield inversion will begin to reverse.

The Fed’s dilemma is to facilitate the continued process of disinflation without inducing deflation, which is recessionary. Looking ahead, Nick Colas at DataTrek recently highlighted the disconnect between fed funds futures (which are pricing in 1.0-1.5% in rate cuts early next year) and US Treasuries (which do not suggest imminent rate cuts). He believes, “Treasuries have it right, and that’s actually bullish for stocks” (bullish because rate cuts only become necessary when the economy falters).

So, today we see inflation has fallen precipitously as supply chains improve (manufacturing, transport, logistics, energy, labor), profit margins are beating expectations (largely driven by cost discipline), corporate earnings have been resilient, earnings forecasts are seeing upward revisions, capex and particularly construction spending on manufacturing facilities has been surging, hiring remains robust (almost 2 job openings for every willing worker), the yield curve inversion is trying to flatten, gold and high yield spreads have been falling since May 1 (due to recession risk receding, the dollar firming, and real yields rising), risk appetite (“animal spirits”) is rising, and stock market leadership is broadening. It all sounds promising to me.

Regardless, the passive broad-market mega-cap-dominated indexes that were so hard for active managers to beat in the past may well face tough constraints on performance, particularly in the face of elevated valuations (i.e., already “priced for perfection”), slow real GDP growth, and an ultra-low equity risk premium. Thus, investors may be better served by strategic-beta and active strategies that can exploit the performance dispersion among individual stocks, which should be favorable for Sabrient’s portfolios including Baker’s Dozen, Forward Looking Value, Small Cap Growth, and Dividend.

As a reminder, Sabrient’s enhanced Growth at a Reasonable Price (GARP) “quantamental” selection process strives to create all-weather growth portfolios, with diversified exposure to value, quality, and growth factors, while providing exposure to both longer-term secular growth trends and shorter-term cyclical growth and value-based opportunities—with the potential for significant outperformance versus market benchmarks. Indeed, the Q2 2022 Baker’s Dozen that recently terminated on 7/20 handily beat the benchmark S&P 500, +28.3% versus +3.8% gross total returns. In addition, each of our other next-to-terminate portfolios are also outperforming their relevant market benchmarks (as of 7/31), including Small Cap Growth 34 (16.9% vs. 9.9% for IWM), Dividend 37 (24.0% vs. 8.5% for SPYD), Forward Looking Value 10 (38.9% vs. 20.8% for SPY), and Q3 2022 Baker’s Dozen (28.4% vs. 17.9% for SPY).

Also, please check out Sabrient’s simple new stock and ETF screening/scoring tools called SmartSheets, which are available for free download for a limited time. SmartSheets comprise two simple downloadable spreadsheets—one displays 9 of our proprietary quant scores for stocks, and the other displays 3 of our proprietary scores for ETFs. Each is posted weekly with the latest scores. For example, Lantheus Holdings (LNTH) was ranked our #1 GARP stock at the beginning of February. Accenture (ACN) was at the top for March, Kinsdale Capital (KNSL) in April, Crowdstrike (CRWD) in May, and at the start of both June and July, it was discount retailer TJX Companies (TJX). Each of these stocks surged higher (and outperformed the S&P 500)—over the ensuing weeks after being ranked on top. We invite you to download the latest weekly sheets for stocks and ETFs using the link above—it’s free of charge for now. And please send me your feedback!

Here is a link to my full post in printable format. In this periodic update, I provide a comprehensive market commentary, including discussion of inflation, money supply, and why the Fed should be done raising rates; as well as stock valuations and opportunities going forward. I also review Sabrient’s latest fundamentals based SectorCast quant rankings of the ten U.S. business sectors and serve up some actionable ETF trading ideas. Read on…

Scott Martindale  by Scott Martindale
  President & CEO, Sabrient Systems LLC

After five straight weeks of gains—goosed by a sudden surge in excitement around the rapid advances, huge capex expectations, and promise of Artificial Intelligence (AI), and supported by the CBOE Volatility Index (VIX) falling to its lowest levels since early 2020 (pre-pandemic)—it was inevitable that stocks would eventually take a breather. Besides the AI frenzy, market strength also has been driven by a combination of “climbing a Wall of Worry,” falling inflation, optimism about a continued Fed pause or dovish pivot, and the proverbial fear of missing out (aka FOMO).

Once a debt ceiling deal was struck at the end of May, a sudden jump in sentiment among consumers, investors, and momentum-oriented “quants” sent the mega-cap-dominated, broad-market indexes to new 52-week highs. Moreover, the June rally broadened beyond the AI-oriented Tech giants, which is a healthy sign. AAIA sentiment moved quickly from fearful to solidly bullish (45%, the highest since 11/11/2021), and investment managers are increasing equity exposure, even before the FOMC skipped a rate hike at its June meeting. Other positive signs include $7 trillion in money market funds that could provide a sea of liquidity into stocks (despite M2 money supply falling), the US economy still forecasted to be in growth mode (albeit slowly), corporate profit margins beating expectations (largely driven by cost discipline), and improvements in economic data, supply chains, and the corporate earnings outlook.

Although the small and mid-cap benchmarks joined the surge in early June, partly boosted by the Russell Index realignment, they are still lagging quite significantly year-to-date while reflecting much more attractive valuations, which suggests they may provide leadership—and more upside potential—in a broad-based rally. Regardless, the S&P 500 has risen +20% from its lows, which market technicians say virtually always indicates a new bull market has begun. Of course, the Tech-heavy Nasdaq badly underperformed during 2022, mostly due to the long-duration nature of growth stocks in the face of a rising interest rate environment, so it is no surprise that it has greatly outperformed on expectations of a Fed pause/pivot.

With improving market breadth, Sabrient’s portfolios—which employ a value-biased Growth at a Reasonable Price (GARP) style and hold a balance between cyclical sectors and secular-growth Tech and across market caps—this month have displayed some of their best-ever outperformance days versus the benchmark S&P 500.

Of course, much still rides on Fed policy decisions. Inflation continues its gradual retreat due to a combination of the Fed allowing money supply to fall nearly 5% from its pandemic-response high along with a huge recovery in supply chains. Nevertheless, the Fed has continued to exhibit a persistently hawkish tone intended to suppress an exuberant stock market “melt-up” and consumer spending surge (on optimism about inflation and a soft landing and the psychological “wealth effect”) that could hinder the inflation battle.

Falling M2 money supply has been gradually draining liquidity from the financial system (although the latest reading for May showed a slight uptick). And although fed funds futures show a 77% probably of a 25-bp hike at the July meeting, I’m not so sure that’s going to happen, as I discuss in today’s post. In fact, I believe the Fed should be done with rate hikes…and may soon reverse the downtrend in money supply, albeit at a measured pace. (In fact, the May reading for M2SL came in as I was writing this, and it indeed shows a slight uptick in money supply.) The second half of the year should continue to see improving market breadth, in my view, as capital flows into the stock market in general and high-quality names in particular, from across the cap spectrum, including the neglected cyclical sectors (like regional banks).

Regardless, the passive broad-market mega-cap-dominated indexes that were so hard for active managers to beat in the past may well face high-valuation constraints on performance, particularly in the face of slow real GDP growth (below inflation rate), sluggish corporate earnings growth, elevated valuations, and a low equity risk premium. Thus, investors may be better served by strategic-beta and active strategies that can exploit the performance dispersion among individual stocks, which should be favorable for Sabrient’s portfolios—including Q2 2023 Baker’s Dozen, Small Cap Growth 38, and Dividend 44—all of which combine value, quality, and growth factors while providing exposure to both longer-term secular growth trends and shorter-term cyclical growth and value-based opportunities. (Note that Dividend 44 offers both capital appreciation potential and a current yield of 5.1%.)

Quick reminder about Sabrient’s stock and ETF screening/scoring tool called SmartSheets, which is available for free download for a limited time. SmartSheets comprise two simple downloadable spreadsheets—one displays 9 of our proprietary quant scores for stocks, and the other displays 3 of our proprietary scores for ETFs. Each is posted weekly with the latest scores. For example, Lantheus Holdings (LNTH) was ranked our #1 GARP stock at the beginning of February before it knocked its earnings report out of the park on 2/23 and shot up over +20% in one day (and kept climbing). At the start of March, it was Accenture (ACN). At the beginning of April, it was Kinsdale Capital (KNSL). At the beginning of May, it was Crowdstrike (CRWD). At the start of June, it was again KNSL (after a technical pullback). All of these stocks surged higher—while significantly outperforming the S&P 500—over the ensuing weeks. Most recently, our top-ranked GARP stock has been discount retailer TJX Companies (TJX), which was up nicely last week while the market fell. Feel free to download the latest weekly sheets using the link above—free of charge for now—and please send us your feedback!

Here is a link to my full post in printable format. In this periodic update, I provide a comprehensive market commentary, including discussion of inflation and why the Fed should be done raising rates, stock valuations, and the Bull versus Bear cases. I also review Sabrient’s latest fundamentals based SectorCast quant rankings of the ten U.S. business sectors and serve up some actionable ETF trading ideas. Read on…