Sector Detector: Expect heightened volatility but solid gains for stocks in a tumultuous election year
 by Scott Martindale
President & CEO, Sabrient Systems LLC
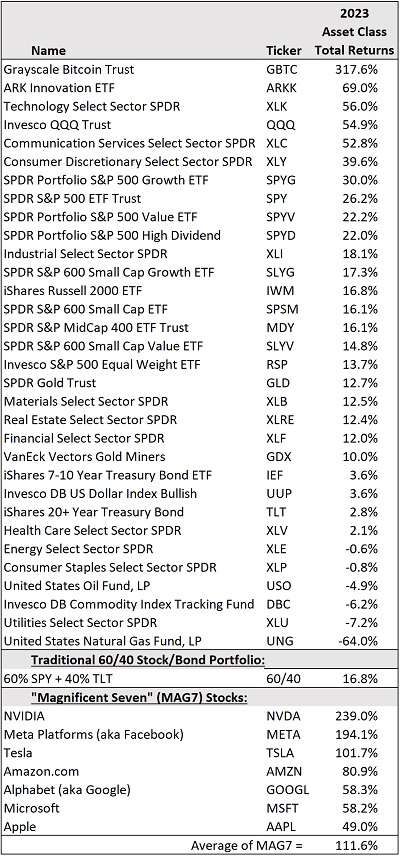
To be sure, 2023 was another eventful year (they just keep coming at us, don’t they?), ranging from escalating hot wars to a regional banking crisis, rising interest rates, falling inflation, a dire migration crisis, and an AI-driven frenzy in the so-called “Magnificent Seven” (MAG7) corporate titans— Meta Platforms (META, ne: FB), Apple (AAPL), Nvidia (NVDA), Alphabet (GOOGL), Microsoft (MSFT), Amazon (AMZN), and Tesla (TSLA), aka “FANGMAT,” as I used to call them—which as a group contributed roughly 60% to the S&P 500’s +26.2% gain in 2023. Their hyper-growth means that they now make up roughly 30% of the index. Nvidia (NVDA), whose semiconductors have become essential for AI applications, was the best performer for the full year at +239%.
Small caps finally found some life late in the year, with the Russell 2000 small cap index essentially keeping up with the S&P 500 starting in May and significantly outperforming in December. Bonds also made a big comeback late in the year on Fed-pivot optimism, which allowed the traditional 60/40 stock/bond allocation portfolio to enjoy a healthy return, which I’m sure made a lot of investors and their advisors happy given that 60/40 had been almost left for dead. The CBOE Volatility Index (VIX) has been below 20 for virtually the entirety of 2023 and as low as 11.81 in December, closing the year at 12.45. Also, as a breadth indicator, the percentage of stocks that finished the year above their 200-day moving average hit 75%, which is bullish.
Nevertheless, the Russell 2000 (+16.8%) and the equal-weight version of the S&P 500 (+13.7%) were up much less for the full year than the cap-weighted S&P 500 (+26.2%) and Nasdaq 100 (+54.9%). In fact, 72% of the stocks in the S&P 500 underperformed the overall index for the full year, illustrating that despite the improvement in breadth during the second half of the year, it could not overcome the huge outperformance of a small cohort of dominant companies. This suggests that either the market is set up for a fall in 2024 (as those dominant companies sell off) …or we’ll get a continued broadening into other high-quality companies, including mid- and small caps. I think it will be the latter—but not without some volatility and a significant pullback. Indeed, despite signaling investor confidence and complacency by remaining low for a long stretch, the VIX appears to be ripe for a spike in volatility. I think we could see a significant market correction during H1 (perhaps to as low as 4,500 on the S&P 500) even if, as I expect, real GDP growth slows but remains positive and disinflationary trends continue, supporting real wage growth and real yields—before seeing an H2 rally into (and hopefully following) the November election. And don’t forget there’s a potential tsunami of cash from the $6 trillion held in money market funds, as interest rates fall, much of it may well find its way into stocks.
Not surprisingly, last year ended with some tax-loss harvesting (selling of big losers), and then the new year began last week with some tax-gain harvesting—i.e., selling of big winners to defer tax liability on capital gains into 2024. There also has been some notable rotation of capital last week into 2023’s worst performers that still display strong earnings growth potential and solid prospects for a rebound this year, such as those in the Healthcare, Utilities, and Consumer Staples sectors. Homebuilders remain near all-time highs and should continue to find a tailwind as a more dovish Fed means lower mortgage rates and a possible housing boom. Energy might be interesting as well, particularly LPG shipping (a big winner last year) due to its growing demand in Europe and Asia.
As I discussed in my December commentary, I also like the prospects for longer-duration bonds, commodities, oil, gold, and uranium miner stocks this year, as well as physical gold, silver, and cryptocurrency as stores of value in an uncertain macro climate. Also, while Chinese stocks are near 4-year lows, many other international markets are near multi-year highs (including Europe and Japan), particularly as central banks take a more accommodative stance. Indeed, Sabrient’s SectorCast ETF rankings show high scores for some international-focused ETFs (as discussed later in this post).
While stocks rallied in 2023 (and bonds made a late-year comeback) mainly due to speculation on a Fed pivot toward lower interest rates (which supports valuations), for 2024 investors will want to see more in the way of actual earnings growth and other positive developments for the economy. I expect something of a “normalization” away from extreme valuation differentials and continued improvement in market breadth, whether it’s outperformance by last year’s laggards or a stagnation/pullback among last year’s biggest winners (especially if there are fewer rate cuts than anticipated)—or perhaps a bit of both. Notably, the S&P 500 historically has risen 20 of the last 24 election years (83%); however, a recent Investopedia poll shows that the November election is the biggest worry among investors right now, so it’s possible all the chaos, wailing and gnashing of teeth about Trump’s candidacy will make this election year unique with respect to stocks.
Regardless, I continue to believe that investors will be better served this year by active strategies that can identify and exploit performance dispersion among stocks across the capitalization spectrum—particularly smaller caps and the underappreciated, high-quality/low-valuation growers. Small caps tend to carry debt and be more sensitive to interest rates, so they have the potential to outperform when interest rates fall, but you should focus on stocks with an all-weather product line, a robust growth forecast, a solid balance sheet, and customer loyalty, which makes them more likely to withstand market volatility—which may well include those must-have, AI-oriented Tech stocks. Much like the impact of the Internet in the 1990s, AI/ML, blockchain/distributed ledger technologies (DLTs), and quantum computing appear to be the “it” technologies of the 2020’s that make productivity and efficiency soar. However, as I discuss in today’s post, the power requirements will be immense and rise exponentially. So, perhaps this will add urgency to what might become the technology of the 2030’s—i.e., nuclear fusion.
On that note, let me remind you that Sabrient’s actively selected portfolios include the Baker’s Dozen (a concentrated 13-stock portfolio offering the potential for significant outperformance), Small Cap Growth (an alpha-seeking alternative to a passive index like the Russell 2000), and Dividend (a growth plus income strategy paying a 4.5% current yield).
By the way, several revealing economic reports were released last week, which I discuss in today’s post. One was the December reading on the underappreciated New York Federal Reserve Global Supply Chain Pressure Index (GSCPI), which has fallen precipitously from it pandemic-era high and now is fluctuating around the zero line. This historically suggests falling inflation readings ahead. As for the persistently inverted yield curve, I continue to believe it has more to do with the unprecedented supply chain shocks coupled with massive fiscal and monetary stimulus to maintain demand and the resulting surge in inflation, which as observed by Alpine Macro, “makes the inversion more reflective of different inflation expectations than a signal for an impending recession.”
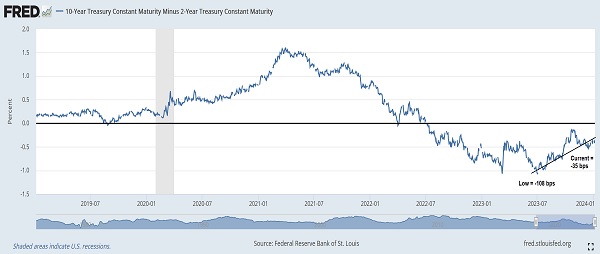
Also, although M2 money supply fell -4.6% from its all-time high in July 2022 until its low in April 2023, it has essentially flatlined since then and in fact has been largely offset to a great extent by an increase in the velocity of money supply. Also, we have a robust jobs market that has slowed but is far from faltering. And then there is the yield curve inversion that has been gradually flattening from a low of about -108 bps last July to -35 bps today.
I discuss all of this in greater detail in today’s post, including several illustrative tables and charts. I also discuss Sabrient’s latest fundamentals based SectorCast quantitative rankings of the ten U.S. business sectors (which is topped by Technology), current positioning of our sector rotation model (which turned bullish in early November and remains so), and some actionable ETF trading ideas.
Overall, I expect inflation will resume its decline, even with positive GDP growth, particularly given stagnant money supply growth, mending and diversifying supply chains (encompassing manufacturing, transportation, logistics, energy, and labor), falling or stabilizing home sale prices and new leases, slowing wage inflation, slower consumer spending on both goods and services, and a strong deflationary impulse from China due to its economic malaise and “dumping” of consumer goods to shore up its manufacturing (US imports from China were down 25% in 2023 vs. 2022). This eventually will give the Fed (and indeed, other central banks) license to begin cutting rates—likely by mid-year, both to head off renewed crises in banking and housing and to mitigate growing strains on highly leveraged businesses, consumers, government, and trading partners. Current CBOE fed funds futures suggest a 98% chance of at least 100 bps in rate cuts by year end (target rate of 4.25-4.50%), and 54% chance of at least 150 bps.
Click here to continue reading my full commentary … or if you prefer, here is a link to this post in printable PDF format (as some of my readers have requested). And please feel free to share my full post with your friends, colleagues, and clients! You also can sign up for email delivery of this periodic newsletter at Sabrient.com
Market commentary:
In January of 2023, I said, “…although inflation and interest rates surged much higher than I predicted at the beginning of 2022, my broad storyline around inflation and Fed policy remains intact: i.e., a softening of its hawkish jawboning, followed by slower rate hikes and some balance sheet runoff (QT), a pause (or neutral pivot) to give the rapid rate hikes a chance to marinate…and then as inflation readings retreat and/or recession sets in, rate cuts commence leading to an extended relief rally and perhaps the start of a new (and lasting) bull market….
“I believe inflation and bond yields will continue to recede and supply chains will continue to recover (albeit hindered by Russia’s war), while the Fed induces demand destruction and a mild recession, leading global investors to seek the safety and income of elevated Treasury yields (i.e., rising bond prices). If inflation and nominal yields continue to fall, real yields (nominal minus inflation) should follow, leading to a neutral Fed pivot in H1 2023 to at least allow the tightening enacted thus far some time to take full effect, which typically takes 9-12 months for each action to show its impact. Then we should see improving corporate profitability, rising earnings, and perhaps some multiple expansion on stock valuations (e.g., higher P/Es).”
So, how did I do? Pretty well actually. Money supply indeed continued to contract, then the pace of rate hikes slowed Fed and ultimately paused mid-year, and in December the Fed signaled a dovish pivot in 2024 and at least a few interest-rate cuts. Inflation continued to pull back from its mid-2022 peak as supply chain pressures eased and consumer demand waned given a stifling fast rise in interest rates. Bond prices eventually rose late in the year to finish in the black. Although we have not seen an obvious recession, we have seen something akin to economist Ed Yardeni’s “rolling recession” theory across industries. And although we did not see much in the way of rising earnings, we did get multiple expansion on forecasts of rising earnings this year in tandem with falling interest rates.
Given the attractive valuations (17.3x forward P/E on the S&P 500) at the start of 2023 and a surge in optimism about the promise of artificial intelligence (AI) for productivity and economic growth, investors conjured up the confidence to buy stocks again. But then they encountered a burgeoning regional banking crisis that required intervention from the Federal Reserve, surging federal debt (now at $34 trillion with annual debt service surpassing $1 trillion/year), another debt ceiling debacle and US credit rating downgrade, further rate hikes, a continued decline in inflation, a dire border crisis spreading into our largest cities, rising crime and homelessness, and another hot war (Israel/Hamas)—with global hostilities rising seemingly everywhere and international migration becoming a booming (and mostly illicit) industry unto itself. And then of course we had rising domestic political tensions as election campaigning ramped up—including an all-hands-on-deck attempt (through multiple courts, FBI investigations, and executive actions in several Democrat-led states) to keep Donald Trump off the ballot this year.
And yet investors soldiered on, emboldened by resilience in the labor market and consumer buying, strong corporate profit margins and productivity, positive economic growth in the face of rising interest rates (after we had all become accustomed to ZIRP), and of course the gradual but persistent decline in inflation. Their faith ultimately was rewarded with a Fed pause on rate hikes and then a dovish pivot (at least in tone) at the December FOMC meeting. In a nutshell, as unlikely a combination as it may sound, 2023 brought a rise in global and domestic chaos on the one hand but also economic optimism on the other, as many believe that a recession has been averted. Indeed, for stocks, 2023 gave investors a solid reversal of fortunes from a dismal 2022, with the S&P 500 rising 26% to essentially recoup all its losses and come within a whisker (4,783) of its all-time high (4,793) from almost exactly two years ago. The Technology sector was the big winner, with the Nasdaq 100 up +55%, led by the MAG7 corporate titans.
After surging to a high of 5.0% in mid-October, the 10-year Treasury yield quickly crashed to below 3.9% to close the year. But so far in 2024, yields have crept back up. Should we be worried that the “bond vigilantes” will be back in force to protest our unbridled federal spending, surging national debt, and massive Treasury issuance? Perhaps. But in my view, this is very much the same technical pullback in bonds that stocks are seeing to start the year. The iShares 20+ year Treasury Bond ETF (TLT) and iShares 7-10 Year Treasury Bond ETF (IEF) both regained their 200-day moving averages last month and now appear to be simply retesting support at that level.
You might recall that I have been calling the 5% handle on the 2-year Treasury yield a “line in the sand” for stocks, and indeed, the August-October timeframe was rough after the 2-year yield broke through the 5% level to as high as 5.24%. But once it fell back below that level entering November, stocks were off to the races through year-end. Now, with Treasury notes below 5% once again, investors can focus more on earnings and the economy.
Although IG, BBB, and HY corporate bond spreads all spiked last week (and bonds sold off), they remain at the lowest levels since early-2022 (when the 10-year was below 2.0%), reflecting optimism about 2024 corporate fundamentals. In fact, the feared “wall of supply” in maturing debt may be much less than expected. According to Invesco, as companies choose to pay down debt, net investment grade debt issuance should be the lowest in five years. I expect bond prices to meander higher (and rates to go lower) as the year progresses.
The traditional 60/40 stock/bond portfolio certainly came back from the dead, with a full-year return of +16.8% [assuming a combination of 60% allocation to the SPDR S&P 500 ETF (SPY) and 40% to the iShares 20+ year Treasury ETF (TLT)], despite extreme weakness in Treasuries for most of the year. November alone reflected the best monthly return for 60/40 in 30 years at +9.5%. This was a welcome occurrence for many financial advisors and their investors, particularly following a horrific 2022 which was one of the worst years ever for the 60/40 portfolio, providing the lowest return since 2008 and the second worst since 1974. But it is worth noting that in the two years following both 2008 and 1974, the 60/40 returns were quite good, which might bode well for 2024 as well.
The final Q3 2023 GDP number came in at an impressive 4.9% (albeit driven more by state and federal government spending than by personal consumption), which follows Q1 and Q2 readings of 2.2% and 2.1%. Notably, Q3 also saw a robust 5.2% surge in productivity following a Q2 increase of 2.4%, which as pointed out by Cetera CIO Gene Goldman, is what is typically seen at the end of a recession after companies have cut expenses and customer demand begins to improve.
For Q4 2023, the Atlanta Fed’s GDPNow model is currently forecasting 2.2% GDP growth (as of 1/9), so it appears the US economy defied widespread expectations of a recession despite onerous challenges like hot wars, a regional banking crisis, persistent (aka “sticky”) inflation, the Fed’s ultra-hawkish rhetoric, and a rapid rise in interest rates—all of which led most prognosticators to predict a recession. I was mostly concerned that the Fed was playing a dangerous game of chicken with highly indebted US and global economies. Instead, we have yet to see an official recession, despite strong warnings entering 2023 from the likes of the Conference Board and The World Bank.
Both GDP and corporate earnings growth expectations continue to hold up, and the US dollar has been weakening since November (which supports S&P 500 earnings). According to FactSet, 2023 was disappointing, seeing only 2.3% revenue growth and 0.6% EPS growth. Moreover, during Q4, Wall Street cut their aggregate estimates for the quarter more than usual (-6.8% vs. the 20-year average of -3.8%). But things are considerably more sanguine for 2024, despite the many challenges at hand both domestically and globally. FactSet reports that the analyst community expects YoY revenue and earnings growth for the S&P 500 to be an impressive 5.5% and 11.7%, respectively. All sectors expected to be positive for both top and bottom lines, led by InfoTech, Comm Services, and Consumer Discretionary for revenue growth, and led by Healthcare, Communication Services, and InfoTech for earnings growth.
Quarter-by-quarter for Q1-Q4, the analyst community expects a steady increase in revenue growth of 4.4%, 5.2%, 5.3%, and 5.7%, respectively, and a more late-year loaded earnings growth of 6.6%, 10.7%, 9.0%, and 18.4%, respectively—presumably due to improving margins from falling production prices and rising productivity (note: economist Ed Yardeni calls productivity the “magic elixir”). The bottom-up consensus earnings expectations are for the S&P 500 to deliver approximately $233 of earnings per share in CY 2023, or roughly 5% growth from expected 2022 amounts.
Although last Friday’s jobs report appeared to show continued resilience in the jobs market and an unemployment rate of 3.7% (versus a Fed “red line” of 4.0%), prior months were revised down, total private hours worked ticked down, the labor participation rate fell (reversing its slow uptrend), and much of the jobs growth is in government. In fact, this seems to have become a monthly routine in which the BLS pulls forward jobs (as if to intentionally make the current release look better) then revises down those prints the next month. So, the Fed likely won’t take this report as the rosy picture the headline number suggests.
Also on Friday, the ISM Services Index (which had been the strong segment) weakened badly, and employment among service providers plunged 7.4 pps to 43.3, the lowest level since August 2009 (excluding the anomalous pandemic lockdowns). And finally, GSCPI ticked back down into negative territory (-0.15), making the prospects for a continued fall in CPI and PPI readings this week seem pretty good, which would support the Fed’s dovish pivot. This combo of a so-so jobs report and positive inflation indications from GSCPI contributed to Friday’s volatility in both stocks and bonds. Additional disinflationary pressures include ISM Manufacturing Index for the 14th straight month, new orders for 16 months, backlog of order for 15 months, and prices paid index for 8 straight months. Plus, there is the deflationary impulse from a struggling China economy as it desperately dumps consumer goods on the market at reduced prices to induce demand.
Hopefully, the need for ZIRP to support reasonable economic growth is permanently behind us. Certainly, the economy has proven more resilient than many expected in the face of a rapid rise in rates over the past two years. I think a fed funds neutral rate—which I think is around 2.5-3.0% nominal (i.e., 2% target inflation plus 0.5-1.0% r-star) versus 5.25-5.50% today. Such rates are desirable so that borrowers can handle the debt burden while fixed income investors can receive a reasonable real yield (above the inflation rate) so as not to have to take on undue risk to achieve a livable income.
Supply chains, inflation, and the yield curve:
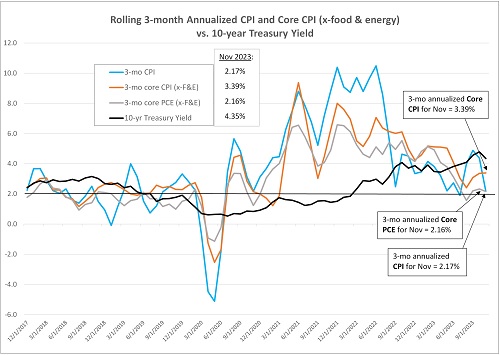
The PCE price deflator was reported on 12/22 and showed that prices decreased -0.1% MoM. As summarized by Briefing.com, “The key takeaway from the report is that it threads the needle for a Fed aiming to bring down inflation with higher rates, but not tank the economy in the process. The 0.3% month-over-month jump in real PCE combined with a 0.4% increase in real disposable personal income and the disinflation in the PCE Price Indexes is the stuff that soft landings/no landings are made of.” The Core PCE price index (excluding the volatile food & energy components—the Fed’s preferred measure of inflation) rose only +0.06% MoM in November and the 3-month rolling annualized average is up only +2.16%, as shown in the chart below. Core PCE hit its lowest mark since early 2021 and will probably come pretty close to the Fed’s 2% target by mid-year as high base effects roll off of the calculation, and we can expect some lag effects that are yet to show up.
This 3-month annualized Core PCE almost exactly matches the 3-month annualized average of the headline CPI number (+2.17), although the 3-month annualized Core CPI is 3.39%. But again, the Fed believes the composition of PCE more accurately reflects the impacts on consumers since it more quickly adapts to consumer choices through its weighting adjustments to individual items (e.g., shifts from pricier brands to discount brands). Also, while CPI narrowly considers only urban expenditures, PCE considers both urban and rural consumers as well as third-party purchases on behalf of a consumer, such as healthcare insurers buying prescription drugs. Also, items are weighted differently—for example, Shelter is the largest component of CPI at 32.9% but only 15.9% of PCE, and Healthcare is the largest component of PCE at 16.8% but only 7.0% of CPI. Regarding shelter, rent growth is slowing, and falling interest rates help make the important housing market more vibrant (as owners are more willing to sell and take on new mortgages elsewhere), so I think that’s a nuance influencing the Fed’s softening view on inflation trends.
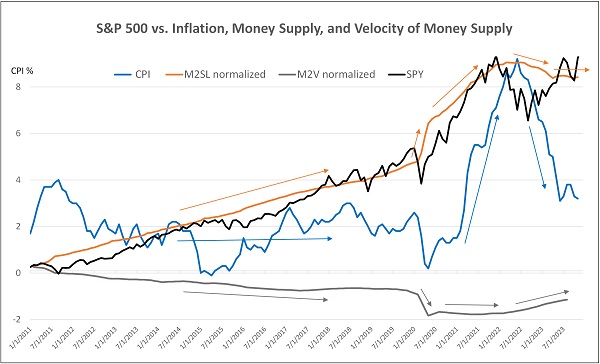
The chart below compares movements in the S&P 500, inflation, M2 money supply, and the velocity of money supply since 2011 and how rising or falling velocity has served to offset the impacts of high-growth or contraction in M2. There was a close correlation between rising money supply and rising equity prices (aka asset inflation) until M2 peaked. Since then, the S&P 500 has round-tripped lower and then higher, back to where it was two years ago. Meanwhile, CPI inflation seemed uncorrelated, oscillating in a trading range between 0-4% even while M2 rose, at least partly because velocity of M2 was falling, which largely offset the impact of M2 growth, even throughout the initial the pandemic response when M2 surged and velocity plunged. Much of the new money was simply going into bank reserves and personal savings and investments.
But when velocity stabilized while M2 continued to surge higher, inflation soon followed M2 higher. You can see that stocks peaked right around the same time that money supply peaked, and then inflation peaked shortly thereafter. As M2 has receded, velocity has increased, offsetting the negative effects of shrinking money supply so that stocks have recovered while inflation falls back towards its historical range. A return to modest money supply growth is appropriate for balancing both economic growth and inflation moderation. As economist Mark Skousen has opined, “the Fed needs to adopt Milton Friedman’s Monetarist Rule: Increase the money supply at a stable rate close to the long-term economic growth rate of 3-4% a year.”
A metric that gets less attention than I think it deserves is the New York Fed’s Global Supply Chain Pressure Index (GSCPI). The December reading was released last Friday, 1/5, and as I mentioned earlier, it suggests inflation will continue its gradual retreat, given it seems to have “permanently” returned to a reading near the long-run average. GSCPI measures the number of standard deviations from the historical average value (aka Z-score) and generally foreshadows movements in inflation metrics.

The chart suggests a solid directional correlation between GSCPI and inflation metrics (outside of the pandemic lockdown supply shock timeframe in 2020). It appears that movements, peaks, and troughs in GSCPI tend to precede and presage PPI, which in turn presages CPI, each with a slight lag. As shown, PPI, CPI, and GSCPI all surged when COVID lockdowns were instituted and M2 money supply surged, with GSCPI peaking in December 2021 at an all-time high of +4.31, followed by M2, PPI, and CPI a few months later. And all three plunged once supply chains rapidly recovered while monetary tightening made money supply crest and interest rates soar, leading to increased supply and lesser demand. As a result, GSCPI plummeted to a deeply negative May 2023 level of -1.57, and now it appears to be settling back into its normal historical range [±1 standard deviation around the zero line (right axis)], which bodes well for the next set of inflation reports.
Of course, even as supply chains continued to mend in 2023, the Israeli-Hamas war has created new impediments beyond the war in Ukraine. Rag-tag Houthi rebels have been attacking commercial vessels transiting the Red Sea, which typically sees over 10% of the world’s oil and 20% of container traffic. This threatens a surge in freight rates, and indeed, the Solactive Global Shipping Index hit its highest level since launching in 2015. Naval escorts and aggressive protection/retaliation are already in play. We’ll see how this impacts GSCPI in the ensuing months.
Nevertheless, I still believe inflation likely will continue to slide back toward the Fed’s 2% target as long as GSCPI remains at or below its historical average. However, there will be volatility, particularly as supply chains (encompassing manufacturing, transportation, logistics, energy, and labor) continue to sort out and realign. After all, the disinflationary secular trends have resumed, including globalization. Despite all you hear about “deglobalization” activities like onshoring, reshoring, and nearshoring, the law of comparative advantage remains alive and well, and changes we are seeing have been more in the way of "friend-shoring” and diversification of manufacturing.
By the way, on Monday 1/8, The Federal Reserve Bank of New York released its December 2023 Survey of Consumer Expectations (SCE), which shows that consumer inflation expectations declined in all time horizons. The 1-year look-ahead fell to 3% (which is the lowest level since January 2021), the 3-year fell to 2.6%, and the 5-year fell to 2.5%. The SCE is a national, internet-based survey of a rotating panel of 1,300 household heads constructed as to allow observation of changing expectations and behavior of the same individuals over time.
As for the longstanding yield curve inversion, the chart below shows the trend in the 2-10 Treasury spread. It has been gradually flattening, from a low of about -108 bps last July to -35 bps today. Interestingly, the economists at Alpine Macro believe that the inversion has merely reflected differing inflation expectations following the pandemic lockdowns and how long supply shocks might last, saying, “The short end of the breakeven curve was much higher than the long end between 2021 and the first of half of [2023], leading to a deeply inverted breakeven curve. Since this past July, the short end of the inflation breakeven curve has fallen decisively below the long end. Today, the 2-year breakeven rate is hovering around 1.8-1.9%, while the long end is at 2.2%, which is consistent with pre-pandemic levels. In other words, the breakeven [inflation] curve is largely renormalized.”
As I have predicted for a while, the Fed has finally indicated it will not wreck the economy in order to achieve their 2% core PCE target. It apparently sees the dangers ahead for borrowers (consumers, small businesses, and corporations), the banking sector, and a burgeoning credit crisis.
As pointed out by Real Investment Advice (RIA), one impact of the inverted yield curve has been a tightening in bank lending standards even as junk bond spreads versus Treasuries remain around historically low levels. RIA says the disconnect is due to the persistently inverted yield curve (since banks borrow at the short end and lend at the long end) and a loss of deposits (as depositors have fled to higher yielding money market funds) that reduces banks’ asset base and thus limits their flexibility to lend to the marginal borrower. On the other hand, investor capital flows freely into junk bonds due to the perceived soundness of the economy and the Fed’s stated willingness to support the economy with rate cuts.
Relative performance and equity valuations:
The table below compares 2023 total returns for a variety of ETFs representing various sectors, asset classes, styles, and market caps. while the S&P 500 (SPY) was up +26.2% for the year, the equal-weight S&P 500 (RSP) was up only +13.7%. The Grayscale Bitcoin Trust ETN (GBTC) was far-and-away the best performer—due to a combination of bitcoin’s growing use as a hedge against financial calamity, the impending approval by the SEC of bitcoin ETFs, and the convergence of the discount GBTC was trading at given its current exchange-traded note (ETN) structure. The only loser of significance was natural gas and the US Natural Gas Fund (UNG) at -64%. The US dollar was pretty much flat on the year. Also, long-term bonds (IEF and TLT) managed to finish the year in the green, largely due to a late-year recovery after selling off most of the year, which allowed the traditional 60/40 stock/bond portfolio allocation to make a big comeback.
During 2023, as the performance divergence of Tech stocks hit extremes, the ratio of index prices of the Nasdaq 100 to the Russell 2000 hit a high of about 8.25x that exceeded the dot-com mania. But as breadth improved markedly in the second half of the year, small caps and equal-weight indexes held their own. Notably, S&P 600 SmallCap (SPSM) was up +15.9% in 4Q23 alone (nearly equaling its total for the full year) versus +11.2% for SPY.
Although SPY finished the year almost exactly where it was two years prior, its aggregate P/E ratio fell over the same period (from 21.7x at the start of 2022 to this year’s 20.4x) due to improved earnings prospects, while the equal-weight RSP also fell from 17.7x two years ago to 16.8x today. Inverting the forward P/E implies an earnings yield of 4.9%. Add 1.4% dividend yield and you get 6.3% total yield. This compares favorably to today’s 10-year Treasury yield of about 4.0%. For RSP, the EY is 6.0% plus 1.6% DY for a total yield of 7.6%, which is even more favorable. For the quality-oriented small cap SPSM, it has a 6.8% EY (14.6x forward P/E) and 1.6% DY for a total yield of 8.4%.
So, outsized performance going forward for the Big Tech titans (including the MAG7) might be more difficult if it relies upon multiple expansion, so lower interest rates and solid earnings growth are key. It also suggests a potential for market rotation as investors typically seek stocks displaying strong growth and fair valuations (i.e., growth at a reasonable price, aka GARP) in a declining rate environment, perhaps looking to some of the neglected industries to find them. Assuming rates continue to decline and earnings (both actual and forecasted) hold up, valuation multiples may have room to expand.
Key risks:
Of course, Congress eventually will have to cut off its massive deficit spending spree. As First Trust has pointed out, our federal government spent over $6.1 trillion with a budget deficit of $1.7 trillion dollars in FY2023. Correcting for the bogus $333 billion “negative outlay” on Biden’s SCOTUS-rejected student loan forgiveness plan, government spending in FY2023 was about 4.0% of GDP. It should be evident to all that Modern Monetary Theory (MMT) is a fraud; debts and deficits cannot grow to the sky without fallout; we are running recessionary deficits in an expansionary economy and bull market; and all this recession-level spending in a growing economy (aka “good times”). Although reserve currency status might keep the US from going the way of Argentina, we still could go the way of China, with its rising youth unemployment, falling fertility rate, massive “house of cards” debt, mothballed factories, teetering economy, and risk of social implosion. Fiscal responsibility is an imperative.
But for now, our political elite just keeps kicking the can down the road for another generation to deal with. The “critical spending” they implore has amounted to printing money to subsidize selected industries, support multiple foreign wars, provide sustenance to the hordes of new migrants, and for politicians to earn political points back home to address contentious, hot-button issues like homelessness, migrant resettlement, poverty, racism, drug abuse, decaying infrastructure, climate change, vaccine development, pronoun enforcement, DEI programs, and so forth.
However, a key risk is that our spiraling federal debt (now over $34 trillion) creates the potential for an oversupply of Treasury issuance that overwhelms public demand and spikes nominal interest rates, locking in high real rates (as inflation continues to fall) that balloon our federal debt service to an alarming proportion of tax revenues and stifle an economy already facing a recession-flashing LEI (The Conference Board Leading Economic Indicators Index), a weakening labor market, and decelerating consumer spending.
As other key risks in 2024 might entail:
1. Escalation in hot wars around the world—perpetrated by the likes of Russia upon Ukraine and Iran and its proxies (e.g., Hamas, Hezbollah, Palestinian Islamic Jihad, Yemen Houthi, etc.) upon Israel (and on international shipping).
2. Nascent threats and aggressions from China (upon Taiwan), North Korea (upon its neighbors), and most recently Venezuela (making historical claims on Guyana).
3. Potential terrorist strike in the US, worsened by our porous southern border and migrant crisis.
4. A rancorous election season that threatens to tear the country apart—with politicians and media preferring to feed the anger and resentment, gaslight the populace into emotional decisions, and interfere with the election, rather than seeking to unify us as Americans and simply let us vote how we wish based on policies and earnest debate. Given the maniacal, no-holds-barred tactics being used to keep Trump off the ballot this election year, things could really get ugly come November, no matter which side wins.
Final thoughts:
As for what the future holds for stocks, I tend to fall more into economist Ed Yardeni’s camp, including his views about “rolling recessions” starting in 2022 having morphed into rolling recoveries in 2023, and a new “Roaring 20’s” bull market—similar to its namesake from 100 years ago—that will continue to broaden and thrive for at least the next couple of years and perhaps for the full decade. He opines that perhaps the Fed hasn’t been tightening monetary policy so much as normalizing it from an abnormal ZIRP era stemming from the Financial Crisis. This theory implies that the Fed might not lower interest rates next year as much as widely expected, assuming the economy remains resilient while inflation continues to fall toward the 2.0% target, both of which he fully expects to occur. Seems plausible.
Regardless, I choose not to fight the Fed as it now seems to be focused on preventing a recession despite its previous singular focus on inflation. Still, I expect inflation will continue its gradual (albeit somewhat volatile) decline—even with the Fed apparently committed to positive GDP growth—particularly given stagnant money supply growth, mended supply chains, falling or stabilizing home prices and rents, slowing wage inflation, slower consumer spending on goods, and a deflationary impulse from China (note that US imports from China are down 25% YTD versus last year). This eventually will give the Fed license to cut rates—perhaps in early 2024 (or possibly sooner)—and hopefully get money supply rising again, both to head off crises in banking and housing and to mitigate growing strains on businesses, consumers, and our heavily leveraged trading partners.
Notably, as Technology stocks drove the ratio of Nasdaq 100 index value versus Russell 2000 index value in mid-2023 to an extreme of 8.25x, which was even higher than the late-1990’s dot-com peak, it seemed to be an ominous warning sign. However, although the divergence created an investment opportunity for a rotation and broadening, we should keep in mind the stark difference between today’s Tech juggernauts with their pristine balance sheets, cash stores, and wide business “moats,” versus their much more speculative nature in 2001.
Similarities to that prior era include the huge FOMO tailwind from a game-changing new technology. Back then of course it was primarily the nascent Internet, and today it is AI/ML (along with blockchain/DLTs and quantum computing). I agree that in both timeframes, investors became perhaps overeager on the promise of new technologies well before the returns rolled in. But the biggest differences between now and then include: 1) most of today’s leaders in the new technologies are largely mature cash-flush giants with strong fundamentals and cash flows rather than speculative cash-burners, and 2) the late-90’s bull market was also driven by the Y2K capex surge, which brought forward a lot of spending on equipment upgrades but then fell off a cliff when nothing bad happened on 1/1/2000.
Furthermore, the long-term outlook is bright and accelerating rapidly for so many technologies, including AI/ML, Web 3.0, blockchain, digital ledger technologies (DLTs), cryptocurrencies, decentralized finance (DeFi), financial technology (Fintech), quantum computing, metaverse, space exploration (including tourism and asteroid mining), 5G, IoT, Big Data, cloud computing, digitization, video conferencing, augmented/virtual reality (AR/VR), computer vision (CV), gaming, networks, sensors, 3-D printing, robotics, cybersecurity, nanotech, telehealth, precision medicine, genomics, computational biology, biologics, alternative energy (e.g., nuclear, solar, wind, hydrogen, biomass), electric vehicles, aerospace, data storage, cloud data centers, revival of high-tech manufacturing (especially semiconductors). All are rapidly changing the world as we know it.
Of course, AI has been the highest profile driver of the stock market this year, and there is a frantic race around the world among both private enterprises and governments to be the first to achieve key milestones. The problem is, we don’t currently have the infrastructure to produce and deliver the huge power requirements for AI chips—and clean energy initiatives today are not likely to fulfill those requirements in time. Instead, I believe the answer likely must lie in nuclear fusion, which is closer than ever to becoming a reality—and a major boost to the prospect of a world that enjoys 100% clean, abundant energy. Nuclear fusion has no emissions, radioactive waste, or risk of disaster that nuclear fission carries. Amazing stuff. Satisfies the dream of both climate change activists and hard-core deniers alike. Perhaps that will be the technology of the 2030’s.
Lastly, as for our new product called Sabrient SmartSheets—one for individual stocks and one for ETFs, we have expanded the content to include Top 30 lists for each of a variety of our potent quantitative scores. Notably, we have further enhancements in the pipeline to help investors and advisors with stock search, fundamental screening, idea generation, risk monitoring, and confirmation. These sheets are posted weekly in Excel format and show how your stocks and ETFs score in our various alpha factors…or for identifying the top-ranked stocks and ETFs for each alpha factor (or for weighted combinations of the factors). Please check them out and share your feedback with me!
Latest Sector Rankings:
Relative sector rankings are based on our proprietary SectorCast model, which builds a composite profile of each of over 1,000 equity ETFs based on bottom-up aggregate scoring of the constituent stocks. The Outlook Score is a Growth at a Reasonable Price (GARP) model that employs a forward-looking, fundamentals-based multifactor algorithm considering forward valuation, historical and projected earnings growth, the dynamics of Wall Street analysts’ consensus earnings estimates and recent revisions (up or down), quality and sustainability of reported earnings, and various return ratios. It helps us predict relative performance over the next 3-6 months.
In addition, SectorCast computes a Bull Score and Bear Score for each ETF based on recent price behavior of the constituent stocks on particularly strong and weak market days. A high Bull score indicates that stocks within the ETF recently have tended toward relative outperformance when the market is strong, while a high Bear score indicates that stocks within the ETF have tended to hold up relatively well (i.e., safe havens) when the market is weak. Outlook score is forward-looking while Bull and Bear are backward-looking.
As a group, these three scores can be helpful for positioning a portfolio for a given set of anticipated market conditions. Of course, each ETF holds a unique portfolio of stocks and position weights, so the sectors represented will score differently depending upon which set of ETFs is used. We use the iShares that represent the ten major U.S. business sectors: Financials (IYF), Technology (IYW), Industrials (IYJ), Healthcare (IYH), Consumer Staples (IYK), Consumer Discretionary (IYC), Energy (IYE), Basic Materials (IYM), Telecommunications (IYZ), and Utilities (IDU). Whereas the Select Sector SPDRs only contain stocks from the S&P 500 large cap index, I prefer the iShares for their larger universe and broader diversity.
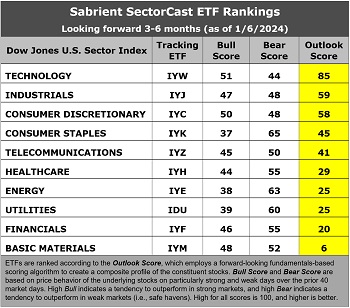
The latest fundamentals-based Outlook rankings continue to display a bullish bias given the predominance of economically sensitive and cyclical sectors at the top. Despite a high forward P/E (26.5x), Technology (IYW) takes the top spot with an Outlook Score of 85, given its strong EPS growth estimates (16.4%), improving earnings revisions from the analyst community, solid return ratios, and strong insider sentiment (open market buying).
Then, there’s a big drop-off to Industrials (IYJ) at 59 and Consumer Discretionary (IYC) at 58. Those 3 are the only ones of the 10 that score above 50, which is somewhat concerning. Consumer Staples (IYK) at 45 and Telecommunications (IYZ) at 41 round out the top 5. There is then another drop-off to Healthcare (IYH) at 29. Although Consumer Staples is normally considered to be defensive, the inordinate selloff in defensive sectors last year has set it up as a “rebound sector.” On the other hand, “deep cyclical” sectors Energy (IYE) and Basic Materials (IYM) sit in the lower tier, along with Utilities (IDU) and Financials (IYF). Notably, prices in the Financials (IYF) sector have recovered significantly, which has stunted its rise in the SectorCast rankings.
Also notable is that the cyclical Energy sector displays the lowest Bull scores and one of the highest Bear scores. Low Bull and high Bear score is usually reflective of a defensive sector, but in this case, I believe it reflects current investor sentiment about the impact of rising oil prices on a fragile economy, i.e., helpful to Energy stocks’ earnings outlook but negative for the broader market (like a quasi-tax and inflationary). Similarly, negative earnings revisions for Basic Materials actually serves to reduce producer prices and inflation.
Keep in mind, the Outlook Rank does not include timing, momentum, or relative strength factors, but rather reflects the consensus fundamental expectations at a given point in time for individual stocks, aggregated by sector.
ETF Trading Ideas:
Our rules-based Sector Rotation model, which appropriately weights Outlook, Bull, and Bear scores in accordance with the overall market’s prevailing trend (bullish, neutral, or defensive, maintains its bullish bias. The model suggests holding Technology (IYW), Consumer Discretionary (IYC), and Industrials (IYJ), in that order. (Note: In this model, we consider the bias to be bullish from a rules-based trend-following standpoint when SPY is above both its 50-day and 200-day simple moving averages, but neutral if it is between those SMAs while searching for direction, and defensive if below both SMAs.)
If you prefer a neutral bias, the Sector Rotation model suggests the exact same trio but in a slightly different order: Technology, Industrials, and Consumer Discretionary. Or, if you prefer to take a defensive stance on the market, the model suggests holding Consumer Staples (IYK), Energy (IYE), and Utilities (IDU), in that order.
An assortment of other interesting ETFs that are scoring well in our latest rankings include: Invesco Building & Construction (PKB), ETFMG Travel Tech (AWAY), PGIM Jennison International Opportunities (PJIO), Invesco Dorsey Wright Consumer Cyclical Momentum (PEZ), First Trust International Opportunities (FPXI), Fidelity Disruptive Technology (FDTX), Pinnacle Focused Opportunities (FCUS), Invesco Dorsey Wright Technology Momentum (PTF), Global X Social Media (SOCL), Global X Metaverse (VR), Putnam BDC Income (PBDC), Valkyrie Bitcoin Miners (WGMI), iShares Expanded Tech Sector (IGM), Invesco Gen Media and Gaming (GGME), Innovator IBD 50 (FFTY), PGIM Jennison Better Future (PJBF), AdvisorShares Vice (VICE), VanEck Semiconductor (SMH), Direxion Work From Home (WFH), IQ Winslow Large Cap Growth (IWLG), Invesco S&P SmallCap Momentum (XSMO), AOT Growth and Innovation (AOTG), Clough Select Equity (CBSE), and SoFi Web 3 (TWEB). All score in the top decile (90-100) of Outlook scores. There is a notably international flavor to our latest rankings.
As always, I welcome your thoughts on this article! Please email me anytime. Any and all feedback is appreciated! In particular, tell me what sections you find the most valuable—commentary, chart analysis, SectorCast scores, or ETF trading ideas / sector rotation model. Also, please let me know of your interest in:
1. a Sabrient index for TAMP or ETF investing
2. the new Sabrient SmartSheets to our full rankings of stocks and ETFs
3. having me speak at your event
IMPORTANT NOTE: I post this information periodically as a free look inside some of our institutional research and as a source of some trading ideas for your own further investigation. It is not intended to be traded directly as a rules-based strategy in a real money portfolio. I am simply showing what a sector rotation model might suggest if a given portfolio was due for a rebalance, and I do not update the information on a regular schedule or on technical triggers. There are many ways for a client to trade such a strategy, including monthly or quarterly rebalancing, perhaps with interim adjustments to the bullish/neutral/defensive bias when warranted, but not necessarily on the days that I happen to post this article. The enhanced strategy seeks higher returns by employing individual stocks (or stock options) that are also highly ranked, but this introduces greater risks and volatility. I do not track performance of the ideas mentioned here as a managed portfolio.
Disclosure: At the time of this writing, of the securities mentioned, the author held positions in SPY, QQQ, TLT, and NVDA.
Disclaimer: Opinions expressed are the author’s alone and do not necessarily reflect the views of Sabrient. This newsletter is published solely for informational purposes and is not to be construed as advice or a recommendation to specific individuals. Individuals should take into account their personal financial circumstances in acting on any opinions, commentary, rankings, or stock selections provided by Sabrient Systems or its wholly owned subsidiary, Gradient Analytics. Sabrient makes no representations that the techniques used in its rankings or analysis will result in or guarantee profits in trading. Trading involves risk, including possible loss of principal and other losses, and past performance is no indication of future results.