Sector Detector: Ducks are lining up for FOMC restraint and continued market strength
 by Scott Martindale
President & CEO, Sabrient Systems LLC
The New York Fed’s Global Supply Chain Pressure Index (GSCPI) for November was released today, and although it rose more than expected (likely due to disruptions from heightened global hostilities), it still suggests inflation will continue its gradual retreat, with a reading near the long-run average. But let me start by talking about October’s inflation indicators. Last week, the headline reading for Personal Consumption Expenditures (PCE) for October came in at 3.0% YoY, helped quite a bit by the fall in oil and gasoline prices (note: the US is producing an all-time high of 13.2 million barrels/day of crude oil). Core PCE, which is the Federal Reserve's preferred inflation metric, came in at 3.46% year-over-year. However, the month-over-month number for October versus September, which better reflects today's inflation trends and the lag effects of higher interest rates, came in at 0.16%, which annualizes to 1.98%. Keep in mind, the Fed's inflation target is 2.0%. But monthly data can be choppy, so looking at the rolling 3-month average, it annualizes to 2.37%.
Earlier reports had shown October PPI at 1.3% YoY and CPI at 3.2%, with core PPI (excluding food & energy) was 2.4% YoY, and core CPI was 4.0%. All of this was presaged by the GSCPI, which measures the number of standard deviations from the historical average value (aka Z-score) and generally foreshadows movements in inflation metrics. It plummeted from a December 2021 all-time high of +4.31 down to the October reading of -1.74—its lowest level ever. However, that ultra-low October reading has been revised to -0.39 due to “a change in exchange rate weighting methodology,” according to the New York Fed. Nevertheless, the writing was on the wall for last week’s favorable PCE report. The chart below illustrates the correlation between GSCPI, PPI, and CPI.
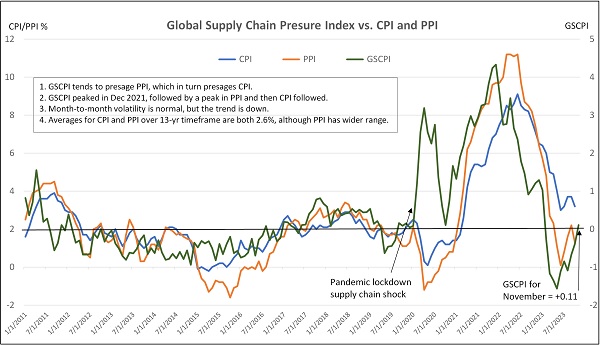
So, what to expect for November inflation? Well, as shown in the chart, GSCPI for November just came in today at 0.11. Although rising from its ultra-low levels, it still remains at the long-run average, and the chart illustrates that volatility is to be expected. All in all, I think it still bodes well for the next week’s CPI/PPI readings as supply chains continue to heal and diversify (albeit with occasional hiccups like we see today from heightened global hostilities), especially when you also consider that the consumer has become stretched with rising household debt and falling growth in job openings and wages, money supply growth is stagnant, and budget hawks are increasingly flexing their fiscal muscles in Congress. Thus, I believe the probability of a resurgence in either inflation or fiscal expansion is quite low.
Furthermore, although the second estimate for Q3 GDP was ultra-strong (the highest in 2 years), revised up to 5.2% annual rate (from previous 4.9%), the boost came from state and federal government spending, which was revised up to 5.5% from the prior estimate of 4.6% (i.e., more unsustainable deficit spending and issuance of Treasuries paying high coupons, mostly from an 8.2% increase in defense spending), while personal consumption was revised down to 3.6% from 4.0%. This tells me the “robust” GDP number was something of an illusion.
Indeed, looking ahead, the Atlanta Fed’s GDPNow forecasts only 1.3% GDP growth and 1.9% PCE growth for Q4 (as of 12/6). Moreover, the good folks at Real Investment Advice observed that Gross Domestic Income (GDI) for Q3 was reported at only +1.5%, displaying the widest gap below GDP in 50 years. (Note: GDP measures the value of goods and services produced, including consumption expenditures, investments and exports, while GDI measures incomes earned and costs incurred in production of GDP, including wages, profits, and taxes.) Also, last week’s Fed Beige Book showed that two-thirds of Fed districts reported slower economic activity over the prior six weeks, and the ISM Manufacturing Index came in at an anemic 46.7, showing continued contraction for the 15th straight month.
So, this all seems to be more “bad news is good news” when it comes to Fed policy moves, and investors will be eagerly watching Friday’s jobs report followed by next week’s CPI, PPI, and FOMC policy announcement. Stocks have been taking a healthy breather and consolidation in anticipation of it all, but so far, no major pullback. This year seems to be following the playbook of what economist Ed Yardeni has characterized as a series of “rolling recessions” (among sectors) and an “Immaculate Disinflation,” i.e., moderating inflation without a harsh recession or massive layoffs. As an aside, I have opined many times that it is ridiculous that we constantly find ourselves awaiting the edict of this unelected board of “wise elders” to decide our economic fate. Why can’t they take emergency measures only when absolutely necessary to avert economic cataclysm, and then once the crisis has passed, those emergency measures are quickly withdrawn so that the free market can get back to doing its productive, creative, wonderful thing? One can dream.
Regardless, in my view, the Fed is likely done with rate hikes and preparing for its eventual pivot to rate cuts—which I think will come sooner than most expect, likely before the end of H1 2024. Why? Because if inflation maintains its gradual downtrend while the Fed holds its overnight borrowing rate steady, the real (inflation-adjusted) rate keeps rising, i.e., de facto tightening. Indeed, Fed funds futures are projecting 98% chance for no rate change next week, and for 2024, 62% chance for at least one 25-bp rate cut by March, 97% for at least one 25-bp cut by June, and 89% chance of a full 1.0% in total rate cuts by December 2024, which would put the fed funds rate below 4.5%.
Accordingly, after kissing the 5% handle, the 10-year Treasury yield has fallen precipitously to below 4.2%—a level last seen at the end of August. So, I encourage and expect the FOMC to follow the message of the bond market and begin cutting the fed funds rate back towards the neutral rate, which I think is around 2.5-3.0% nominal (i.e., 2% target inflation plus 0.5-1.0% r-star), and hand back control of the economy to the free market. As of now, the Fed is on the verge of crushing the housing market…and by extension the broader economy. In addition, it must ensure money supply resumes a modest growth rate (albeit slowly), not continue to shrink or stagnate.
To be sure, the safe steadiness of bond yields was disrupted this year. After rising much faster than anyone anticipated, interest rates have fallen much faster than expected, especially considering that the Fed hasn’t made any dovish policy changes. Nevertheless, if rates are going to generally meander lower, investors might be expected to lock in sustainable yield with capital appreciation potential through longer-duration securities, including long-term bonds, “bond proxies” like dividend-paying equities (e.g., utilities, staples, and REITs), and growth stocks (like high-quality technology companies).
I also like oil, gold and uranium stocks, as well as gold, silver, and cryptocurrency as stores of value in an uncertain macro climate. Notably, gold is challenging its highs of the past few years as global investors and central banks are both hedging and/or speculating on a weaker dollar, falling real interest rates, rising geopolitical tensions, and potential financial crisis, and the World Gold Council reported robust demand among central banks, which purchased a record 800 tons during the first three quarters of the year. Similarly, Bitcoin is catching a bid on speculation of broader investor access (through spot-price ETFs) and dollar debasement (if debt and deficit spending continue to spiral).
Keep in mind that, when valuations get lofty within a given asset class, volatility and performance/valuation dispersion among stocks often increases while correlations decrease. For stocks, active selection strategies that can exploit the dispersion to identify under-the-radar and undervalued companies primed for explosive growth become more appealing versus passive index investing. Sabrient’s actively selected portfolios include the Q4 2023 Baker’s Dozen (launched on 10/20), Small Cap Growth 40 (launched on 11/3), and Sabrient Dividend 46 (just launched on 11/29, and today offers a 4.7% dividend yield).
In today’s post, I further discuss inflation, the US dollar, Fed monetary policy implications, and relative performance of asset classes. I also discuss Sabrient’s latest fundamentals based SectorCast quantitative rankings of the ten U.S. business sectors (which is topped by Technology and Industrials), current positioning of our sector rotation model (which turned bullish in early November and remains so), and some actionable ETF trading ideas.
Click here to continue reading my full commentary … or if you prefer, here is a link to this post in printable PDF format (as some of my readers have requested).
Market commentary:
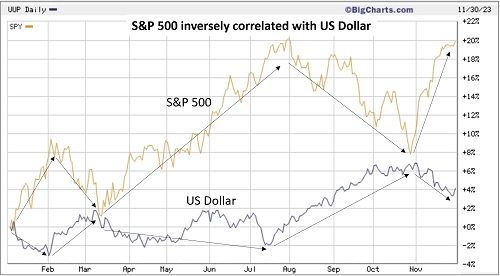
While stocks and bonds both surged in November, the US dollar fell about 3% to its lowest level in 3 months in anticipation of those rate cuts. The chart below illustrates this year’s inverse correlation between the S&P 500 (SPY) and the US dollar [using Invesco DB US Dollar Index Bullish Fund (UUP)], year-to-date through November. You can see that whenever the dollar has weakened, SPY has risen, and vice versa, although both are still higher on the year. The dollar just hit a three-month low while Treasury yields continue to slide as investors have become increasingly confident that the US Federal Reserve will start cutting rates by mid-2024.
As for the status of market breadth, we all know that the “Magnificent Seven” (MAG7) dominated early in the year on AI euphoria, but since June 1, breath began to improve. The three charts below illustrate the influence of interest rates and the MAG7 (which dominate the cap-weighted indexes) by comparing relative 2023 performance of cap-weight, equal-weight, small caps, dividend payers, and the 10-year Treasury Note using the following ETFs: Nasdaq 100 (QQQ), Direxion Equal-Weight Nasdaq 100 (QQQE), SPDR S&P 500 (SPY), Invesco Equal-Weight S&P 500 (RSP), Russell 2000 Small Caps (IWM), SPDR S&P 500 High Dividend (SPYD), and iShares 20+ Year Treasury Bond (TLT).
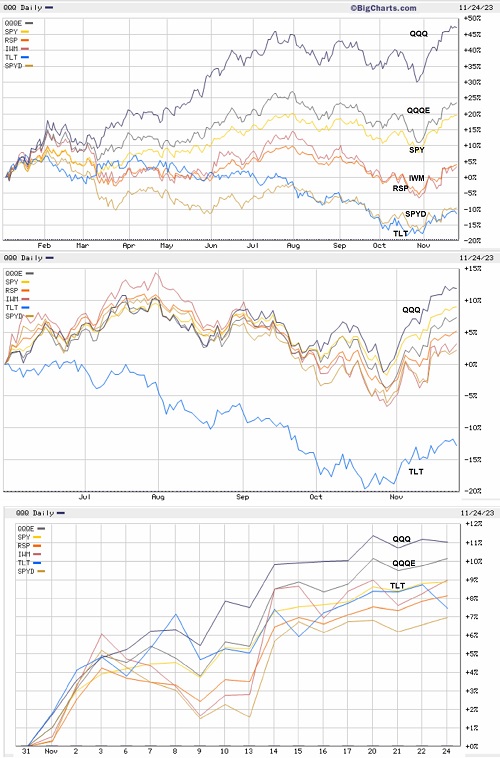
The top chart shows the extreme outperformance YTD of QQQ (dominated by the MAG7). During the first half of the year, TLT was essentially flat, reflecting a stable 10-yr yield, which supported the rally in stocks. But starting June 1, as shown in the middle chart, stock market breadth improved markedly while stocks essentially went sideways. And then as bonds and TLT accelerated their decline (and the 10-year yield approached 5%), stocks also fell through October. But with inflation and jobs reports signaling the lag effects of hawkish Fed policy and the potential for an end to rate hikes, the 10-year yield quickly reversed in November, and TLT rallied along with stocks, as shown in the bottom chart. They all became overbought on a technical basis, but should continue to rally after the current consolidation and/or corrective pullback, in my view.
As a result, for November it was as if investors were surprised and left scrambling to get in on the action, in a fit of FOMO (fear of missing out), with the S&P 500 closed the month up +9% while the Nasdaq jumped nearly +11%, the indexes' best monthly gains since July 2022. The broad rally also included market segments that had lagged throughout 2023 such as small caps (IWM), which rose about +9% on the month. The Dow at +9% displayed its best monthly performance since October 2022. Top sectors included Real Estate (XLRE) and Technology (XLK), which gained more than +12% each, while Financials (XLF) and Consumer Discretionary (XLY) rose more than +10%. As for the bonds, the long-term TLT also was up +10%.
As for valuations, of course, falling interest rates support higher equity valuations and multiple expansion. Forward P/E has risen on the S&P 500 (SPY) to 19.2x, which implies an earnings yield of 5.2%. Add 1.5% dividend yield and you get 6.7% total yield. Compare both numbers to today’s 10-year Treasury yield under 4.2%. For the Nasdaq 100 (QQQ), forward P/E is 23.9x (EY of 4.2%), while the equal-weight S&P 500 (RSP) is at 15.8x (EY of 6.3%) and the quality-oriented S&P 600 SmallCap (SPSM) at only 13.1x (EY of 7.6%). Outsized gains going forward for the Big Tech titans (including the “Magnificent Seven”) might be more difficult if it relies upon multiple expansion, so lower interest rates and solid earnings growth are key.
So, bullish conditions abound, with earnings forecasts for 2024 stable (FactSet: $246.30/share for S&P 500), bond credit spreads at YTD lows, interest rates falling, and “animal spirits” returning to investors’ collective psyche, setting up what I expect to be a positive 2024. I have been saying this rally has legs, although it needed to take a short breather after such a rapid surge. After all, in the course of a month, stocks ran from the depths of despair, with the S&P 500 (SPY) losing support at its important 200-day moving average (and threatening to fall through its 300-day moving average as well), all the way up to challenge its July high, well above all moving averages, but still remains about -10% below its all-time high of about 480 from the end of 2021.
Notably, despite the market consolidation/pullback this week, the CBOE Volatility Index (VIX) just hit a post-pandemic low below 13. Investors apparently are confident that rates will indeed stabilize/decline and stocks will continue to rally. Even Michael Burry of “The Big Short” fame reportedly closed his latest big short on the stock market (specifically, a massive position in SPY, QQQ, and SMH put options), and booked an estimated 40% loss.
But here’s the rub. When stocks and bonds fall (and yields rise), it creates a de facto monetary tightening effect, making it less necessary for the Fed to overtly tighten. On the other hand, the “wealth effect” created by rising stocks and bonds has had the side effect of easing financial conditions and increasing consumer buying power, which counteracts the suppression of demand the Fed has been (successfully) trying to institute.
Inflation, interest rates, the 60/40 portfolio, and Fed policy:
As part of the Fed’s dual mandate, it also closely monitors the jobs market. Although job openings are falling and the labor participation rate has crept back up to pre-pandemic levels at 62.7%, labor demand still far exceeds the supply of available workers. US labor productivity for Q3 was recently updated to an annualized rate of 4.7%, driven by both greater hours work and increased output per hour. Excluding the anomalous post-pandemic recovery, it was the largest gain since 2009 (emerging from the Financial Crisis). Subtracting this number from the annualized 3.9% increase in hourly compensation implies that unit labor costs fell 0.8%, which helped boost the strong corporate profit margins for the S&P 500 from 11.6% in Q2 to 12.2% in Q3 (according to FactSet). And according to BMO, strategists expect profit margins to stay high, which could help amplify earnings growth even with modest revenue growth.
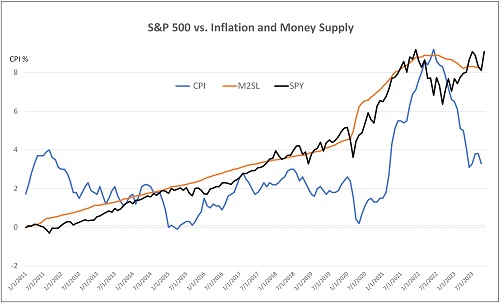
As for money supply, economist Mark Skousen reminds us of Milton Friedman’s Monetarist Rule, i.e., to “increase the money supply at a stable rate close to the long-term economic growth rate of 3-4% a year.” Instead, the Fed is so fearful of a resurgence in inflation that it is keeping money supply stagnant (actually, declining slowly), which creates higher odds of a recession. Thus, the Fed is perpetuating an easy-tight, boom-bust cycle. Similarly, Jeremy Siegel of WisdomTree recently appeared warned about stagnating money supply and commercial bank deposits. Both peaked early 2022. The saving grace has been the uptrend in velocity of money stock, i.e., the rate at which a given dollar changes hands in a given year. Although not yet back to pre-pandemic levels, it has been in a steady uptrend for the past two years. The chart below shows the historical correlations between M2SL money supply, CPI inflation, and the S&P 500.
Assuming jobs growth, inflation, and interest rates continue to retreat, both stocks and bonds have further near-term upside potential, including a resurrection in defensive dividend-paying stocks. In fact, the traditional 60/40 stock/bond portfolio came back from the dead this year, with a YTD return through November of about 14% (for a combined S&P 500 and 10-yr Treasury portfolio), according to BofA, despite extreme weakness in Treasuries for most of the year, and November reflected the best monthly return for 60/40 in 30 years. Of course, 2022 was one of the worst years ever for the 60/40 portfolio, providing the lowest return since 2008 which in turn was the worst year since 1974. But it’s worth noting that in the two years following 2008 and 1974, the 60/40 returns were quite good, which perhaps bodes well for it in 2024 as well.
Regarding housing, although many homeowners are holding onto their low-rate mortgages, the housing market is losing its dynamism due to low inventory, high mortgage rates, and crashing sales (for both new and existing homes). An article in the Economist last week asserts that it is now cheaper to rent than to buy. The consumer is in growing more indebted as are many struggling companies (not to mention our federal government which has $34 trillion national debt growing at a $3 billion/day covered by sales of Treasuries), with debt carry costs increasing fast as debt matures and must be rolled over and much higher rates (and the annual debt service on our federal debt has now surpassed $1 trillion/year, or more than $3,000/person/year). The Fed appears worried that the lag effects of their rapid escalation in interest rates are now coming to roost in a harmful way. So, I expect the Fed to continue to soften its hawkish tone and likely begin cutting rates sooner than many expect.
Notably, the SPDR S&P Homebuilders ETF (XHB) has been correlated with TLT over the past few months as falling interest rates have brought on investor speculation for an imminent improvement in new home sales—although this is not yet reflected in the sell-side analyst estimates and Sabrient’s SectorCast model.
Over the past 5 years, money market funds have doubled from about $3 trillion to nearly $6 trillion, of which about 40% is retail and 60% institutional investors, due to the roughly 5% highly liquid and risk-free yields they offer. As money market rates fall, much of this immense pile of capital will be searching for higher returns, perhaps adding fuel to the bull market, even if the government’s profligate fiscal spending is successfully suppressed by newly emboldened budget-conscious politicians.
By the way, lower borrowing rates also mean companies and consumers may be enticed to take on more debt. And although this likely will become a problem eventually, in the near term it would lead to more spending and growth.
Final thoughts:
Ongoing strength in stocks depends on falling interest rates and steady earnings. So, Fed policy is a big wild card. I've been saying they are too tight. Lag effects are popping up fast now. Indeed, with inflation falling and nominal rates steady, real interest rates are rising, which is good for savers but hard on borrowers—including a highly indebted global economy and US federal government. Deflation is a real possibility. We are already seeing it in some major trading partners like China and Germany—with a particularly strong deflationary impulse from China due to its economic malaise and dumping of consumer goods at low prices to shore up its manufacturing as its domestic demand contracts. Rate cuts may come sooner than many expect. Tighter financial conditions, the slowdown in manufacturing, and declining savings rates all work against economic growth.
Regardless, disinflationary secular trends have resumed, despite some “deglobalization (e.g., onshoring, reshoring, nearshoring, and "friend-shoring”), as jobs and wage growth slows, money supply falls (now down -4.51% from its all-time high in July 2022), the fed funds rate remains restrictive, and lag effects from elevated rates reveal themselves more rapidly, and the fiscal stimulus boost is diminishing. You know what I mean—all that extra deficit spending to artificially increase demand during and after the pandemic as well as to subsidize selected industries, support foreign wars, provide sustenance to the throngs of new migrants, and address things like homelessness, drug abuse, poverty, decaying infrastructure, vaccine development, climate change, white supremacy, and DEI programs. Much like Argentina, such massive intervention in the free market also spiked inflation and grew the wealth gap to historic proportions—with most of the new money, power, and privilege going to those who already possess those things. But I digress.
I should also mention that Moody's just cut its outlook for China's credit to negative. Much has been written (including by me) about China’s growing problems with runaway debt and slowing growth. After averaging 10% a year from 1980 to 2012, the IMF forecasts just an average of 3.9% over the next five years. The so-called China Miracle created so much advanced but ultimately idle infrastructure by leveraging massive debt well beyond its healthy trade surplus to achieve target GDP growth rates. Much of the debt is in real danger of default such that the IMF has deemed 30% of local government debt as nonviable, while the country also faces a structural decline in demand due to a shrinking population and essentially no immigration. And yet China continues to saber-rattle about Taiwan and cozy up to the likes of Russia, Iran, and North Korea.
But there is hope for averting WW3, global depression, and currency debasement. Eric Peters of One River Asset Management wrote this profound observation/hope in this week’s “wknd notes” newsletter: “With the West increasingly intent to disengage economically and with over 20% youth unemployment, sluggish growth, and a stock market at 4-year lows, it would be in Beijing’s interest to seek peace and stability. The prosperous nations of the Middle East seek peace and stability as they determinedly drive to diversify their economies away from oil and gas. And it’s not inconceivable that we are approaching an end to the conflict in Ukraine, having accomplished little more than untold suffering. Take those three conflicts off the table, focus humanity’s efforts on our battle with nature, perhaps throw in some productivity gains due to AI, and you have the makings for an increasingly prosperous world. Let’s hope this is what the market in its infinite wisdom sees, rather than the recent rise in asset prices being little more than hopes for a Fed pivot.”
As a reminder, many market commentators expect mean reversion in the large/small valuation divergence and suggest increased small cap exposure. To that end, the new Sabrient Small Cap Growth (SCG 40) portfolio provides an alpha-seeking alternative to the passive Russell 2000 index (IWM) for gaining such exposure. In addition, Q4 2023 Baker’s Dozen holds a small/mid-cap bias relative to the SPY benchmark (4/5/4 in large/mid/small cap holdings) and offers potential “rocket fuel” for outsized gains, and as dividend strategies gain traction again, the Sabrient Dividend 46 portfolio seems like a good bet as it seeks both capital appreciation and reliable income—offering a current yield of 4.7%.
Lastly, as for our new product called Sabrient SmartSheets—one for individual stocks and one for ETFs, we have expanded the content to include Top 30 lists for each of a variety of our potent quantitative scores. These sheets are posted weekly in Excel format and show how your stocks and ETFs score in our various alpha factors…or for identifying the top-ranked stocks and ETFs for each alpha factor (or for weighted combinations of the factors). Please check them out and share your feedback with me!
Latest Sector Rankings:
Relative sector rankings are based on our proprietary SectorCast model, which builds a composite profile of each of over 1,000 equity ETFs based on bottom-up aggregate scoring of the constituent stocks. The Outlook Score is a Growth at a Reasonable Price (GARP) model that employs a forward-looking, fundamentals-based multifactor algorithm considering forward valuation, historical and projected earnings growth, the dynamics of Wall Street analysts’ consensus earnings estimates and recent revisions (up or down), quality and sustainability of reported earnings, and various return ratios. It helps us predict relative performance over the next 3-6 months.
In addition, SectorCast computes a Bull Score and Bear Score for each ETF based on recent price behavior of the constituent stocks on particularly strong and weak market days. A high Bull score indicates that stocks within the ETF recently have tended toward relative outperformance when the market is strong, while a high Bear score indicates that stocks within the ETF have tended to hold up relatively well (i.e., safe havens) when the market is weak. Outlook score is forward-looking while Bull and Bear are backward-looking.
As a group, these three scores can be helpful for positioning a portfolio for a given set of anticipated market conditions. Of course, each ETF holds a unique portfolio of stocks and position weights, so the sectors represented will score differently depending upon which set of ETFs is used. We use the iShares that represent the ten major U.S. business sectors: Financials (IYF), Technology (IYW), Industrials (IYJ), Healthcare (IYH), Consumer Staples (IYK), Consumer Discretionary (IYC), Energy (IYE), Basic Materials (IYM), Telecommunications (IYZ), and Utilities (IDU). Whereas the Select Sector SPDRs only contain stocks from the S&P 500 large cap index, I prefer the iShares for their larger universe and broader diversity.
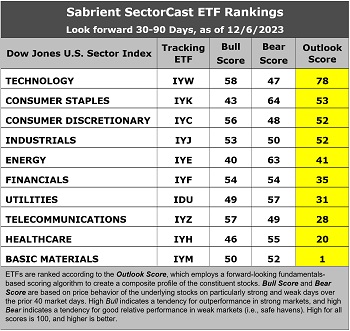
The latest fundamentals-based Outlook rankings continue to display a slightly bullish bias given the dominance of economically sensitive and cyclical sectors at the top. Technology (IYW) takes the top spot with an Outlook Score of 78, followed by the Consumer Staples sector (IYK) at 53, Consumer Discretionary (IYC) at 52, Industrials (IYJ) at 52, and Energy (IYE) at 41. Although Consumer Staples would be considered defensive, the inordinate selloff in defensive sectors is what set it up for a strong rebound and higher Outlook Score. Same with Utilities (IDU), which has risen to a score of 31. On the other hand, “deep cyclical” sector Basic Materials remains mired at the bottom as the sector continues to see negative earnings revisions from the analyst community. Notably, Financials (IYF) is rising, which is encouraging given the sector’s key role in a healthy economy.
Also notable is that the cyclical Energy sector displays the lowest Bull scores and a high Bear score. Low Bull and high Bear score is usually reflective of a defensive sector, but in this case, I believe it reflects current investor sentiment about the impact of rising oil prices on a fragile economy, i.e., helpful to Energy stocks’ earnings outlook but negative for the broader market (like a quasi-tax and inflationary). Similarly, the negative revisions for Basic Materials actually serves to reduce producer prices and inflation.
Keep in mind, the Outlook Rank does not include timing, momentum, or relative strength factors, but rather reflects the consensus fundamental expectations at a given point in time for individual stocks, aggregated by sector.
ETF Trading Ideas:
Our rules-based Sector Rotation model, which appropriately weights Outlook, Bull, and Bear scores in accordance with the overall market’s prevailing trend (bullish, neutral, or defensive), switched from neutral to a bullish bias in early November and remains so. The model suggests holding Technology (IYW), Consumer Discretionary (IYC), and Telecom (IYZ), in that order, although Industrials (IYJ) is close as well. (Note: In this model, we consider the bias to be bullish from a rules-based trend-following standpoint when SPY is above both its 50-day and 200-day simple moving averages, but neutral if it is between those SMAs while searching for direction, and defensive if below both SMAs.)
If you prefer a neutral bias, the Sector Rotation model suggests holding Technology (IYW), Consumer Staples (IYK), and Consumer Discretionary (IYC), in that order. Or, if you prefer to take a defensive stance, the model suggests holding Consumer Staples (IYK), Energy (IYE), and Utilities (IDU), in that order.
An assortment of other interesting ETFs that are scoring well in our latest rankings include: Alpha Architect US Quantitative Momentum (QMOM), First Trust International Equity Opportunities (FPXI), Pinnacle Focused Opportunities (FCUS), Cambria Cannabis (TOKE), ETFMG Travel Tech (AWAY), ProShares Nasdaq-100 Dorsey Wright Momentum (QQQA), Global X Metaverse (VR), Kraneshares CSI China Internet (KWEB), Innovator IBD 50 (FFTY), VanEck BDC Income (BIZD), AdvisorShares Vice (VICE), iShares Expanded Tech Sector (IGM), Invesco Leisure and Entertainment (PEJ), EMQQ Emerging Markets Internet & Ecommerce (EMQQ), Fidelity Disruptive Technology (FDTX), Alger 35 (ATFV), Pacer Data and Digital Revolution (TRFK), Valkyrie Bitcoin Miners (WGMI), Alpha Dog (RUFF), BNY Mellon Innovators (BKIV), Pacer US Large Cap Cash Cows Growth Leaders (COWG), Invesco Building & Construction (PKB), Capital Group Global Growth Equity (CGGO), SoFi Web 3 (TWEB), First Trust Multi-Manager Large Growth (MMLG), and Donoghue Forlines Innovation (DFNV). All score in the top decile (90-100) of Outlook scores.
As always, I welcome your thoughts on this article! Please email me anytime. Any and all feedback is appreciated! In particular, tell me what sections you find the most valuable—commentary, chart analysis, SectorCast scores, or ETF trading ideas / sector rotation model. Also, please let me know of your interest in a Sabrient index for TAMP or ETF investing…or in the new Sabrient SmartSheets to our full rankings of stocks and ETFs…or in having me speak at your event.
IMPORTANT NOTE: I post this information periodically as a free look inside some of our institutional research and as a source of some trading ideas for your own further investigation. It is not intended to be traded directly as a rules-based strategy in a real money portfolio. I am simply showing what a sector rotation model might suggest if a given portfolio was due for a rebalance, and I do not update the information on a regular schedule or on technical triggers. There are many ways for a client to trade such a strategy, including monthly or quarterly rebalancing, perhaps with interim adjustments to the bullish/neutral/defensive bias when warranted, but not necessarily on the days that I happen to post this article. The enhanced strategy seeks higher returns by employing individual stocks (or stock options) that are also highly ranked, but this introduces greater risks and volatility. I do not track performance of the ideas mentioned here as a managed portfolio.
Disclosure: At the time of this writing, of the securities mentioned, the author held options positions in SPY, QQQ, and IWM.
Disclaimer: Opinions expressed are the author’s alone and do not necessarily reflect the views of Sabrient. This newsletter is published solely for informational purposes and is not to be construed as advice or a recommendation to specific individuals. Individuals should take into account their personal financial circumstances in acting on any opinions, commentary, rankings, or stock selections provided by Sabrient Systems or its wholly owned subsidiary, Gradient Analytics. Sabrient makes no representations that the techniques used in its rankings or analysis will result in or guarantee profits in trading. Trading involves risk, including possible loss of principal and other losses, and past performance is no indication of future results.