Sector Detector: The stock market rally seems overdone
 by Scott Martindale
President & CEO, Sabrient Systems LLC
The US stock market has gone essentially straight up since late October. While the small-cap Russell 2000 (IWM) surged into year-end 2023, pulled back, and is just now retesting its December high, the mega-cap dominated S&P 500 (SPY) and Nasdaq 100 (QQQ) have both surged almost uninterruptedly to new high after new high. They have both briefly paused a few times to test support at the 20-day moving average but have not come close to testing the 50-day, while the CBOE Volatility Index (VIX) has closed below 16 the entire time. History says this can’t go on much longer.
I think this market rally is getting out over its skis and needs at least a breather if not a significant pullback to cleanse itself of the momentum “algo” traders and FOMO investors and wring out some of this AI-led bullish exuberance. That’s not say we are imminently due for a harsh correction back down to prior support for SPY around 465 (-9%) or to fill the gap on the daily chart from November 13 at 440 (-14%). But it will eventually retest its 200-day moving average, which sits around 450 today but is steadily rising, so perhaps the aforementioned 465 level is good target for a pullback and convergence with the 200-day MA.
Regardless, I believe that short of a Black Swan event (like a terrorist strike on US soil or another credit crisis) that puts us into recession, stocks would recover from any correction to achieve new highs by year-end. As famed economist Ed Yardeni says, “Over the years, we’ve learned that credit crunches, energy crises, and pandemic lockdowns cause recessions. We are looking out for such calamities. But for now, the outlook is for a continuation of the expansion.”
As for bonds, they have been weak so far this year (which pushes up interest rates), primarily because of the “bond vigilantes” who are not happy with the massive issuances of Treasuries and rapidly rising government debt and debt financing costs. So, stocks have been rising even as interest rates rise (and bonds fall), but bonds may soon catch a bid on any kind of talk about fiscal responsibility from our leaders (like Fed chair Powell has intimated).
So, I suspect both stocks and bonds will see more upside this year. In fact, the scene might follow a similar script to last year in which the market was strong overall but endured two significant pullbacks along the way—one in H1 and a lengthier one in H2, perhaps during the summer months or the runup to the election.
Moreover, I don’t believe stocks are in or near a “bubble.” You might be hearing in the media the adage, “If it’s a double, it’s a bubble.” Over the past 16 months since its October 2022 low, the market-leading Nasdaq 100 (QQQ) has returned 72% and the SPY is up 47%. Furthermore, DataTrek showed that, looking back from 1970, whenever the S&P has doubled in any 3-year rolling period (or less), or when the Nasdaq Composite has doubled in any 1-year rolling period, stock prices decline soon after. Well, the rolling 3-year return for the S&P 500 today is at about 30%. And the high-flying Nasdaq 100 is up about 50% over the past year. So, there appears to be no bubble by any of these metrics, and the odds of a harsh correction remain low, particularly in a presidential election year, with the added stimulus of at least a few rate cuts expected during the year.
Meanwhile, while bitcoin and Ethereum prices have surged over the past few weeks to much fanfare, oil has been quietly creeping higher, and gold and silver have suddenly caught a strong bid. As you might recall, I said in my December and January blog posts, “I like the prospects for longer-duration bonds, commodities, oil, gold, and uranium miner stocks this year, as well as physical gold, silver, and cryptocurrency as stores of value.” I still believe all of these are good holds for 2024. The approval of 11 “spot” ETFs for bitcoin—rather than futures-based or ETNs—was a big win for all cryptocurrencies, and in fact, I hear that major institutions like Bank of America, Wells Fargo, and Charles Schwab (not to mention all the discount brokers) now offer the Bitcoin ETFs—like Grayscale Bitcoin Trust (GBTC) and iShares Bitcoin Trust (IBIT), for example—to their wealth management clients. And they have just begun the process of allocating to those portfolios (perhaps up to the range of 2-5%).
As for inflation, I opined last month that inflation already might be below the 2% target such that the Fed can begin normalizing fed funds rate toward a “neutral rate” of around 3.0% nominal (i.e., 2% target inflation plus 1.0% r-star) versus 5.25–5.50% today. But then the January inflation data showed an uptick. Nonetheless, I think it will prove temporary, and the disinflationary trends will continue to manifest. I discuss this in greater length in today’s post. Also, I still believe a terminal fed funds rate of 3.0% would be appropriate so that borrowers can handle the debt burden while fixed income investors can receive a reasonable real yield (i.e., above the inflation rate) so they don’t have to take on undue risk to achieve meaningful income. As it stands today, I think the real yield is too high—i.e., great for savers but bad for borrowers.
Finally, if you are looking outside of the cap-weighted passive indexes (and their elevated valuation multiples) for investment opportunities, let me remind you that Sabrient’s actively selected portfolios include the Baker’s Dozen (a concentrated 13-stock portfolio offering the potential for significant outperformance), Small Cap Growth (an alpha-seeking alternative to a passive index like the Russell 2000), and Dividend (a growth plus income strategy paying a 3.8% current yield). The new Q1 2024 Baker’s Dozen just launched on 1/19/24.
Click here to continue reading my full commentary in which I also discuss Sabrient’s latest fundamentals based SectorCast quantitative rankings of the ten U.S. business sectors (which continues to be led by Technology), current positioning of our sector rotation model (which turned bullish in early November and remains so today), and several top-ranked ETF ideas. Or if you prefer, here is a link to this post in printable PDF format (as some of my readers have requested). Please feel free to share my full post with your friends, colleagues, and clients! You also can sign up for email delivery of this periodic newsletter at Sabrient.com.
By the way, Sabrient founder David Brown has a new book coming out soon through Amazon.com in which he describes his approach to quantitative modeling and stock selection for four distinct investing strategies. It is concise, informative, and a quick read. David has written a number of books through the years, and in this new one he provides valuable insights geared mostly to individual investors, although financial advisors may find it valuable as well. I will provide more information as we get closer to launch. In the meantime, as a loyal subscriber, please let me know if you’d like to be an early book reviewer!
Market commentary:
SPY has been hitting new highs (+7.9% YTD through 3/1/24)—and leaving its equal-weight sibling RSP in the dust (+3.9%)—primarily due to these four stocks: NVIDIA (NVDA, +66.1%), Meta Platforms (META, +42.1%), Amazon.com (AMZN, +17.3%), and Microsoft (MSFT, +10.7%). Notably, the other three members of the “Magnificent Seven” (aka MAG7) corporate titans are all in the red YTD, including Alphabet (GOOGL, -1.8%), Apple (AAPL, -6.6%), and the struggling Tesla (TSLA, -18.4%). US Big Tech companies after many reported strong calendar Q4 results. Other than the struggling Tesla, these firms reflect stronger fundamentals than the S&P 500 overall, and the Technology Select Sector SPDR is up +9.5% YTD through 3/1. Notably, the strength of this “MAG4” has powered the SPY past $500 billion in AUM (that’s half a trillion!), making it the first ETF ever to do so.
It was somewhat concerning when the improving breadth we saw in the second half of 2023 reverted to its previous narrow leadership in January, but then February brought back the healthy broadening action, with equal-weight S&P 500 (RSP) and small-cap Russell 2000 (IWM) both outperforming the cap-weight S&P 500 (SPY). Cyclical sectors are also getting some love, with Industrials Sector SPDR (XLI) +6.6%, Financials (XLF) +7.2%, and Healthcare (XLV) +7.3%. Also, the 60/40 portfolio, using SPY and the iShares 20+ Year Treasury ETF (TLT), is up +3.2%.
Small-cap IWM appears to be trying to break out of its year-long sideways channel—at least partly due to its largest holding in high-flying Super Micro Computer (SMCI, up +218% YTD thru 3/1), which remains in the index despite its $60 billion market cap. Interestingly, the S&P 600 Small Cap index (SPSM) is not yet doing so—at least partly because it does not hold SMCI. Also, although historically they have been highly correlated from a price standpoint, the SPSM has a quality-bias versus IWM since all constituents must have positive earnings while the IWM has many unprofitable companies, which tends to have SPSM slightly outperform. So, the recent divergence and technical breakout for IWM reflects something of a speculative rally. Small caps certainly have some catching up to do as they have been stuck in a long trading range since the October 2022 market bottom while the large-cap indexes (again, powered by the “MAG4”) have surged to new heights.
AI mania:
I think small and mid-caps will see some catch-up soon, with a broadening into high-quality stocks other than the mega-cap Tech titans. In particular, many of the smaller AI-oriented Tech stocks should do well, especially those that can coattail on Sam Altman’s grand vision. He is the CEO of OpenAI who wants to create an AI “supergroup” of governments, mega-cap companies, and billionaire investors to allocate $7 trillion toward the global AI industry and its physical infrastructure, including manufacturing facilities, data centers, and the critical energy production plants.
The AI mania absolutely has been a key driver market strength. In a new research note, UBS said that AI could put the US economy on track for a “Roaring ‘20s” scenario (a term used by economist Ed Yardeni as well), which “entails a secular increase in productivity and trend-level growth that can last multiple years.” This mania also extends to cloud infrastructure, data centers, power solutions, and “Big Data” management services as well, and the expectation of its impact on rapid innovation and product development, enhanced customer experience and retention, and greater productivity (both incrementally in the near-term and exponentially in the long-term).
But the worry is two-fold: 1) Is the timetable realistic? Even disruptive innovation leader Apple has had to abandon its electric vehicle initiatives (despite enormous investment) and pivot to AI (which seems to me to be more in line with its image and expertise). And 2) Will unbridled AI advances generate as much in the way of problems and chaos—e.g., rampant public deception, IP theft, copyright/patent violations, or uncontrollable machines (like “HAL” in the movie 2001: A Space Odyssey)—as benefits?
Federal spending and debt:
Strong market performance has occurred in spite of large cash inflows into the safety and high interest (5%) of money market funds, which now exceed $6 trillion. Persistently high interest rates, even as inflation continues to grind lower, have put real rates at a high level, which has certainly been an attraction. The good news is this cash is highly liquid and may offer fresh powder for stocks once an “all clear” signal is evident to investors and the Fed begins cutting rates. However, that signal may not come from the Fed alone, as I believe there also needs to be some indication that the “adults” are returning to the room to put a lid on the reckless spending of our current Congress and president. Perhaps that shift will be an outcome of the November elections.
The immense federal debt now exceeds $34 trillion (and is growing fast), while interest payments on that debt as interest rates rise (projected by the CBO to be $870 billion in 2024) and our federal budget deficit (projected by the CBO to be $1.6 trillion in 2024). The reaction of the so-called “bond vigilantes” to the large Treasury auctions required for both maturing Treasuries and new spending has been telling. Lately, dealers have had to step in and assume large stakes (e.g., as much as 20% of issuance). This has hurt bond prices and driven up yields.
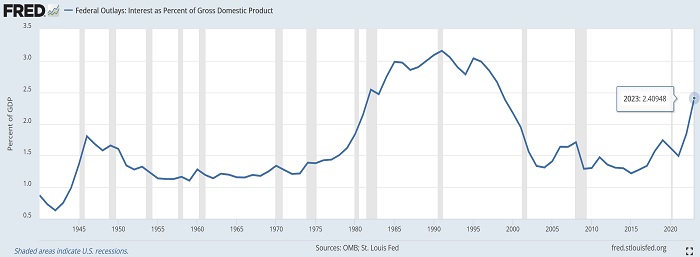
Since 1970, US GDP has risen from $5 trillion to $25 trillion (5x) while federal debt has risen from $350 billion to $34 trillion (100x). So, debt has grown 20x faster than GDP, which is startling. As shown in the chart below, federal interest payments are now at 2.4% of GDP and rapidly rising, although not yet to the 3%+ levels of the 1990’s. So, although manageable for now, it can quickly become unsustainable with this trajectory. You can see that the early-1980’s had a similar surge in debt/GDP ratio, but you might recall that the ensuing 1990’s were a time of global peace, the dawn of the Internet, and massive Y2K capital spending, which gave President Clinton and Congress the freedom to balance the budget and implement cost-cutting like welfare reform through bipartisan cooperation. Today, no such actions seem to be on the horizon anytime soon.
And as if $34 trillion of debt is not bad enough, according to The Hill, our total unfunded liabilities—which comprises promised programs like Social Security, Medicare, employee pensions, and veterans’ benefits in addition to federal debt held by the public—is estimated to be around $212 trillion. This is up from $122 trillion in 2019 and growing fast.
Stock valuations and a developing bubble:
According to FactSet, the 5-year average forward P/E on S&P 500 (SPY) is 19.0x and the 10-year average is 17.7x. But today, the cap-weight SPY still displays an elevated forward P/E of 21.1x—although many commentators believe the MAG7 deserve their high multiples given their extreme earnings growth, wide business moats, and massive size that allows them to rapidly develop and leverage generative artificial intelligence (Gen AI). Meanwhile, the equal-weight RSP has a more modest forward P/E of 17.0x and small-cap SPSM is at only 14.2x. Looking at the Nasdaq 100, the cap-weight QQQ displays a forward P/E of 26.5x, while the equal-weight QQQE is 24.4x. So, not as great a difference as most of the Nasdaq 100 sport higher P/Es.
Notably, Microsoft recently passed Apple as the largest stock by market capitalization (and is now the only company above the $3T mark). This has been largely attributed to China’s economic struggles. I have written about China’s “house of cards” situation for several years, and although it has always managed to find a way to keep the “Miracle” alive, the cracks in the façade are widening. Its population fell by 2 million in 2023, which reflects the second straight year of falling population. Without much immigration, it relies on births—but although its infamous one-child policy was rescinded long ago, it became ingrained in the culture. Births have fallen for seven straight years, and now its GDP is growing at the slowest rate in 30 years, which has had increasing impact on companies like Apple and Tesla that rely on sales to the Chinese to continue their own rapid growth rates.
In addition, Nvidia continues to defy gravity and is now the third largest company in the world, having surpassed Alphabet (aka Google) in market capitalization. Fun facts: the combined market cap of the MAG7 stocks is greater than both China’s GDP and the combined market cap of all mainland China and Hong Kong-listed stocks. And Microsoft, Apple, and Nvidia each individually have market caps that surpass Russia’s annual nominal GDP (measured in US dollars). It’s all quite amazing to think about.
Stock valuation multiples are driven by interest rates, corporate earnings, and investor sentiment. In fact, according to the good folks at DataTrek, interest rate volatility is more important to equity valuations than the absolute level of rates, which explains why valuation multiples today are higher than they were pre-pandemic when rates were much lower. They opine, “Markets are convinced that there is no 1970s-style rate shock coming, the sort of yield volatility that crushes stock prices.” So, interest rates can go up without hurting valuations if investors are confident that corporate earnings will improve and offset those higher rates. FactSet says that CY2024 earnings growth is expected to be +10.9% YoY. And assuming inflation continues to gradually work its way lower, it will allow interest rates to fall as the Fed begins cutting the fed funds rate toward the neutral rate (which, again, I believe is around 3.0%) while longer-term bonds catch a bid.
Corporate bond spreads versus Treasuries are the lowest spreads since the Fed began its rate hike cycle in early 2022, which suggests a sanguine outlook on the US economy and minimal default risk. Today, a high-yield bond pays an interest rate of only 3.32% above a similarly dated Treasury, a BB-rated bond spread is 2.07%, BBB is 1.25%, and IG is 1.01%, reflecting very low risk premiums and a fearless desire for yield.
As for cash balances, corporate coffers are at an all-time high and are about double the pre-pandemic norm. When interest rates are high, it behooves a company to be cash-rich rather than needing to borrow. In fact, in the wake of the pandemic lockdowns when rates fell to historic lows, corporate surged 11% showed foresight by loading up on low-cost cash—which means their need for new bond issuances today is lessened, and their excess cash being held for future needs is being invested at today’s elevated (5%) money market rates. This interest income can be used for anything from funding new projects to buying back shares to padding the financial statements. So, corporations seem to be in a good cash position.
For individual investors, they are holding 17% in cash and 67% in stocks. The AAII recently released a survey showing that, on average since 1987, investors hold 16% of their money in cash and 62% in stocks. So, they are not too far from average. Compare this to March 2009 (just before the recovery started from the Financial Crisis) when they held 45% in cash and 41% in stocks, and to late-1999 (in the bullish run-up to Y2K) when they held 12% in cash and 76% in stocks.
So, from the perspective of corporate and investor cash holdings, stocks aren’t yet in a bubble.
Falling inflation takes an uptick:
For January, the New York Fed’s Global Supply Chain Pressure Index (GSCPI) has remained calm despite disruptions to shipping we keep hearing about, such as the Houthi missiles in the Red Sea. The past 3 months readings were -0.11 for January, -0.15 for December, and +0.13 for November, suggesting that supply chain pressures are now firmly back around the long-run average—which, as a precursor to producer prices, suggests that inflation will continue its gradual retreat. GSCPI measures the number of standard deviations from the historical average value (aka Z-score) and generally foreshadows movements in inflation metrics. GSCPI is measured by z-score, or the number of standard deviations above or below the long-run average, with a negative reading meaning supply chain pressures are slightly below the long-term average. So, it appears to be back to normal, fluctuating around the zero line, versus the post-pandemic-lockdown high of +4.33 in December 2021.
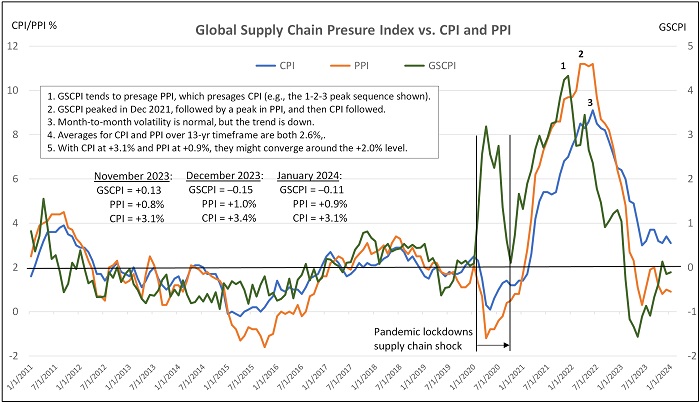
Because supply chain pressures impact product prices (PPI), which in turn impact consumer prices (CPI and PCE), and because PPI and CPI both have a long-run average (over this 13-year timeframe) of around 2.6%, it seems logical and likely to me that PPI (0.9% YoY in January) and CPI (3.1% YoY in January), will gradually converge toward the +2.0% level. In fact, if you compute the average of 0.9 and 3.1, it equals 2.0%. So that seems like a logical target for convergence.
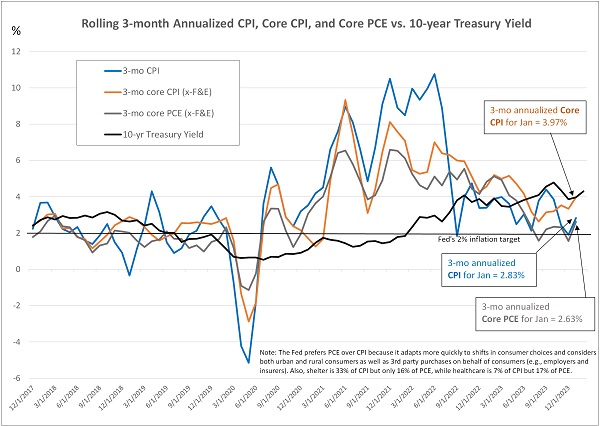
In addition, January PCE came in last week at 2.40% YoY, while the Fed’s preferred inflation gauge Core PCE came in at 2.85% YoY. However, I prefer to focus on the most recent trend over the past 3 months. In December, that rolling 3-month average was just 1.56%, but for January, annualizing the Core PCE price index change over the past 3 months (0.09% in November, 0.14% in December, and 0.42% in January) ticked back up to a 2.63% annualized inflation rate, as shown in the chart below. So, while still low and in line with the volatile paths of the various curves shown in the chart, we heard some consternation, weeping and gnashing of teeth among commentators.
But in my view, inflation is simply in the final choppy stages of achieving the Fed’s 2% target. Wage growth in January fell to its lowest rate (5.0%) since peaking in mid-2022 (6.7%); the GSCPI supply chain pressure index remains subdued; money supply is stagnant; and the lag effects of elevated rates are manifesting in the form of consumer debt defaults and delinquencies, contraction in manufacturing activity and order backlogs, new layoffs and reduced hiring across manufacturing, technology, and financial services, commercial real estate stress from debt maturity rollovers, and federal, state, and local governments similarly burdened by rising financing costs on debt rollovers and new issuances. As a result, we are seeing the Fed soften its tone and plan for rate cuts.
The Fed believes the composition of PCE more accurately reflects current impacts on consumers than does CPI. This is because it more quickly adapts to consumer choices through its weighting adjustments to individual items (e.g., shifts from pricier brands to discount brands). Also, while CPI narrowly considers only urban expenditures, PCE considers both urban and rural consumers as well as third-party purchases on behalf of a consumer, such as healthcare insurers buying prescription drugs. Furthermore, items are weighted differently—for example, shelter is the largest component of CPI at 32.9% but only 15.9% of PCE.
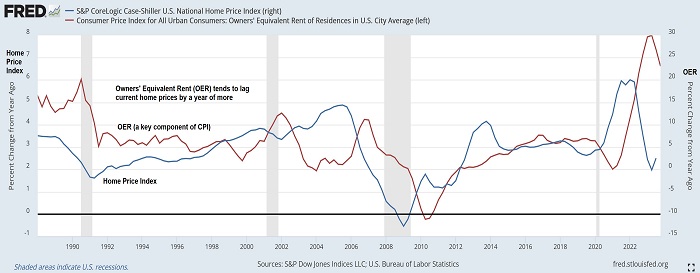
Below is a chart illustrating the lag between the owner’s equivalent rent (OER) used in the computation of shelter costs and the S&P CoreLogic Case-Shiller US National Home Price Index. As shown, OER tends to lag current housing prices by over a year. Thus, judging by the recent collapse in the Home Price Index, we might expect shelter costs in the CPI and PCE calculations to fall precipitously this year.
Besides the long lag in changes in shelter costs, inflation in January also may have been impacted by one-time price increases in the services sector (most notably insurance premiums due to benchmark revisions) for the new year. In addition, there will be seasonality adjustments (likely lower), so the big MoM jump in January may be revised lower next month.
Also, while they are still free to download, I invite you to examine our new product Sabrient SmartSheets—one for individual stocks and one for ETFs, we have expanded the content to include Top 30 lists for each of a variety of our potent quantitative scores. Notably, we have further enhancements in the pipeline to help investors and advisors with stock search, fundamental screening, idea generation, risk monitoring, and confirmation. These sheets are posted weekly in Excel format and show how your stocks and ETFs score in our various alpha factors…or for identifying the top-ranked stocks and ETFs for each alpha factor (or for weighted combinations of the factors). Please check them out and share your feedback with me!
Latest Sector Rankings:
Relative sector rankings are based on our proprietary SectorCast model, which builds a composite profile of each of over 1,000 equity ETFs based on bottom-up aggregate scoring of the constituent stocks. The Outlook Score is a Growth at a Reasonable Price (GARP) model that employs a forward-looking, fundamentals-based multifactor algorithm considering forward valuation, historical and projected earnings growth, the dynamics of Wall Street analysts’ consensus earnings estimates and recent revisions (up or down), quality and sustainability of reported earnings, and various return ratios. It helps us predict relative performance over the next 3-6 months.
In addition, SectorCast computes a Bull Score and Bear Score for each ETF based on recent price behavior of the constituent stocks on particularly strong and weak market days. A high Bull score indicates that stocks within the ETF recently have tended toward relative outperformance when the market is strong, while a high Bear score indicates that stocks within the ETF have tended to hold up relatively well (i.e., safe havens) when the market is weak. Outlook score is forward-looking while Bull and Bear are backward-looking.
As a group, these three scores can be helpful for positioning a portfolio for a given set of anticipated market conditions. Of course, each ETF holds a unique portfolio of stocks and position weights, so the sectors represented will score differently depending upon which set of ETFs is used. We use the iShares that represent the ten major U.S. business sectors: Financials (IYF), Technology (IYW), Industrials (IYJ), Healthcare (IYH), Consumer Staples (IYK), Consumer Discretionary (IYC), Energy (IYE), Basic Materials (IYM), Telecommunications (IYZ), and Utilities (IDU). Whereas the Select Sector SPDRs only contain stocks from the S&P 500 large cap index, I prefer the iShares for their larger universe and broader diversity.
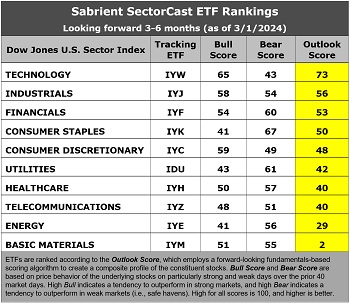
The latest fundamentals-based Outlook rankings continue to display a bullish bias given the predominance of economically sensitive and cyclical sectors at the top. Despite a high forward P/E of 28.2x, Technology (IYW) remains in the top spot with an Outlook score of 73, given its strong EPS growth estimates (17.5%), its relatively modest forward PEG (forward P/E to EPS growth ratio) of 1.61, consistently positive earnings revisions from the Wall Street analyst community, the best return ratios, and solid insider sentiment (open market buying).
Then, there’s a big drop-off to Industrials (IYJ) with an Outlook score of 56 followed by Financials (IYF) at 53. Consumer Staples (IYK) at 50 and Consumer Discretionary (IYC) at 48 round out the top 5. Notably, IYF continues to rise in the rankings since the beginning of the year (and its share price has been rising as well), mostly due to a switch from deeply negative EPS revisions from the analyst community to positive revisions. Financials also boasts one of the lowest forward PEG of 1.47 (behind only Telecom at 1.38).
On the other hand, “deep cyclical” sectors Energy (IYE) and Basic Materials (IYM) remain the bottom two. Also notable is that the Energy sector displays the lowest Bull score of 41 and a relatively high Bear score of 56. Low Bull and high Bear score is usually reflective of a defensive sector, but in this case, I believe it reflects investor sentiment about the impact of rising oil prices on a fragile economy, i.e., helpful to Energy stocks’ earnings outlook but negative for the broader market (like a quasi-tax and inflationary). Similarly, negative earnings revisions for Basic Materials helps to reduce producer prices and inflation.
Keep in mind, the Outlook Rank does not include timing, momentum, or relative strength factors, but rather reflects the consensus fundamental expectations at a given point in time for individual stocks, aggregated by sector.
ETF Trading Ideas:
Our rules-based Sector Rotation model, which appropriately weights Outlook, Bull, and Bear scores in accordance with the overall market’s prevailing trend (bullish, neutral, or defensive), maintains its bullish bias as the market rally rages on. It has been bullish since early November. The model suggests holding Technology (IYW), Industrials (IYJ), and Consumer Discretionary (IYC), in that order. (Note: In this model, we consider the bias to be bullish from a rules-based trend-following standpoint when SPY is above both its 50-day and 200-day simple moving averages, but neutral if it is between those SMAs while searching for direction, and defensive if below both SMAs.)
If you prefer a neutral bias, the Sector Rotation model suggests holding Technology, Industrials, and Financials (IYF). Or, if you prefer to take a defensive stance on the market, the model suggests holding Consumer Staples (IYK), Financials, and Utilities (IDU), in that order.
An assortment of other interesting ETFs that are scoring well in our latest rankings include: Invesco Building & Construction (PKB), Invesco Next Gen Media & Gaming (GGME), Alger 35 (ATFV), Invesco Dorsey Wright Consumer Cyclicals Momentum (PEZ), Global X Social Media (SOCL), Innovator IBD 50 (FFTY), First Trust Innovation Leaders (ILDR), Invesco S&P 500 Momentum (SPMO), Fidelity Disruptive Communications (FDCF), PGIM Jennison Better Future (PJBF), Pacer US Small Cap Cash Cows Growth Leaders (CAFG), Invesco S&P MidCap 400 Pure Growth (RFG), ProShares Pet Care (PAWZ), SEI Enhanced US Large Cap Momentum (SEIM), Pinnacle Focused Opportunities (FCUS), AdvisorShares Hotel (BEDZ), Direxion Work From Home (WFH), Donoghue Forlines Innovation (DFNV), Clockwise Core Equity & Innovation (TIME), AdvisorShares Vice (VICE), and First Trust Active Factor Small Cap (AFSM). All score in the top decile (90-100) of Outlook scores.
As always, I welcome your thoughts on this article! Please email me anytime. Any and all feedback is appreciated! In particular, please tell me what sections you find the most valuable—commentary, SectorCast scores, or ETF trading ideas / sector rotation model. Also, please let me know of your interest in:
1. a Sabrient index for ETF investing (we offer a 10-index Quality Index Series)
2. the new Sabrient SmartSheets with our full rankings of stocks and ETFs
3. having me speak at your event (topics range from the economy and stocks, the energy sector, China’s tough economic situation, to career success secrets for young professionals)
IMPORTANT NOTE: I post this information periodically as a free look inside some of our institutional research and as a source of some trading ideas for your own further investigation. It is not intended to be traded directly as a rules-based strategy in a real money portfolio. I am simply showing what a sector rotation model might suggest if a given portfolio was due for a rebalance, and I do not update the information on a regular schedule or on technical triggers. There are many ways for a client to trade such a strategy, including monthly or quarterly rebalancing, perhaps with interim adjustments to the bullish/neutral/defensive bias when warranted, but not necessarily on the days that I happen to post this article. The enhanced strategy seeks higher returns by employing individual stocks (or stock options) that are also highly ranked, but this introduces greater risks and volatility. I do not track performance of the ideas mentioned here as a managed portfolio.
Disclosure: At the time of this writing, of the securities mentioned, the author held short positions in SPY and QQQ, and long positions in TLT, gold, silver, oil, and cryptocurrencies.
Disclaimer: Opinions expressed are the author’s alone and do not necessarily reflect the views of Sabrient. This newsletter is published solely for informational purposes and is not to be construed as advice or a recommendation to specific individuals. Individuals should take into account their personal financial circumstances in acting on any opinions, commentary, rankings, or stock selections provided by Sabrient Systems or its wholly owned subsidiary, Gradient Analytics. Sabrient makes no representations that the techniques used in its rankings or analysis will result in or guarantee profits in trading. Trading involves risk, including possible loss of principal and other losses, and past performance is no indication of future results.