Sector Detector: Stocks stage extraordinary recovery, but war, oil, inflation, and debt still loom large

by Scott Martindale
CEO, Sabrient Systems LLC
Quick note 1: Sabrient’s new Q2 2026 Baker’s Dozen Portfolio just launched last Friday 4/17 as a 15-month portfolio with a mid-cap bias and a diverse group of 13 stocks across 8 business sectors, including several under-the-radar names. Notably, last year’s Q1 2025 Baker’s Dozen just terminated on 4/20 with a gross total return of +46.7% (vs. +20.3% for SPY).
Quick note 2: I invite you to visit https://MoonRocksToPowerStocks.com to learn more about Sabrient founder and former NASA engineer David Brown’s new book (an Amazon international bestseller) that details the fundamental factors underlying Sabrient’s models. Immediately download the book and 2 bonus reports (on investing in the Future of Energy and Space Exploration), plus a detailed report on the new Q2 2026 Sabrient Baker’s Dozen (all in PDF format) and learn how to access Sabrient Scorecards, an investor tool that provides access to our proprietary scores to make the stock evaluation process easy for idea generation and portfolio monitoring.
Overview
It didn’t take long for stocks to surge back to new all-time highs. Despite some commentators asserting that $100/bbl oil is here to stay given the damage wrought on energy infrastructure and supply chains, investors were unphased. The S&P 500 quickly reclaimed both its 50- and 200-day moving averages simultaneously (before the dreaded “death cross” could occur) in an historic run, and then continued to surge to new highs in response to Iran resolution optimism, earnings season confidence, resurgent zeal for the Tech/AI/blockchain Supercycle, falling bond yields, and a weaker US dollar, as safe haven capital rotated back into risk assets. Just a few weeks ago, I wrote in my 3/31 post that the S&P 500 had closed below its 200-day moving average for eight straight sessions and was struggling to hold support at the 300-day moving average, but that the selling seemed near exhaustion and ready for at least a bounce to fill gaps in the chart. Well, it got a lot more than a bounce.
Big Tech led the April surge. Bloomberg pointed out that over half of the S&P 500’s gain can be attributed to these seven companies—NVIDIA, Amazon, Microsoft, Broadcom, Alphabet, Meta Platforms, and Apple, which gained a combined $4 trillion in market cap. The rally commenced on 3/31 even as oil prices were still rising (to nearly $120/bbl on 4/7). This divergence is similar to what it did in 1990, which marked a low for equities at the time. But then on 4/8, crude oil fell suddenly and sharply, ultimately falling to near $80/bbl last Friday on ceasefires and news of that a peace agreement might be nigh along with a reopening of the Strait of Hormuz. (However, investors must keep in mind that we are still dealing with a fanatical, apocalyptic theocracy that is neither rational nor trustworthy…and indeed we can’t be sure if there is a true central governing body with whom to make a lasting deal.)
According to Bespoke Investment Group (BIG), since 1928, this is the first time the S&P 500 has reached a new all-time high within 11 days of a 5-10% pullback. In the midst of this historic rally, DataTrek noted, “Will the S&P 500 need to retest its March 30th lows, or was that a classic ‘V bottom’? History shows stocks don’t need to retest if investors are sure that policy has changed enough to address the causes of prior declines. We believe that is the case now and remain positive on global/US stocks.” Indeed, last week for the first time ever, the S&P 500 closed above 7,000 and Nasdaq above 24,000, while the Dow is eyeing 50,000 once again—and this bull market is now approaching 1,300 calendar days since its last 20% peak-to-trough correction (which ended on 10/11/2022).
Furthermore, the CBOE Volatility (VIX) Index is solidly back below 20 (the “fear threshold”), and the 10-year Treasury yield has pulled back to 4.25%. Notably, credit spreads are subdued, with high-yield plummeting from a peak of 3.46 pps on 3/30 to just 2.83 today. The credit market is highly sophisticated and historically a better predictor of economic distress than equities, so the current tightening in spreads suggests that despite high oil price and lingering uncertainty about direction, institutional fixed income investors are not pricing in rising default risk.
However, the market is surely not off to the races from here, in my view. The charts are extremely overbought, there has been narrow Tech leadership during this recent surge, and traders have taken on additional leverage. So, stock will likely pause to at least consolidate gains and more likely pull back to test bullish conviction at key support levels.
Nevertheless, I think the overall outlook for 2026 remains bright. Yes, the ongoing Iran conflict has created vast uncertainties and severe impacts on energy and supply chains—and by extension, inflation. But don’t forget, as we entered Q1 earnings season, corporate earnings expectations continued to be revised higher—now expected to be around 13% YoY for the S&P 500 in Q1 and 17% for full-year 2026—fueled by massive capex in AI, blockchain, energy, and re-industrialization/reshoring of factories and power infrastructure, leading to rising productivity, increased productive capacity, a resumption in disinflationary trends, and economic expansion.
In addition, the One Big Beautifull Bill Act (OBBA) has fully kicked in with its tax reform, deregulation, pro-energy policies, and broad support for the private sector to retake its rightful place as the primary engine of growth (with more efficient capital allocation and ROI than government). Federal government staffing is shrinking, helping to contract the budget deficit, along with tariff revenue, fraud identification/reduction (especially in big-ticket line items like Medicare/Medicaid). And don’t forget the enthusiasm for this year’s IPO market, with names like SpaceX/xAI, OpenAI (ChatGPT), and Anthropic (Claude) expected to soon go public. In February, Anthropic closed a $30 billion funding round at a $380 billion valuation, backed by Alphabet, Amazon, Microsoft, and NVIDIA. SpaceX seems to be targeting a June listing at a valuation of at least $1.75 trillion. No doubt, the US continues to be the world’s leading economic growth engine.
As the WSJ noted last week, “Oil prices have retreated. Wall Street banks just posted blockbuster earnings. And CEOs are touting the strength of the US economy. That combination has stocks back on the brink of records and some investors thinking a strong earnings season could power them even higher.” And as Barclays sees it, “There is a wall of worry—but it’s worth climbing.”
Regardless, the Iran conflict and seesaw of shipping blockades has laid bare the risks to the global economy of overreliance on supplies of critical energy and petrochemical supplies from a volatile part of the world and a very narrow waterway/chokepoint that has been long at the mercy of a terrorist regime. Facing down this systemic threat had to happen before Iran’s military capabilities—supported by China and Russia—reached the point of no return, in which the fallout of confrontation could be catastrophic. But also, the need for more diversified petroleum and petrochemical supply chains is no longer a mere discussion point.
Looking ahead, the Atlanta Fed GDPNow forecasts only +1.3% for Q1 2026, but it can change quickly with new data points. The jobs market remains in a lackluster “no hire, no fire” mode, with falling job openings, fewer opportunities for new college grads, and wage growth that has not kept up with price increases, as real (inflation-adjusted) hourly earnings declined -0.6% in March and have risen only +0.3% over the past year. As the Fed put it in their Beige Book, labor demand is “stable, with low turnover, minimal layoffs, and hiring mostly for replacement.” So, jobs growth is slowing and wage growth is decelerating. Overall, I continue to believe the overall economic picture suggests room for another Fed rate cut—but certainly not a rate hike, as some inflation hawks still suggest—and I still think today’s fed funds rate should be 3.0%.
The topics covered in today’s post are eclectic. I discuss stock patterns and valuations, the economy, inflation, debt, liquidity, and Fed policy, and in my Final Comments section I touch on more esoteric topics like lessons learned from the Iran conflict, supply chains, reverse lightering of oil tankers…and even some passages from Catechism. Then I close with my usual update on Sabrient’s sector rankings, positioning of our sector rotation model, and some top-ranked ETF ideas.
I expect stock market performance to be more dependent upon robust earnings growth and ROI—rather than AI hope-driven multiple expansion. Regardless, rather than the broad passive indexes (which are dominated by growth stocks, Big Tech, and the AI hyperscalers), I think 2026 should continue to be a good year for active stock selection, small caps, and bond-alternative dividend payers—which bodes well for Sabrient’s Baker’s Dozen, Forward Looking Value, Small Cap Growth, and Dividend portfolios, which are packaged and distributed as unit investment trusts (UITs) by First Trust Portfolios.
By the way, our new Q2 2026 Baker’s Dozen Portfolio just launched last Friday 4/17 as a 15-month portfolio with a mid-cap bias and a diverse group of 13 stocks across 8 business sectors (InfoTech, Financials, Industrials, Healthcare, Consumer, Comm Services, Energy, and Materials), including familiar names like Taiwan Semi (TSM) and Cheniere Energy (LNG), but also under-the-radar names like machinery maker Allison Transmission (ALSN) and engineering & construction firm Dycom Industries (DY). Notably, last year’s Q1 2025 Baker’s Dozen just terminated on 4/20 with a gross total return of +46.7% (vs. +20.3% for SPY), led by infrastructure engineering & construction firm Comfort Systems USA (FIX), oil & gas equipment and services firm TechnipFMC (FTI), and chipmaker Advanced Micro Devices (AMD).
Also, small caps and high-dividend payers tend to benefit from market rotation—which should resume as the war comes to a (hopefully swift) resolution, so Sabrient’s quarterly Small Cap Growth and Dividend portfolios might be timely investments. And, as a reminder, our Earnings Quality Rank (EQR) is licensed to the actively managed, low-beta First Trust Long-Short ETF (FTLS) as a quality prescreen (Note: FTLS never lost support at its 200-day moving average during the March selloff).
I have been encouraging investors throughout this global turmoil to exploit market pullbacks by accumulating high-quality stocks as they rebound. By “high quality,” I mean fundamentally strong, displaying a history of consistent, reliable, resilient, durable, and accelerating sales and earnings growth, positive revisions to Wall Street analysts’ consensus estimates, a history of meeting/beating estimates, rising profit margins and free cash flow, high capital efficiency (e.g., ROI), solid earnings quality and conservative accounting practices, a strong balance sheet, low debt burden, competitive advantage, a wide moat, and a reasonable valuation compared to its peers and its own history.
These are the factors Sabrient employs in our quantitative models and “quantamental” portfolio selection process. You can learn how to access several of our proprietary models for idea generation and portfolio monitoring through Sabrient Scorecards, as well as download Sabrient founder David Brown’s latest book (an Amazon international bestseller), by visiting this link: Moon Rocks to Power Stocks
Here is a link to this post in printable PDF format, where you also can find my latest Baker’s Dozen presentation slide deck. As always, I’d love to hear from you! Please feel free to email me your thoughts on this article or if you’d like me to speak on any of these topics at your event! Read on….
Market Commentary
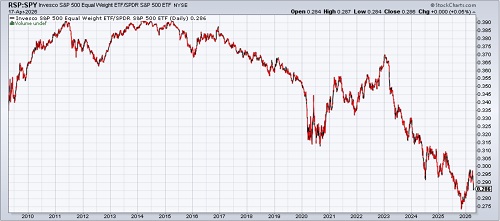
To illustrate the ongoing narrowness of market leadership, the chart below shows the ratio of S&P 500 Equal-Weight ETF (RSP) to S&P 500 Cap-Weight (SPY) since the start of the post-GFC recovery in 2009. It indicates the relative performance of RSP to SPY. As indicated by a rising line, market breadth strengthened from 2009 thru mid-2011 coming out of the GFC, then during the broadening bull market of 2012-14, then in 2016 coming out of the “FAANGM-or-nothing” stage of early Big-Tech dominance, and then in 2021 during the post-pandemic recovery followed by the 2022 bear market. But ever since January 2023, likely correlated with the stunning introduction of ChatGPT in November 2022, capital has rotated heavily into the Tech sector and particularly the “AI tech stack” (hyperscalers, chipmakers, networkers) like Microsoft, Meta Platforms, Alphabet, Amazon, Oracle, NVIDIA, Broadcom, AMD, Taiwan Semi, ASML, Micron, Intel, Arista, and Cisco, as well as the “AI appliers” like Apple, Tesla, Palantir, SAP, and IBM. Q4 2025 marked the extreme low for the RSP:SPY ratio. And yet despite the subsequent broadening and market rotation into other sectors (that are typically hallmarks of a “healthy” stock market), the ratio is now falling once again. Might this be the pause before the next leg up in the ratio, i.e., a resumption in the market rotation?
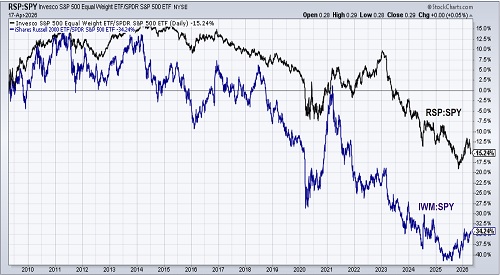
Interestingly, while the RSP has lagged SPY during the April rally, small caps have continued to outperform. And yet relative valuations remain near 25-year lows, as illustrated in the chart below showing the ratio of Russell 2000 (IWM) to SPY (lower line) alongside the previous RSP:SPY chart (upper line). Even though IWM’s relative valuation bottomed in mid-2025 and has rallied quite a bit, it still has a lot of ground to make up. Just look at much catching up it did in the post-pandemic recovery through early-2021. The market broadening since Q2 2025 is demonstrated by the rise in both lines, but if you look closely at the final tail representing the past 3 weeks, it shows the IWM:SPY line rose sharply while the RSP:SPY line fell sharply. Notably, the price action on Monday 4/20 was interesting in that RSP and IWM both finished solidly up while SPY and Nasdaq 100 (QQQ) were both down.
Infrastructure Capital wrote, “…history suggests that when borrowing costs decline and credit spreads compress, smaller companies often respond earlier and more forcefully than the broader equity market.” Also, the new tax rules in the OBBBA that allow 100% expensing of capex has outsized benefit for small caps to invest more upfront and accelerate their growth plans. DataTrek has opined that, rather than purely an early cycle trade as in days of yore, “small caps are a useful way to play a resilient US economy without the overhangs of potential AI overinvestment or disruption to software business models.”
So, as the year progresses and impressive earnings growth is revealed in this high-potential cap group, continued outperformance and a closing of the relative-value gap may ensue. After all, professors Fama & French demonstrated in 1992 that small caps historically outperform over time, i.e., the “size factor” in their original 3-factor asset pricing model (size, value, and risk) and then later in their enhanced 5-factor model (size, value, risk, profitability, and investment conservatism).
According to Nathan Moser of Impax Asset Management, improving fundamentals and expanding opportunity may allow small caps to continue their outperformance—perhaps for years to come. Growing M&A activity may also boost small caps. Moreover, a shift towards quality might allow the S&P 600 (SPSM) to outperform the Russell 2000 (IWM) given its quality bias (as companies must be profitable for S&P 600 inclusion), which has not been the case during the low-quality, speculative rallies that have been so dominant.
In addition, some underappreciated and speculative market segments that might have significant upside after being sold off earlier this year might include quantum computing, small modular nuclear reactors, energy and energy services, and battery storage/backup power companies that serve the power infrastructure buildout, plus perhaps some of the high-quality, wide-moat software and crypto-oriented companies that were so decimated—essentially cast into the trash bin (perhaps unjustly).
Also, as I discussed in my March post, central banks had been rapidly accumulating gold but then found themselves desperately needing to sell non-interest-bearing assets (like gold) to raise money to either offset lost oil export revenue or to pay the surging price of oil imports. This activity pushed up the US dollar. But that dynamic seems to have ended, as gold has stabilized and the dollar has pulled back. I continue to suggest investors accumulate hard assets like oil, agriculture, commodities, industrial metals, silver, copper, uranium, REEs, and land, as well as miners, power utilities, engineering & construction firms and equipment, and perhaps even 3D printing and modular construction. Also, bitcoin seems to have found solid support, has retaken its 50-day moving average, and is attempting an upside breakout of its 2-month trading range.
Weak GDP but strong corporate earnings:
The March ISM reports revealed some mixed news. The March ISM Manufacturing PMI report came in at 52.7, showing expansion for the third straight month, as did the New Orders Index at 53.5. Backlog of Orders registered expansion at 54.4. However, the Prices Index rose to 78.3, and the Employment Index fell to 48.7. As for the March ISM Services PMI report, it fell only slightly from 56.1 in February to 54.0, while Business Activity at 53.9 was the 21st consecutive month of expansion, and New Orders at 60.6 was the highest since February 2023 and the 10th consecutive month of expansion.
On the other hand, the Employment Index fell to a dismal 45.2, a level reminiscent of the Internet Bubble bust, GFC, and pandemic, and Prices Paid surged to 70.7, the fastest pace since October 2022. And in our “low hire, no fire” jobs market, real wage growth collapsed to 0.2% MoM and likely may go negative in April. The delinquency rates for credit cards and auto loans are rising, 401k hardship withdrawals hit a record high in 2025, real personal consumption expenditures has decelerated from around 3.5% YoY growth to under 2.5%, and the University of Michigan Consumer Sentiment Index dropped to 47.6 in April (an all-time low for the survey’s 74-year history, down from 53.3 in March, and the first time it has ever come in below 50). However, it’s important to mention that the ratio of disposable personal income to household debt service payments is 11.3% as of Q4 2025, which, although rising, is still not back up to the pre-pandemic average of around 11.7%.
And regarding GDP, normally Gross Domestic Product (GDP) and Gross Domestic Income (GDI) theoretically should be identical, as GDP measures activity from the spending side while GDI measures it from the income side. But in practice, they often diverge due to timing and measurement differences, which is only meaningful if the divergence persists. GDI historically has been the more reliable signal near turning points. For example, in past cycles, income growth and corporate profits have weakened before spending rolled over. GDP would continue to show growth, often supported by inventories, government spending, or credit, before eventually “catching down” to GDI. That’s why a gap where GDP looks strong but GDI is weak has typically been a warning sign.
Indeed, this dynamic has been a concern lately. But then the latest data flipped the script. The estimate for Q4 2025 GDP fell to just +0.5%, but this was largely driven by volatile components like trade and inventories. A cleaner measure, core GDP, was closer to +1.8%. More importantly, GDI rose +2.6% and corporate profits jumped +6.0%. That combination suggests the income side of the economy remains healthy, even if headline output looks soft. Thus, the data now point to underlying resilience, i.e., incomes and profits are growing while demand remains intact. So, given the backdrop of elevated interest rates and slowing momentum, it might be more likely that GDI and profit growth moderate rather than GDP accelerating significantly, but that’s not a sure thing—particularly if the war ends and the Fed eases. Either way, I believe the economy is more solid than the weak headline GDP suggests.
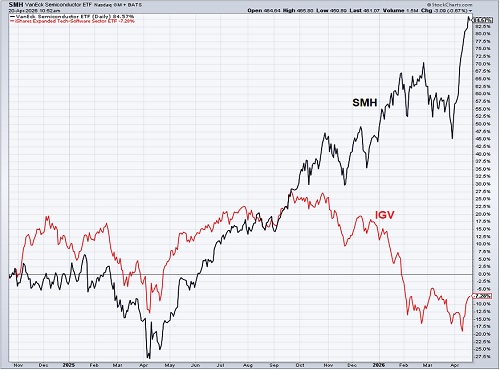
Regarding that jump in corporate profits despite the apparent economic malaise, consensus corporate earnings expectations remain impressively robust at 13% for Q1 (3% higher than the estimate was in January) and 17% for full-year 2026. The Tech sector is expected to see 45% EPS growth in Q1 (and an astounding 95% for semiconductors and chip equipment), accounting for a big portion of the S&P 500’s 13% growth. But notably, the performance divergence I pointed out in my February post has continued, with semiconductors (AI infrastructure proxy) hitting new all-time highs while enterprise software (perceived AI victim) hit a 2-year low (although it has made an oversold bounce of late). The concern is that AI agents will replace many enterprise SaaS functions like CRM, HR, customer service, and code review. Compute, memory, optics, networking, and power/thermal management make up the AI physical infrastructure layer where capital keeps flowing. The chart below displays the extreme divergence between semiconductors (SMH) and software (IGV) that began last June and then surged in October as software sold off (along with bitcoin) on obsolescence fears.
Keep in mind Jevons Paradox, which suggests that technological advancements increase resource efficiency, making the resource cheaper, so rather than reducing consumption or usage of the resource, it increases it, i.e., a bigger market outweighs lower pricing. Given their large user bases and distribution, the top SaaS companies should ultimately benefit from AI and automation leading to greater efficiencies, higher productivity, and lower costs, which should both increase margins and allow for lower pricing to clients.
One impediment to the growth of AI and datacenter construction has been the public backlash. Reports suggest that between 30-50% of datacenter projects planned for 2026 (totaling roughly $150 billion in value) are facing delays or outright cancellations due to power constraints, equipment shortages, and local community opposition, fueled by concerns over excessive electricity consumption, high water usage for cooling, noise pollution, as well as a general belief that AI is rapidly taking away jobs. As for AI’s insatiable need for power, there is also a shortage of skilled construction labor to build out the critical infrastructure. Former Energy Secretary Rick Perry has cited the skilled labor shortage mainly in HVAC, electrical, and carpentry, estimating a deficit of 400,000 skilled workers.
Still the growth is real, and the Industrials sector remains a consistent leader of the cycle. Engineering & construction firms have secular tailwinds like chip manufacturing—plenty of new business, pricing power, and backlogs. Also, the sector benefits both from war (through defense contracts) and from peace (through transportation and logistics normalization).
Inflation surge may have peaked:
The March CPI report showed a gasoline-driven surge on the headline number, but Core CPI (excluding food & energy) remains modest. Headline CPI rose +0.9% MoM and +3.3% YoY (a 2-year high), driven by a +10.9% MoM surge in energy prices (led by a +21.2% jump in gasoline prices) that accounted for about 75% of the entire MoM increase. Year-over-year, CPI jumped from +2.4% in February to +3.3% in March (the biggest one-month increase since Nov 2021). However, Core CPI (excluding food & energy) rose just +0.2% MoM and +2.6% YoY. Compare these numbers to February CPI at +2.4% YoY and Core CPI at +2.5% YoY—both of which were near their lowest YoY pace in five years (before the pandemic inflationary surge).
As for March PPI, it came in softer than expected (given the Iran war and the prior February surge), increasing only +0.5% MoM (vs. +1.1% consensus), which was the same as February’s MoM reading, and 4.0% YoY. However, it was driven primarily by the +8.5% MoM surge in energy prices while core PPI rose just +0.1% MoM and +3.8% YoY.
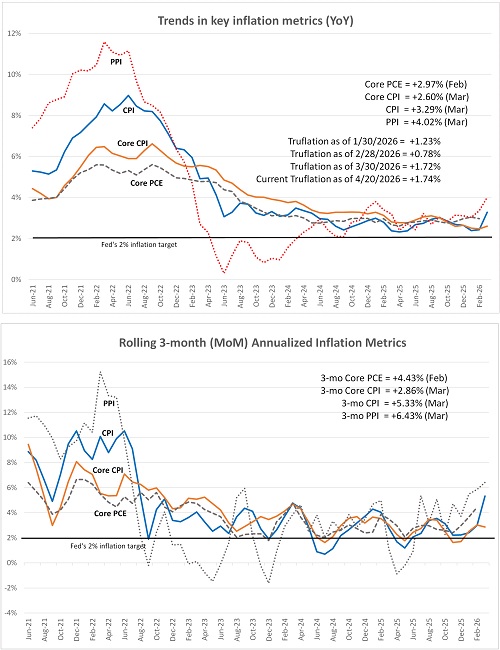
The upper chart below compares those headline YoY inflation numbers for PPI, CPI, Core CPI, and Core PCE, but I also like to look at the annualized 3-month rolling averages to get a better sense of the current trend, as shown in the lower chart. Of course, the trend looks ugly—although I’m not expecting it to continue on this path. Both charts show that after returning to some semblance of normalcy (near 2%), the current trend has turned back up (for now). The most recent of the metrics is March (for all but PCE), which shows 3-month rolling annualized trend of +6.4% for PPI and +5.3% for CPI but just +2.9% for Core CPI. It is evident that PPI tends to be more volatile month-to-month, thus the high annualized reading—which, again, I don’t expect will persist, particularly once the Strait of Hormuz is fully open.
Shelter continues to be the main driver of core inflation, but the lag time is finally reflecting the falling rents evident in other data. Rents rose +0.3% in March and are up at a +2.6% annualized rate over the last six months. So, CPI shelter, which accounts for 35% of CPI, should continue to trend lower and help contain both CPI and Core CPI. Perhaps the most troubling part of the CPI report is that wage growth has not kept up with price increases—as you might expect from a mostly event-driven (rather than structural) surge in prices. Regardless, real (inflation-adjusted) hourly earnings declined by -0.6% in March and have risen only +0.3% over the past year.
Looking ahead to the April inflation metrics, the Cleveland Fed Inflation Nowcast model predicts CPI of +3.58%, Core CPI of +2.56%, PCE of +3.61%, and Core PCE of +3.17%, as of 4/20. Another metric I follow is the real-time, blockchain based "Truflation” metric, which is updated daily based on 30 million data points and tends to presage CPI by several months. It is much better at reflecting current housing costs than CPI or PCE. As of 12/31/25 it had fallen to +1.99% YoY (vs. +2.65% for CPI); as of 1/30/26 it fell to +1.23% (vs. +2.39% for CPI); as of 2/28/26 it fell further to +0.78% (vs. +2.43% for CPI); and as of 3/30/26 it showed +1.72% as war-disrupted supply chains have driven up prices. Today 4/20, it shows just +1.74% after rising to 1.88% last week, as gasoline stabilized and food prices fell.
In addition, the New York Fed’s Global Supply Chain Pressure Index is a Z-score (the number of standard deviations from the mean) that seems to be settling in around the zero line (its historical average). For March, it sits at 0.68 standard deviations from the mean. So, although slightly elevated from the mean and rising slowly, it still sits near its normal range. GSCPI tends to presage PPI, which although more volatile, tends to presage CPI. So, contained supply chain pressures help moderate PPI, which suggests moderating CPI. CPI had been gradually receding over the past three years—until the Iran conflict.
Allow me to make a brief statement on gold and metals prices generally, which pulled back strongly from September-January surge and still have not fully recovered like stocks have. Gold and silver initially got the safe haven bid as geopolitical risks rose, the Fed seemed prepared to continue cutting rates (weakening the dollar), and many countries were working toward de-dollarization—all of which attracted the momentum traders. But then when the attack on Iran commenced, oil exploded higher, driving up inflation and interest rates, which pushed safe haven capital out of metals and into the US dollar and dividend/interest-paying assets as well as oil and energy stocks—and the momentum traders had to protect profits, cut losses, and deleverage.
As Michael Gayed of the Lead-Lag Report observed, “The surge in metals prices looks less like a return to 1970s-style inflation and more like a late-cycle speculative blowoff… Parabolic moves in silver, copper, and uranium resemble prior manias where valid long-term themes were priced far too quickly… True inflation is broad and persistent; today’s commodity strength is narrow and increasingly driven by positioning and narrative momentum... Economic signals beneath the surface point toward slowdown risks that historically precede deflationary shocks, not inflation spirals… History suggests the greatest opportunities in secular themes often emerge after speculative excess unwinds, not before.” I agree with his assessment.
Of course, war, blockades, oil prices and their impact on inflation and economic growth are dominating the news cycle. War is inflationary primarily because it creates severe supply chain disruptions, raises energy and raw material costs, and forces governments to dramatically increase spending—often financed by borrowing or printing money—which boosts demand while goods are scarce. This combination of rising production costs and high consumer demand creates a "shock" that drives up prices. Rising inflation can undermine investment, weigh on private consumption, and threaten macroeconomic stability. So, the prevailing view is that the war-driven spike in oil prices will cause inflation to continue to surge for the foreseeable future.
But the market doesn’t seem to be buying it. Keep in mind, higher oil and gasoline prices act like a tax on consumers, and taxes are inherently deflationary (without a commensurate increase in personal income to offset it) as they reduce disposable household income and consumer demand. As a result, many corporations and businesses see weakening demand for their products, which tends to push prices lower elsewhere in the economy. In other words, while gasoline may temporarily boost headline PPI and CPI, it simultaneously suppresses price pressures throughout much of the consumer economy. Also, as respected economist Ed Yardeni observed, “The US economy now requires significantly less energy per unit of GDP than in earlier decades, reflecting efficiency gains and a shift away from manufacturing toward services. As a result, oil price spikes are less inflationary and do less damage to real economic activity than in the past when energy intensity was much higher.”
Indeed, I am sticking to my falling inflation thesis. Once the smoke clears on the Iran war and assuming Kharg Island and its oil export capability survives, I expect a resumption in the many powerful, secular, disinflationary trends, such as the buildout and implementation of Gen AI, automation, and robotics; rising productivity; falling shelter and energy costs; a “peace dividend” (war is inflationary, so peace is the opposite); modest liquidity growth, and the deflation impulse on the world from China (due to its domestic struggles and falling consumer demand). In addition, although there might be some inflationary impacts of reshoring of manufacturing and diversification of supply chains in the short term, it is also adding redundancy and additional domestic industrial capacity, i.e., “duplicative excess capacity,” in the words of Treasury Secretary Scott Bessent (for national security purposes), which is ultimately disinflationary. Although the weaker dollar is somewhat inflationary, I don’t expect significantly more weakness.
Debt, liquidity, and Fed policy:
Another major risk factor to our economic growth trajectory is rising debt across the spectrum, including a low household savings rate, falling corporate savings (as cash flow and new debt are funding much of the reshoring and AI buildout), deteriorating private credit markets, and the rapidly growing federal debt (now exceeding $39 trillion) in the face of rising yields. Of course, growing debt (exacerbated by the Iran conflict) adds to the nonproductive demand (interest payments) on the budget and thus stunts GDP growth by the crowding out private investment and limiting discretionary spending on growth projects (that provide an ROI).
Furthermore, global liquidity growth has slowed, according to liquidity expert Michael Howell of CrossBorder Capital. An important component of global liquidity is US M2 money supply, which rose only 4.9% over the past year (vs. the 6% pre-pandemic annual trend), and was worsened by the deflationary impact of a stronger dollar (acting as a geopolitical safe haven). However, the dollar peaked on 3/30 and has been falling in April, which has helped to support US and global liquidity (as foreign currencies can buy more things priced in weaker dollars) and thus provide a tailwind to asset prices. Also, tax refunds—and soon tariff refunds—serve to enhance M2 by putting cash back into the financial system, and now the Treasury General Account (TGA) is being drawn down (thus boosting liquidity) after being built up during Q1 from tax receipts (which was draining liquidity).
While the US has been facing rising debt that has been exacerbated by the Iran conflict, the most pressing concern is not a credit crisis or default but instead a more structural issue, i.e., the increasing share of the federal budget used for nonproductive interest payments on debt and programs that support consumption rather than generate ROI. In fact, this shift began over 50 years ago, stunting economic growth, crowding out private investment, and lowering the economy’s growth potential.
History shows that debt to fund productive assets like infrastructure, innovation, and education can sustain growth and even pay for itself over time, while borrowing for entitlements and debt service does not. Unfortunately, the political and demographic realities make it nearly impossible to reverse course without severe economic fallout. Argentina under President Milei seems to be doing the impossible with his "shock therapy,” achieving fiscal surpluses and lower inflation (to the lowest since 2018) through spending cuts, state job cuts, reduced subsidies, deregulation, and an independent central bank. But it is a rarity due to the resulting social hardship of the transition.
And here at home, on the theme of smaller government, lower taxes, deregulation, and reducing nonproductive expense, it’s interesting that The Cato Institute estimates that Americans spent 7.1 billion hours complying with the tax code, which it says, “is the equivalent to 3.4 million full-time American workers—almost the population of Los Angeles—doing nothing but tax paperwork for a full year.” Sheesh! Talk about nonproductive expenditures.
Unless our policymakers redirect fiscal priorities toward less red tape and more investment in productive capacity, the US economy might stay trapped in a cycle of low growth, rising obligations, and declining returns. Technological innovation may be the only way out, most notably the AI transformation, which intends to raise productivity, restore growth (above 3% annually), and ease the fiscal burden. As NVIDIA CEO Jensen Huang gushed, “AI is the most powerful technology force of our time… AI will revolutionize every industry, from healthcare to transportation."
The next FOMC rate decision is 4/29. Of course, the FOMC is trying to find a balance between the stagnant jobs market and sticky inflation, while also considering the impact on rising federal debt service of higher interest rates. As of 4/20, CME Group fed funds futures now give a 47% chance of at least one 25-bp cut by year end, and 10% odds of 50 bps (to 3.00-3.25%). But this has been quite a moving target as the daily news can quickly shift the odds dramatically, even intraday. At one point, there was a 25% chance of a rate hike!
Given the current situation in Iran, I don’t expect falling inflation prints, at least until the hostilities end, but I don’t expect a big surge in inflation either. So, I still think the overall picture still suggests room for another Fed rate cut once the Strait of Hormuz is fully open (and certainly not a rate hike in our near future!). In my view, today’s fed funds rate already should be 3.00%.
Why not hike rates now to “fight inflation”? To be sure, the textbook reaction to rising CPI, no matter the causes, is to raise rates, but it would create a dangerously recessionary duo of higher oil price coupled with higher interest rates.
The Natixis team wrote, “When inflation is driven by supply constraints, rather than excess demand, the objective should not be limited to reducing inflation as quickly as possible. It should be to minimize total economic damage over time… Monetary policy is designed to manage demand. When inflation arises from excess demand, the prescription is clear—hike rates. But when inflation arises from supply shocks (today’s Iran Conflict, COVID, or the Russia/Ukraine war), the problem changes but the tool does not….”
Fed monetary policy actually has been relatively tight following the surge in the money supply during 2020-21 in response to the pandemic lockdowns. Prior to the pandemic, M2 money supply grew about 6.0%/year while inflation remained contained, but over the year from February 2025 to February 2026 (the latest reading), M2 rose only 4.9%. However, US liquidity has benefited from foreign direct investment (FDI), the majority of which does not show up in M2 thus creating “shadow liquidity” that has helped inflate our capital markets.
Longer term, rather than broad divestment out of the US and substantial de-dollarization, as some commentators predict, I see the US dollar and Treasuries retaining their longstanding role as a safe haven for global capital due to their unmatched size and liquidity. In addition, the US boasts deep financial markets, the rule of law, and vigorous defense of property rights, not to mention our entrepreneurial culture, vast human capital, disruptive innovation, and our corporate focus on shareholder value, global scalability, wide protective moats, and reliable and consistently strong earnings growth, free cash flow, margins, return ratios, and general resilience (i.e., our adaptive “can-do” spirit).
Nevertheless, diversification should keep a bid under gold as a hard-money alternative to fiat currencies and sovereign debt (as deflationary trends, shrinking populations, and stagnant economies befall our trading partners), and industrial demand for silver and copper should go parabolic with the rapid buildout AI datacenter and power generation facilities as well as adoption of electric vehicles, solar energy (PV cells), automation, and robotics, not to mention safe-haven buying due to global uncertainties.
Indeed, the demand for computing capacity is growing so fast for an already overburdened public grid that engineers and corporate titans are trying to decide whether the answer is in small modular nuclear reactors or in orbital datacenters (with high-efficiency solar power on satellites in sun-synchronous orbits that avoid Earth's shadow and atmospheric friction). And the sectors that benefit from sustained energy disruption and $80-100 oil, including defense, energy/power infrastructure, and shipping, are not the sectors most investors are watching.
You can obtain my special report, “Future of Energy: the Lifeblood of an Economy,” which goes into detail on this topic and presents some of Sabrient’s top picks, by visiting https://MoonRocksToPowerStocks.com.
Final comments:
The ongoing oil supply disruption in both the Persian Gulf and Red Sea has illustrated in stark terms that the global economy has long needed to adapt its energy markets and supply chains to be more flexible and less concentrated—much like the reshoring of manufacturing and diversification of supply chains we have been seeing in the wake of the pandemic and the recent trade negotiations. For example, we are already seeing Very Large Crude Carriers (VLCC) rerouting to the US Gulf Coast to buy substitute crude oils, like West Texas Intermediate (WTI) in place of Arab Light, or light low-sulfur (“sweet”) WTI Midland in place of UAE’s Murban, or medium-sulfur (“sour”) Mars Blend from US offshore production in place of Iran Light. Much of these new shipments are mostly destined for refineries in Asian countries like China, Japan, South Korea, and Taiwan. Perhaps buying from the US will become the new normal for many of these oil-deficit countries; it would certainly boost our GDP.
Because the Mississippi Delta silt keeps the coastline relatively shallow, VLCCs must anchor well offshore and have smaller “lightering” vessels shuttle the crude oil to them. Historically, when US was importing large amounts of crude, the lightering went the other direction, with Middle East crude lightered to Gulf Coast refineries. Today’s export operations involve “reverse lightering.” (Fun fact: I once spent two years working in Chevron’s Pascagoula, MS refinery port operations in the 1990s, both inbound lightering of foreign crude and outbound shipping of refined product to US ports. In fact, both my daughters were born in nearby Mobile, AL, where we lived.)
Nevertheless, the disruption has kept spot shipping rates high, which has been good for tanker stocks. The disruption has also jacked up insurance cost. Before the conflict, an oil tanker transiting the Strait of Hormuz might be charged a risk premium of about 0.10-0.15% of the ship’s hull value. But at the height of the conflict, those rates (if you could find coverage at all) had spiked to as much as 7.5-10% (i.e., 100x higher). So, if the hull value of a VLCC is $140 million, it might have cost $10-14 million in insurance premium for a single transit. The largest Ultra Large Crude Carriers (ULCC) can be worth $200 million.
This whole scenario has laid bare a vulnerability that’s been building for decades: the global economy’s dependence on critical supplies of crude oil, LNG, nitrogen-based fertilizers (e.g., urea, ammonia), petrochemicals, and industrial metals (e.g., aluminum) sourced from the volatile and politically unstable Middle East, where shipping can be so easily disrupted at the choke point of the Strait of Hormuz. Oil and natural gas markets are tightly interconnected, so even localized disruptions can ripple across continents, driving up costs of transportation and manufacturing—and ultimately food, as critical fertilizers, many of which depend on natural gas or are exported from geopolitically sensitive areas, are even more fragile. When supply chains are threatened, the impact doesn’t stay confined to energy markets; it hits agricultural yields, food prices, and inflation globally. In other words, what looks like a regional conflict quickly becomes a global economic stress test.
Yes, energy is the lifeblood of the economy, and nowhere is the fallout from disrupted supplies more visible than Europe, where prices are sky-high and in fact on the verge of running out of fuels (most imminently jet fuel). In particular, Germany made the conscious ideological decision to shut down all of its vast nuclear plants (not mothball for the future, but fully decommission, which it completed in 2023) and trade energy independence and reliability for the utopian pursuit of complete decarbonization and the removal of all (overblown) risk of nuclear meltdown. They had become completely reliant on Russian gas (which is now completely eliminated), imported pipeline natural gas from Norway (limited supply), and LNG shipments (from the US and Qatar). And because the country’s vast renewable energy farms are non-dispatchable, when wind/solar production is low, it also imported electricity from France’s nuclear plants. It’s a decision they now regret.
The Trump Administration is seeking to keep the US from succumbing to the same cultural and economic fate that has befallen Europe, UK, and much of the West by circling the wagons around North and Central America (plus Venezuela) to create a de facto “self-sufficiency zone,” with the US as the hegemon, independent of critical materials and energy supplies from hostile nations. It also seeks to promote capitalism and win the race for AI, blockchain, quantum, and space dominance. Incentivizing surplus domestic energy production (“drill, baby, drill”) that can be exported to the rest of the world (as a preferred alternative to Middle East suppliers) is part of that agenda, thus boosting GDP, fostering high-paying jobs, and improving our trade balance, while potentially generating billions of dollars in tax revenue for federal and state governments.
To comprehend how the world allowed Iran’s radical jihadist regime to fester for 47 years and spread mayhem without ever confronting it, you must understand that the risk wasn’t just military, it was systemic. Any direct confrontation could trigger energy shocks, destabilize allied economies, and create second-order effects like political unrest due to rising costs of living—and Western populations don’t like discomfort. And because there is always another election coming up, politicians first and foremost seek to avoid hard decisions that might cause discomfort. As a result, policymakers chose containment strategies, sanctions, and diplomacy rather than decisive confrontation, even as Iran expanded its regional influence through proxy groups and asymmetric tactics. From a purely strategic standpoint, kicking the can down the road was seen as the least disruptive option in the near term.
This helps explain why previous US presidents historically approached Iran with caution, reluctant to challenge the saber-rattling, apocalyptic, theocratic regime for fear of a blockade or increased terrorist activity. But that approach came with a cost. Over time, Iran continued to build out its military and technological capabilities while deepening ties with major powers like China and Russia. Each US president stood idly by (or even tried to pay them off to encourage good behavior) while Iran continued to increase its military and nuclear capabilities, intimidate its neighbors, and fund terrorism and chaos around the Middle East and beyond through its proxies, including upon Israel and US military bases.
This gradually shifted the balance of power and increased the potential consequences of any future conflict. The longer the situation persisted, the more complex and dangerous it became—not just militarily, but economically and diplomatically. What may have once been a contained regional issue began to evolve into a broader geopolitical challenge with global implications. Tensions ultimately reached a breaking point; the culmination of years of strategic deferral in which the perceived risks of acting earlier were outweighed by the growing risks of waiting too long. The argument had shifted from whether to confront the risk to when and under what conditions. Indeed, facing down this growing threat had to happen soon, before Iran’s military capabilities—supported by China and Russia—reached the point of no return, where deterrence becomes far more difficult, the costs of intervention multiply exponentially, and the potential fallout of military confrontation could be catastrophic.
As described by DataRepublican on Substack, “The convergence of all three (nuclear capability at threshold, terror proxy network at its peak, Hormuz leverage [i.e., control of the world’s most critical oil chokepoint]) at the same moment created the strategic logic for preemption before any one of the three became impossible to address.” So, here we are today.
Of course, Iran’s regional power came solely from its vast oil reserves. Venezuela had a similar situation, but as its production dwindled due to incompetence and corruption, it also became a narco-state and profited by cozying up to the likes of China, Russia, and Iran, allowing them to establish a foothold in the Western Hemisphere and place operations, personnel, and surveillance right in our backyard while tapping into Venezuela’s vast oil reserves by merely paying off its corrupt dictatorial leadership. But ultimately, Venezuela’s regime turned out to be much more rational, with life and wealth being its priorities, while Iran is led by a fanatical, apocalyptic theocracy that embraces death in service to God.
Iran’s stubborn intransigence reminds me of the opening battle scene in the movie Gladiator between the Romans and Germanic tribes when second-in-command Quintus states, “People should know when they are conquered.” Of course, nobody wants to “conquer” Iran. President Trump doesn’t really want to destroy its critical power infrastructure and bridges, either. That would be a humanitarian disaster, likely creating another painful mass migration situation. He just wants Iran’s leaders to behave like civilized members and active participants in the global economic community. The olive branch or “carrot” has not worked for nearly 50 years. The jihadist regime continues to foment widespread terrorism, with the sworn objective of “Death to America, the Great Satan,” and aggressively pursue development of ICBMs and nuclear warheads to dominate the Middle East and ultimately destroy Israel and the US and create a global caliphate free of infidels. It’s tough to bargain with such a monomaniacal mindset.
So, regarding Pope Leo’s veiled criticism of President’s Trump actions against Iran, the Catechism of the Catholic Church (CCC) includes the following passages. CCC 2265 regarding “Self Defense” admonishes, “Legitimate defense can be not only a right but a grave duty for one who is responsible for the lives of others. The defense of the common good requires that an unjust aggressor be rendered unable to cause harm. For this reason, those who legitimately hold authority also have the right to use arms to repel aggressors against the civil community entrusted to their responsibility.” And CCC 2308 regarding “Just War Doctrine” asserts, “All Citizens and all governments are obliged to work for the avoidance of war. However, as long as the danger of war persists and there is no international authority with the necessary competence and power, governments cannot be denied the right of lawful self-defense, once all peace efforts have failed.” Something tells me the Pope is well aware of these passages, but you might not be.
Moon Rocks to Power Stocks the book, and Sabrient Scorecards the tool:
I welcome you to learn more about Sabrient’s process-driven, growth-at-a-reasonable-price active-selection methodology as revealed by Sabrient founder David Brown in his new book, Moon Rocks to Power Stocks: Proven Stock Picking Method Revealed by NASA Scientist Turned Portfolio Manager. It is also available in both paperback and eBook formats on Amazon (an international bestseller!). It teaches how to methodically and strategically build wealth in the stock market. David describes his path from NASA engineer in the Apollo Program to creating quantitative models for ranking stocks and building portfolios in four distinct investing styles—growth, value, dividend, and small cap. You also get two Bonus Reports on the Future of Energy and Space Exploration, each with our top picks.
Or if you just want to find out how to access the Sabrient Scorecard, an investor tool that provides access to our proprietary scores for all stocks to make the stock evaluation process easy for idea generation and portfolio monitoring, along with our Top 30 stocks each week for 4 distinct investing strategies—Growth, Value, Dividend, and Small Cap—I welcome you to visit: https://www.moonrockstopowerstocks.com/sabrient-scorecard

Latest Sector Rankings
Relative sector rankings are based on Sabrient’s proprietary SectorCast model, which builds a composite profile for each of over 1,500 equity ETFs based on bottom-up aggregate scoring of the constituent stocks. The Outlook Score is a Growth at a Reasonable Price (GARP) model that employs a forward-looking, fundamentals-based multifactor algorithm considering forward valuation, historical and projected earnings growth, the dynamics of Wall Street analysts’ consensus earnings estimates and recent revisions (up or down), quality and sustainability of reported earnings, and various return ratios. It helps us predict relative performance over the next 3-6 months.
In addition, SectorCast computes a Bull Score and Bear Score for each ETF based on recent price behavior of the constituent stocks on particularly strong and weak market days. A high Bull score indicates that stocks held by the ETF recently have tended toward relative outperformance when the market is strong, while a high Bear score indicates that stocks within the ETF have tended to hold up relatively well (i.e., safe havens) when the market is weak. Outlook score is forward-looking while Bull and Bear are backward-looking.
As a group, these three scores can be helpful for positioning a portfolio for a given set of anticipated market conditions. Of course, each ETF holds a unique portfolio of stocks and position weights, so the sectors represented will score differently depending upon which set of ETFs is used. We use the iShares that represent the ten major U.S. business sectors: Financials (IYF), Technology (IYW), Industrials (IYJ), Healthcare (IYH), Consumer Staples (IYK), Consumer Discretionary (IYC), Energy (IYE), Basic Materials (IYM), Telecommunications (IYZ), and Utilities (IDU). Whereas the Select Sector SPDRs only contain stocks from the S&P 500 large cap index, I prefer the iShares for their larger universe and broader diversity.
The table below shows the latest fundamentals-based Outlook rankings and our full sector rotation model:
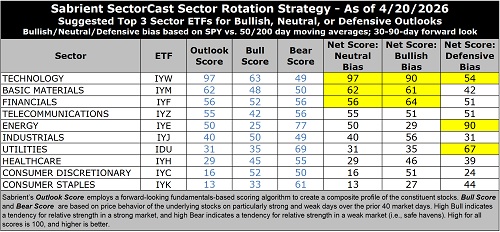
The latest rankings display a bullish bias, in my view, given that cyclicals and secular growth sectors dominate the top of rankings heading into Q1 earnings reporting season, and the top 5 sectors all score 50 or better. Next 12 months (NTM) analyst earnings forecasts look quite strong, and investors seem to be looking beyond the unknown impacts of war and the on/off shipping blockade on energy supply chains. FactSet says consensus expectation for S&P 500 Q1 2026 earnings growth is 13%, and expected full-year earnings growth is 17%.
Technology (dominated by the mega-cap Big Tech titans and AI-driven highflyers) remains firmly at the top with a robust Outlook score of 97, reflecting the high quality of those juggernauts despite having the highest forward P/E at 26.9x. However, this multiple is still down from the 31x it reached several months ago while other sectors’ valuations have risen, reflecting the mean reversion and rotation we in the market. With a consensus NTM EPS growth estimate rising to 23.4%, the forward PEG (ratio of P/E to EPS growth) is just 1.15. Keep in mind, investors tend to be quite willing to pay up for strong growth, so the relative value gap we saw a few weeks ago is closing.
Tech also displays solidly positive sell-side analyst earnings revisions, by far the highest profit margins and return ratios, and the best insider sentiment (open market buying). Because many Tech stocks are riding secular growth trends (i.e., little cyclicality), no other sector comes close to the consistent sales growth, margins, operating leverage, and return on capital. And Tech not only benefits from its own product development and productivity gains, but those products help other companies with their product development, product delivery, and productivity—so Tech benefits by helping all sectors grow and prosper.
After Tech, the next five sectors are Basic Materials, Financials, Telecom, Energy, Industrials. At the bottom of the rankings are cyclical sector Consumer Discretionary and noncyclical defensive sector Consumer Staples.
Keep in mind, the Outlook Rank does not include timing, momentum, or relative strength factors, but rather reflects the consensus fundamental expectations at a given point in time for individual stocks, aggregated by sector.
To learn more about how you can access our weekly Stock and ETF Scorecards, please visit:
https://www.moonrockstopowerstocks.com/sabrient-scorecard
Sector Rotation Model and ETF Trading Ideas
Our rules-based Sector Rotation model, which appropriately weights Outlook, Bull, and Bear scores in accordance with the overall market’s prevailing trend (bullish, neutral, or defensive), switched from a defensive to a bullish bias when the S&P 500 leapt above both its 50-day and 200-day moving averages simultaneously. (Note: In this model, we consider the bias to be bullish from a rules-based trend-following standpoint when SPY is above both its 50-day and 200-day simple moving averages, but neutral if it is between those SMAs while searching for direction, and defensive if below both SMAs.)
As highlighted in the table above, the Sector Rotation model suggests holding Technology (IYW), Financials (IYF), and Basic Materials (IYM), in that order. Similarly, if you prefer to take a neutral stance, it also suggests holding Technology, Basic Materials, and Financials. However, if you prefer the maintain a defensive stance, it suggests holding Energy (IYE), Utilities (IDU), and Technology.
Here is an assortment of other interesting ETFs that are scoring well in our latest rankings: iShares MSCI Global Silver and Metals Miners (SLVP), VanEck Gold Miners (GDX), State Street SPDR S&P Pharmaceuticals (XPH), Invesco Dorsey Wright Technology Momentum (PTF), SP Funds S&P Global Technology (SPTE), Janus Henderson Global Artificial Intelligence (JHAI), Gabelli Global Technology Leaders (GGTL), Columbia Select Technology (SEMI), First Trust Confluence BDC & Specialty Finance Income (FBDC), State Street SPDR Oil & Gas Exploration & Production (XOP), iShares Future AI & Tech (ARTY), Guinness Atkinson Smart Transportation & Technology (MOTO), Touchstone Sands Capital US Select Growth (TSEL), AXS Esoterica NextG Economy (WUGI), Invesco Energy Exploration & Production (PXE), Abacus FCF Innovation Leaders (ABOT), Franklin Intelligent Machines (IQM), Smart Earnings Growth 30 (SGRT), Aztlan Global Stock Selection DM SMID (AZTD), Virtus US Dividend (VUS), and First Trust Nasdaq ABA Community Bank (QABA). All score in the top decile (90-100) of Sabrient’s Outlook scores.
As always, I welcome your thoughts on this article! Please email me anytime. Any and all feedback is appreciated. Also, please let me know of your interest in any of Sabrient’s new indexes for ETF investing, such as High-Quality Growth, SMID-Cap High-Quality Growth, High-Quality Growth & Income, High-Quality Value, High-Quality Energy, Defensive Equity, Space Exploration & Off-Earth Sustainability, and the Sabrient Select High-Conviction Portfolio (similar to our Baker’s Dozen portfolio, but actively managed).
IMPORTANT NOTE: I post this information periodically as a free look inside some of our institutional research and as a source of some trading ideas for your own further investigation. It is not intended to be traded directly as a rules-based strategy in a real money portfolio. I am simply showing what a sector rotation model might suggest if a given portfolio was due for a rebalance, and I do not update the information on a regular schedule or on technical triggers. There are many ways for a client to trade such a strategy, including monthly or quarterly rebalancing, perhaps with interim adjustments to the bullish/neutral/defensive bias when warranted, but not necessarily on the days that I happen to post this article. The enhanced strategy seeks higher returns by employing individual stocks (or stock options) that are also highly ranked, but this introduces greater risks and volatility. I do not track performance of the ideas mentioned here as a managed portfolio.
Disclosure: At the time of this writing, of the securities mentioned, the author held positions in SPY, FTLS, LNG, XOP, gold, bitcoin.
Disclaimer: Opinions expressed are the author’s alone and do not necessarily reflect the views of Sabrient. This newsletter is published solely for informational purposes only. It is neither a solicitation to buy nor an offer to sell securities. It is not intended as investment advice and should not be used as the basis for any investment decision. Individuals should consider their personal financial circumstances in acting on any opinions, commentary, rankings, or stock selections provided by Sabrient Systems. Sabrient makes no representation that the techniques used in its rankings or analyses will result in profits. Trading involves risk, including possible loss of principal and other losses, and past performance is no guarantee of future results. Investment returns will fluctuate, and principal value may either rise or fall. Sabrient disclaims liability for damages of any sort (including lost profits) arising from the use of or inability to use its rankings or analyses. Information contained herein reflects our judgment or interpretation at the time of publication and is subject to change without notice.
Copyright © 2026 Sabrient Systems, LLC. All rights reserved.