Sector Detector: Improving market breadth, AI frenzy, and a Fed pause
 by Scott Martindale
President & CEO, Sabrient Systems LLC
After five straight weeks of gains—goosed by a sudden surge in excitement around the rapid advances, huge capex expectations, and promise of Artificial Intelligence (AI), and supported by the CBOE Volatility Index (VIX) falling to its lowest levels since early 2020 (pre-pandemic)—it was inevitable that stocks would eventually take a breather. Besides the AI frenzy, market strength also has been driven by a combination of “climbing a Wall of Worry,” falling inflation, optimism about a continued Fed pause or dovish pivot, and the proverbial fear of missing out (aka FOMO).
Once a debt ceiling deal was struck at the end of May, a sudden jump in sentiment among consumers, investors, and momentum-oriented “quants” sent the mega-cap-dominated, broad-market indexes to new 52-week highs. Moreover, the June rally broadened beyond the AI-oriented Tech giants, which is a healthy sign. AAIA sentiment moved quickly from fearful to solidly bullish (45%, the highest since 11/11/2021), and investment managers are increasing equity exposure, even before the FOMC skipped a rate hike at its June meeting. Other positive signs include $7 trillion in money market funds that could provide a sea of liquidity into stocks (despite M2 money supply falling), the US economy still forecasted to be in growth mode (albeit slowly), corporate profit margins beating expectations (largely driven by cost discipline), and improvements in economic data, supply chains, and the corporate earnings outlook.
Although the small and mid-cap benchmarks joined the surge in early June, partly boosted by the Russell Index realignment, they are still lagging quite significantly year-to-date while reflecting much more attractive valuations, which suggests they may provide leadership—and more upside potential—in a broad-based rally. Regardless, the S&P 500 has risen +20% from its lows, which market technicians say virtually always indicates a new bull market has begun. Of course, the Tech-heavy Nasdaq badly underperformed during 2022, mostly due to the long-duration nature of growth stocks in the face of a rising interest rate environment, so it is no surprise that it has greatly outperformed on expectations of a Fed pause/pivot.
With improving market breadth, Sabrient’s portfolios—which employ a value-biased Growth at a Reasonable Price (GARP) style and hold a balance between cyclical sectors and secular-growth Tech and across market caps—this month have displayed some of their best-ever outperformance days versus the benchmark S&P 500.
Of course, much still rides on Fed policy decisions. Inflation continues its gradual retreat due to a combination of the Fed allowing money supply to fall nearly 5% from its pandemic-response high along with a huge recovery in supply chains. Nevertheless, the Fed has continued to exhibit a persistently hawkish tone intended to suppress an exuberant stock market “melt-up” and consumer spending surge (on optimism about inflation and a soft landing and the psychological “wealth effect”) that could hinder the inflation battle.
Falling M2 money supply has been gradually draining liquidity from the financial system (although the latest reading for May showed a slight uptick). And although fed funds futures show a 77% probably of a 25-bp hike at the July meeting, I’m not so sure that’s going to happen, as I discuss in today’s post. In fact, I believe the Fed should be done with rate hikes…and may soon reverse the downtrend in money supply, albeit at a measured pace. (In fact, the May reading for M2SL came in as I was writing this, and it indeed shows a slight uptick in money supply.) The second half of the year should continue to see improving market breadth, in my view, as capital flows into the stock market in general and high-quality names in particular, from across the cap spectrum, including the neglected cyclical sectors (like regional banks).
Regardless, the passive broad-market mega-cap-dominated indexes that were so hard for active managers to beat in the past may well face high-valuation constraints on performance, particularly in the face of slow real GDP growth (below inflation rate), sluggish corporate earnings growth, elevated valuations, and a low equity risk premium. Thus, investors may be better served by strategic-beta and active strategies that can exploit the performance dispersion among individual stocks, which should be favorable for Sabrient’s portfolios—including Q2 2023 Baker’s Dozen, Small Cap Growth 38, and Dividend 44—all of which combine value, quality, and growth factors while providing exposure to both longer-term secular growth trends and shorter-term cyclical growth and value-based opportunities. (Note that Dividend 44 offers both capital appreciation potential and a current yield of 5.1%.)
Quick reminder about Sabrient’s stock and ETF screening/scoring tool called SmartSheets, which is available for free download for a limited time. SmartSheets comprise two simple downloadable spreadsheets—one displays 9 of our proprietary quant scores for stocks, and the other displays 3 of our proprietary scores for ETFs. Each is posted weekly with the latest scores. For example, Lantheus Holdings (LNTH) was ranked our #1 GARP stock at the beginning of February before it knocked its earnings report out of the park on 2/23 and shot up over +20% in one day (and kept climbing). At the start of March, it was Accenture (ACN). At the beginning of April, it was Kinsdale Capital (KNSL). At the beginning of May, it was Crowdstrike (CRWD). At the start of June, it was again KNSL (after a technical pullback). All of these stocks surged higher—while significantly outperforming the S&P 500—over the ensuing weeks. Most recently, our top-ranked GARP stock has been discount retailer TJX Companies (TJX), which was up nicely last week while the market fell. Feel free to download the latest weekly sheets using the link above—free of charge for now—and please send us your feedback!
Here is a link to my full post in printable format. In this periodic update, I provide a comprehensive market commentary, including discussion of inflation and why the Fed should be done raising rates, stock valuations, and the Bull versus Bear cases. I also review Sabrient’s latest fundamentals based SectorCast quant rankings of the ten U.S. business sectors and serve up some actionable ETF trading ideas. Read on…
Market commentary:
Starting in mid-March, despite the debt ceiling standoff, weakening economic data, concerns about Fed monetary policy, the stock market cautiously crept higher as it climbed the proverbial “wall of worry.” Then in May, stocks went flat as interest rates spiked amid ultra-hawkish Fed rhetoric. But June brought a debt-ceiling deal, a sudden surge of enthusiasm about the promise of artificial intelligence, a continued collapse in inflation, a Fed pause on new rate hikes, improving economic and housing data, and rising sentiment among both consumers and investors—all of which has pushed the mega-cap-dominated, broad-market indexes to new 52-week highs. Still, valuations remain quite elevated for the cap-weighted S&P 500 (SPY) and Nasdaq 100 (QQQ), while the average stock is much more reasonably priced. So, assuming the May PCE reading on 6/30 and the June CPI reading on 7/12 are both favorable and the Fed continues its pause, mean reversion suggests small-mid caps and value stocks might have some runway.
Inflation and Fed policy:
CPI continued its steady decline from its mid-2022 high of 9.1%, falling further from its April reading of 4.9% to 4.0% in May. PPI has fallen even faster, going from 11.2% in mid-2002 to 2.3% in April and 1.1% in May. This is due to a combination of the Fed allowing money supply to fall nearly 5% from its pandemic-response high along with a huge recovery in supply chains, with the Global Supply Chain Pressure Index (GSCPI) falling from a December 2021 high of +4.31 to the May reading of -1.71 (a level not seen since the 2008 Financial Crisis), which I discuss further below. Notably, the average monthly annualized CPI and PPI readings over the period 2011-to-current are equal at 2.6%. So, assuming both indexes eventually equalize again (i.e., mean reversion), it suggests CPI will continue to fall over the coming months to match PPI.
As a result of this progress, the Fed decided at its June FOMC meeting to pause on another interest rate hike to see how the data progresses from here. Commentators called this move a “hawkish pause” following a “dovish hike” in May. Commenting on the impressive strength in stocks, Bob Pisani of CNBC said, “The markets are pushing the limits of the soft-landing story.” In response, the Fed has presented a persistently hawkish tone intended to suppress an exuberant stock market “melt-up” and consumer spending surge (on optimism about inflation and a soft landing and the psychological wealth effect) that could hinder the inflation battle.
Indeed, the Fed seems to have a strong interest in “talking down” consumer demand and stock prices without having to raise rates much further. For one, it wants to avoid having to make ever-higher interest payments on rising sovereign debt levels. And secondly, Eric Peters of One River Capital has opined a contrarian view that because rate hikes lead to higher interest income for individual bondholders, it can lead to greater spending that spurs consumer demand and inflationary pressures.
Unfortunately, core CPI is proving a bit stickier, falling only slightly to 5.3% in May from 5.5% in April. The June readings will be released 7/12-13, two weeks before the July FOMC meeting/decision on monetary policy. Although the important “housing rents” category has not yet dropped, recent housing data suggests it may soon soften over the coming months, adding further deflationary pressure. In addition, the jobs market remains strong and has been generating wage inflation, particularly in Consumer Services, but with more layoffs announced by large corporations while average hours worked is down, cracks may be emerging in the job market.
Despite the apparent resilience of the economy to elevated rates, I think rates are too high already, creating an extreme increase in debt service costs whenever maturing debt must be rolled over and reissued, particularly given how highly leveraged and “financialized” the US and global economies became during ZIRP. After all, when the Fed adds liquidity to the financial system, the value of risk assets tends to go up, but when the Fed drains liquidity from the financial system, risk assets tend to struggle. (Note: Once the Fed pivots and begins cutting rates, it should be good for gold and gold miners, no matter what the broad stock indexes do.) Also, the longer interest rates remain at their current levels, the more liquidity is drained out of the financial system as more borrowers are forced to refinance their maturing debts at higher rates, which means a greater proportion of corporate cash flow will be earmarked for debt service, which cuts into profit margins and capex.
Further exacerbating the situation, tighter bank lending standards (resulting from the banking crisis) create “stealth tightening.” And yet another form of stealth tightening is the action in the Treasury General Account (the federal government’s daily operating account) stemming from the prolonged debt ceiling standoff. The TGA held about $550 billion at the end of January, but it was drawn down to less than $50 billion before the debt ceiling was raised—which means that new issuances of Treasuries will be used to re-fund the TGA to around $600 billion.
So, it seems to me that the Fed should be done raising rates. That’s not to say it will cut rates anytime soon (unless the economy falters), but I have been opining for several months that it has already gone beyond the neutral rate, so cuts will come eventually—perhaps by winter.
Likewise, Jeffrey Gundlach of DoubleLine Capital recently said that the Fed should be done tightening and may have overtightened, noting cautionary signals like the “significant decrease” in average hours worked and the “massively recessionary” PMI and ISM manufacturing indexes. Also, JP Morgan global strategist Jordan Jackson said, "We're seeing signs that the labor market will start to come under pressure…I think the Fed should be done.”
Furthermore, as Eric Peters of One River Capital has theorized, although rising interest rates are designed to suppress consumer demand, they also lead to higher interest income for individuals, which can lead to greater spending that boosts both demand and inflationary pressures. Peters said, “…there is always a trade-off that central banks must make between price stability and financial stability. To deny this is to invite markets to press our policy makers to the point where they much choose one or the other.”
Although consumer spending remains solid, it continues to shift from mostly goods (especially during the pandemic lockdowns) to services. Goods inflation is quite low now, while services inflation persists. May retail sales were up +1.6% YoY, which is well below the +4.0% CPI, but core sales were up +4.4% YoY and sales at restaurants and bars were up +8.0% YoY.
According to the Atlanta Fed’s Wage Growth Tracker, wage growth for May was +6.0%, which is down from last summer’s +6.7% peak but still well above both the 2016-2020 average of +3.5% and CPI inflation (since February), which has supported spending (as shown in the chart below).
![]()
The Cleveland Fed’s “Inflation Nowcasting” for June is 3.2% (for both CPI and PCE), which should keep the Fed on pause for July as well (even though fed funds futures show 77% likelihood of a 25-bp hike next month). Q4 2022 GDP growth was +2.6% YoY, Q1 2023 was +1.3% (second estimate as of 5/25), and the Atlanta Fed’s GDPNow forecast for Q2 shows +1.8% (as of 6/27).
The New York Fed’s GSCPI, which measures the number of standard deviations from the historical average value (aka Z-score), has fallen from a December 2021 high of +4.31 to the May reading of -1.71, indicating the supply chain pressures have fallen precipitously to historic lows, mostly due to softer consumer demand, an easing of parts shortages, and lesser shipping congestion. The chart below compares trends in CPI inflation versus GSCPI, M2 money supply, and the S&P 500 (SPY) since 2011. The peaks and troughs in inflation tend to follow those in GSCPI with a slight lag. CPI and GSCPI both surged when M2SL surged and COVID lockdowns were instituted, and both have fallen precipitously.
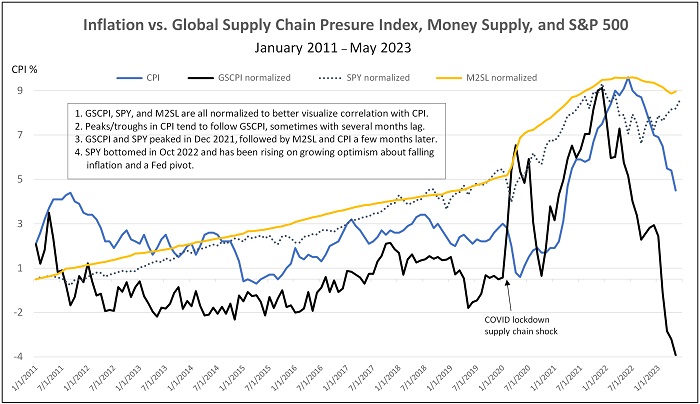
Recall that the Fed engineered a 41% pandemic-response surge in money supply in 2020-21. The chart shows that GSCPI and SPY both peaked in Dec 2021, followed by M2SL and CPI a few months later. M2SL crested during the 5-month March-July 2022 timeframe to $21.7 trillion and has since retreated by nearly 5% to $20.6 trillion (as of April) as the Fed has let maturing Treasuries roll off the balance sheet without replacement—although the latest May reading shows a slight uptick in M2SL to $20.8 trillion (as shown in the chart). And let’s not ignore the Bank Term Funding Program created by the Fed in March to ensure sufficient liquidity in the banking system for normal operations, albeit at relatively onerous terms for the banks. The BTFP has continued to expand, exceeding $100 billion in June. Bank deposits with the Federal Reserve peaked in December 2021 at a record $4.3 trillion but have since fallen dramatically, ultimately triggering the banking crisis in March when it fell below $3.0 trillion.
Meanwhile, SPY bottomed in October 2022 and has been rising (while M2 keeps shrinking) on growing optimism about falling inflation and a Fed pause/pivot. But unsurprisingly, the Tech-laden Nasdaq 100 (QQQ) has performed even better than SPY in this environment as companies that are cash rich and less dependent on debt in their capital structures, like the AI-oriented “Big Tech” juggernauts, do not see their margins squeezed by rising financial costs. In fact, they are treated like defensive plays. I talk more about relative performance in the next section.
A key question is the future direction of money supply and its impact on stock prices. The previous chart illustrates the long-term correlation between rising/falling money supply and stocks—at least until October 2022 when stocks bottomed. Since then, stocks have shown impressive resilience/recovery despite money supply continuing to fall. But since the gains have been led primarily by Big Tech, can the broader market continue to rally without the tailwind of new money creation? Or is there still plenty of available fuel from cash on the sidelines, including several trillion dollars in high-yielding money market funds? Many of those MMFs pay a risk-free 5%+ from the Fed’s reverse repo market, so it will take strong FOMO to get that capital to move into stocks.
Valuations and relative performance:
The chart below compares the 1-year returns of cap-weighted SPY vs. equal weight S&P 500 (RSP) vs. the S&P 500 High Dividend (SPYD). SPYD is badly trailing the other three. All of this is the complete opposite of calendar-year 2022, when SPYD outperformed RSP, which outperformed SPY, which outperformed QQQ. Notably, the Energy Sector SPDR (XLE) left them all in the dust in 2022 (+65%), but YTD 2023 XLE is down about -8%.
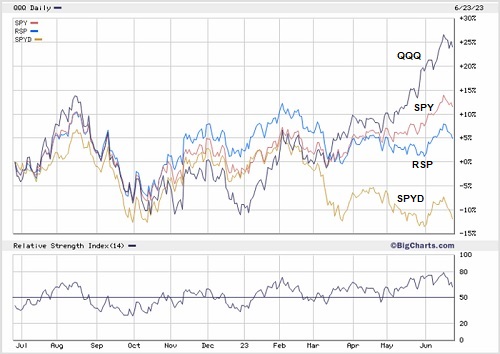
NTM Forward P/E ratios (as of 6/23) are 19.2x for SPY and 26.6x for Nasdaq 100 (QQQ), while RSP (representing the average of all S&P 500 stocks) is only 15.6x. The S&P 400 mid-caps (MDY) and Russell 2000 small caps (IWM) are both 14.1x, while the Invesco equal weight S&P 400 (EWMC) is 13.8x. For comparison XLE has a forward P/E of 10.6x and Financial Sector SPDR (XLF) is 12.7x. This all reflects the extreme investor preference for the mega-cap Tech juggernauts, which counterintuitively serve as a defensive play as well due to their market dominance, “wide moats,” and perceived resilience during any economic conditions. Today, eight mega-cap Tech and growth companies account for over 30% of the S&P 500’s market capitalization (up from 22% at the start of the year), pushing SPY to historic YTD outperformance over the equal-weight RSP.
This has put inordinate pressure on professional money managers to generate similar returns, and thus a FOMO response), as well as a buying frenzy in the momentum names among the “quants,” i.e., hedge funds and institutional proprietary traders that employ unbiased, algorithmic (often trend-following) trading systems. Volatility has been depressed by steady accumulation by the quants and corporate buyback programs. Of course, whenever the quants reverse their strategy and go short, volatility could skyrocket.
Some commentators see the thin leadership propelling the market’s advance as a signal of weakness ahead. Strength in seven AI-oriented mega-cap stocks—Apple (AAPL), Microsoft (MSFT), Alphabet (GOOGL), Amazon.com (AMZN), Tesla (TSLA), Meta Platforms (META), and NVIDIA (NVDA)—have accounted for most of the surge in QQQ, while most other stocks have barely budged, as hawkish Fed rhetoric sparks recession fears and the solid investment alternative presented by bonds has created fierce competition for capital. Indeed, whereas the ZIRP era of ultra-low interest rates spawned the TINA acronym (there is no alternative) by essentially forcing fund managers into risk assets (like stocks, real estate, and speculative bets) to achieve meaningful returns, the Fed’s rapid increase in interest rates has created quite appealing fixed-income alternatives providing safe yields that today exceed 5.0%.
This action is in stark contrast to 2022 (through January of 2023), which saw a rotation to quality and value [led by small cap pure value (RZV)], while this year since February has been dominated by the AI trade. But many commentators are anticipating a resurgence in Value led by Financials and Energy and Financials, as: 1) oil prices move higher on production cuts and rising global demand, and 2) we move beyond the banking crisis (given the de facto Fed backstop) and maturing lower-rate Treasuries roll into higher-yielding replacements, boosting banks’ EPS. As DataTrek opined, “It seems that enough fiscal, monetary, and economic clouds have lifted to believe the other 73% of the S&P [beyond the mega-cap Tech giants] can now claw back some market cap through relative outperformance.”
This would be a boon for Sabrient’s portfolios, most of which are typically overweight Energy and Financials due to their low valuations for solid earnings growth expectations. Our Baker’s Dozen portfolios have mostly outperformed the benchmark S&P 500, with the exception of the two portfolios that launched in Q4 2022 and Q1 2023 when Energy and Financials sectors peaked and pulled back on recession fears, falling oil prices, and of course the banking crisis. However, that selloff now looks like a great buying opportunity. Indeed, the latest Q2 2023 Baker’s Dozen is performing quite well out of the gate, particularly as banks recover and oil supply/demand dynamics support higher oil prices. Moreover, during the month of June, our portfolios across the board have displayed some of their best-ever outperformance days relative to the benchmark S&P 500.
Notably, rising crude oil production in North & South America plus Russia’s ability to circumvent sanctions by selling 80% of its heavy sour crude oil to China and India (who then refine and sell petroleum products), temporarily depressed oil prices. [Somewhat surprisingly, the near insurrection (the real kind, with tanks and guns and stuff) of The Wagner Group on the Kremlin had little impact on oil prices.] However, supply/demand dynamics should push oil prices higher over the coming months, supporting share prices in the Energy sector.
The Bull and Bear cases:
From the bull perspective, the macro picture and stock market fundamentals are improving, e.g., the debt ceiling standoff is resolved, inflation continues to fall, the Fed is in pause mode (and perhaps nearing a policy pivot), the US economy is growing, economic data is strengthening (new home sales, consumer confidence, and durable good sales are surging), geopolitical pressures seem to be subsiding, profit margins are beating expectations (largely driven by cost discipline), and corporate earnings have been resilient while the outlook is improving. And although valuations are high for the cap-weighted SPY and QQQ, the average stock is much more reasonably priced.
Bulls also see an encouraging technical picture, with many historical buy signals having been triggered over the past several months. For example, Carson Research found that the last 13 times the S&P 500 rallied 20% off its lows, 12 times the market was higher 12 months later, with an average gain of nearly 18%. Nearly 50% of stocks are above their 200-day moving average, which shows solid momentum but still far below the 70% overbought threshold. Also, the VIX has been quite complacent, shrinking to pre-pandemic levels despite the all the global and domestic turmoil, which bodes well for improving market breadth. And there is a lot of cash on the sidelines, including $7 trillion in money market funds, and the BofA Fund Manager Survey shows fund managers are still highly overweight cash and underweight stocks…with the FOMO urge growing.
Even if we end up with flat or slightly negative real GDP growth over the next couple of quarters, elevated inflation suggests we could still see positive nominal GDP growth. And given the correlation between nominal economic growth and corporate profits, we could expect solidly positive EPS growth, particularly if margins continue to firm up. Homebuilder confidence turned positive in June for the first time in 11 months, new home sales in May were quite strong, and improving housing data historically bodes well for stocks. M&A spending is increasing, and share buybacks have been robust.
On the other hand, of course, bears would argue that too many risks abound. As described by Alpine Macro, a bear case is that a recession seems imminent given the deeply inverted yield curve (which suggests the Fed has overtightened), the steep drop in oil prices indicating waning demand in a slowing global economy, and tighter bank lending standards and shrinking money supply combining to choke liquidity—the lifeblood of a robust economy.
Furthermore, aggressive growth stocks tend to be longer-duration assets that historically perform best in a climate of sluggish economic growth, disinflation, and lower interest rates (e.g., the 2010’s). So, any surge in growth stocks means investors have been essentially denying the Fed’s hawkish rhetoric (suggesting two more rate hikes this year and no cuts until sometime next year). If instead the Fed follows through and raises rates further even as inflation continues to decline (which would be a policy mistake, in my view), real rates would rise even faster, and liquidity would tighten further, which might be expected to rotate capital away from growth stocks and gold, perhaps into bonds, defensive value stocks, and dividend payers.
Bearish strategists are aplenty. Morgan Stanley’s chief US equity strategist Michael Wilson sees too many risks for risk-on investing, including a lofty market valuation, narrow breadth, and the outperformance of defensive stocks. He thinks earnings expectations and economic uncertainties provide little reason for optimism. “The fundamental case does not support where stocks are trading today whether it’s at the index level or at the single-stock level, and the second half is going to be choppier and probably downward in the index,” he says. Moreover, Wilson believes we are still in a bear market and that, “…bear markets…are designed to fool you, confuse you…chase things at the wrong time and probably sell them at the wrong time.” However, even he sees an imminent capex boom (nearshoring, green energy, infrastructure, AI) leading to growth in 2024-25. But it means high expenditures first before the returns arrive later via productivity and profitability gains.
Similarly, Bank of America strategist Michael Hartnett investors will prefer to stick with risk-off investments in high-yielding money market funds and bonds given elevated interest rates. He thinks the current climate resembles 2000 or 2008, which saw a “big rally before big collapse.”
Another situation to watch is the economic slowdown in China, which “faces deflationary risks, mounting local government debts, record youth unemployment, and weakening global demand,” according to Reuters, which could lead to impacts on our economy. In response, the PBOC cut interest rates to stimulate demand. I also think this might be what prompted China President Xi’s decision to meet with US Secretary of State Blinken, in an effort deescalate tensions and increase trade with the West (plus perhaps to publicly blame the US for those tensions). While the US has been shrinking trade with China, it has been expanding trade in India, Japan, South Korea, and other parts of SE Asia. Moreover, while China is cutting key interest rates, the Fed is on pause and the ECB and BOE are still raising rates. So, global economies (and their central banks) are out of synch.
Although the bear case is compelling, my view lies more with the bulls. By the way, it has been commonly pointed out that stocks historically have tended to fall after the Fed begins cutting rates. But as Alpine Macro has observed, this tendency is actually a more recent phenomenon that began in the early 1990’s when recessions were driven by deflationary shocks. But if you look back to prior decades like the 1970’s and 1980’s, the economy was typically hobbled by inflationary shocks (much like our current post-pandemic period), which necessitated rate hikes. So, when it was time to stimulate the economy with rate cuts, it quickly led to economic recovery and higher stock prices. Thus, given that today’s fast-moving markets tend to position in anticipation of future events, Alpine Macro opines that stock prices today may be front-running a similar 70-80’s-era recovery.
The new technology renaissance:
Past bull markets have tended to be driven by one primary disruptive/transformational technology, and led by a handful of powerhouse stocks. The 1980’s Tech boom was led by the personal computer, the 1990’s were driven by the Internet, the 2000’s were led by the smartphone, and the 2010’s were about application software and the cloud. Now we sit in the 2020’s, and according to the OECD, it appears that artificial intelligence (AI), blockchain and distributed ledger technologies (DLTs), and quantum computing will be the key drivers of digital transformation—and lifechanging in many ways.
AI trains computers to perceive, synthesize, reason, make decisions, and generally perform many tasks that historically require human intelligence. DLTs leverage the blockchain to secure data and transaction records for use by multiple parties (i.e., decentralized), without reliance on a trusted central authority. Quantum computing promises to increase computing capacities enormously (leveraging “quibits” or quantum mechanical bits) for addressing problems that are intractable on our traditional computers. This article from Simplilearn nicely summaries these technologies and their synergies.
In addition, despite high-profile bankruptcies for the likes of FTX, Genesis Global, Celsius, Voyager, BlockFi, and Three Arrows, among others, Bitcoin has surged to new YTD highs and looks quite healthy from both fundamental and technical standpoints, as liquidity and appeal across the entire crypto space has been enhanced by the involvement of several financial industry giants. In particular, BlackRock’s filing for a spot BTC exchange-traded fund could be a gamechanger, and many others have been trying to do the same, including Invesco, VanEck, ARK Invest, WisdomTree, and Grayscale. In addition, EDX Markets (EDX) is a cryptocurrency exchange backed by Fidelity, Schwab, Citadel, Virtu, and Sequoia. It seems likely that endowments, pension funds, and family offices will add a crypto allocation to their portfolios. Furthermore, the second-largest crypto, Ethereum, recently completed a major upgrade and a transition from proof-of-work (PoW) to proof-of-stake (PoS), which now allows ETH holders to “stake” their holdings (i.e., earn interest) while still retaining access to them—much like a bond or dividend stock.
All of this provides a big boost for crypto, decentralized finance (DeFi), and blockchain technology in general. As explained by Eric Peters in his role as CIO of Coinbase Asset Management, “The bad actors in the industry have been expunged. The survivors have the technology, the highly specialized knowledge, and the know-how that will be vital to build this new foundation of finance…The crypto asset class is $1 trillion today. But there is something like $500 trillion of global wealth. Someday, most or perhaps all of this, will be recorded, traded, and custodied using blockchains.”
Final comments:
Not to sound like a wacky conspiracy theorist, but it has become increasingly evident to me that there are global movements afoot seeking a “Global Reset” (and convergence) of all institutions, energy sources, and economic systems. In a nefarious pursuit of power and control, they appear to be deliberately fomenting racial/class division and unbridled crime in this country and geopolitical conflict abroad, while exaggerating the downside of our Western free market capitalist system versus the incredible upside it has produced. Please don’t be deceived! I touch a bit more on this in Tip #9 of my recent blog post, “10 Tips for Career Success for New Grads and Young Professionals.”
On that note, I read an enlightening article last month by Scott Lincicome of the Cato Institute, “The American Wealth Machine and Its Misguided Discontents.” He refutes the perception that the US is in a steep decline relative to China and the rest of the world. On the contrary, he says, “Despite what you might hear (or believe)…For all its warts and problems…the U.S. economy isn’t actually a basket case and, in fact, remains globally dominant by all sorts of metrics.” He cites reams of encouraging statistics and trends, ranging from GDP per capita to the percentage of global patents registered to US companies, to household income and real wealth (across ages and ethnicities). Notably, he points out that the poorest state in the US, Mississippi, actually boasts a higher average income than France. Who knew?
Latest Sector Rankings:
Relative sector rankings are based on our proprietary SectorCast model, which builds a composite profile of each of over 1,000 equity ETFs based on bottom-up aggregate scoring of the constituent stocks. The Outlook Score is a Growth at a Reasonable Price (GARP) model that employs a forward-looking, fundamentals-based multifactor algorithm considering forward valuation, historical and projected earnings growth, the dynamics of Wall Street analysts’ consensus earnings estimates and recent revisions (up or down), quality and sustainability of reported earnings, and various return ratios. It helps us predict relative performance over the next 3-6 months.
In addition, SectorCast computes a Bull Score and Bear Score for each ETF based on recent price behavior of the constituent stocks on particularly strong and weak market days. A high Bull score indicates that stocks within the ETF recently have tended toward relative outperformance when the market is strong, while a high Bear score indicates that stocks within the ETF have tended to hold up relatively well (i.e., safe havens) when the market is weak.
Outlook score is forward-looking while Bull and Bear are backward-looking. As a group, these three scores can be helpful for positioning a portfolio for a given set of anticipated market conditions. Of course, each ETF holds a unique portfolio of stocks and position weights, so the sectors represented will score differently depending upon which set of ETFs is used. We use the iShares that represent the ten major U.S. business sectors: Financials (IYF), Technology (IYW), Industrials (IYJ), Healthcare (IYH), Consumer Staples (IYK), Consumer Discretionary (IYC), Energy (IYE), Basic Materials (IYM), Telecommunications (IYZ), and Utilities (IDU). Whereas the Select Sector SPDRs only contain stocks from the S&P 500 large cap index, I prefer the iShares for their larger universe and broader diversity.
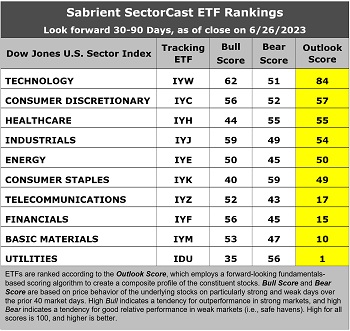
This week’s fundamentals-based Outlook rankings display a solidly bullish bias given that the economically sensitive and cyclical sectors have moved up the rankings. Technology (IYW) sits firmly at the top with an Outlook Score of 84 followed by Consumer Discretionary (IYC) at 57, despite both sectors displaying the highest P/E ratios (26.5x and 23.2x, respectively).
Technology continues to enjoy the largest upward revisions to EPS estimates among sell-side analysts, as well as strong return ratios and a solid EPS growth forecast of 15.5%, which is second only to IYC. Consumer Discretionary also displays the lowest forward PEG ratio (forward P/E divided by projected long-term EPS growth rate) of 1.18. Healthcare, Industrials, and Energy round out the top five. Defensive sectors Consumer Staples, Telecom, and Utilities all score in the bottom half, with Utilities firmly at the bottom with an Outlook Score of 1.
Keep in mind, the Outlook Rank does not include timing, momentum, or relative strength factors, but rather reflects the consensus fundamental expectations at a given point in time for individual stocks, aggregated by sector.
As a reminder, if you have an interest in our quant rankings, we have a new product called Sabrient SmartSheets—one for individual stocks and one for ETFs. They can be delivered weekly in Excel format and are helpful for learning how your stocks and ETFs score in our various alpha factors…or for identifying the top-ranked stocks and ETFs for each alpha factor (or for weighted combinations of the factors at your choosing).
ETF Trading Ideas:
Our rules-based Sector Rotation model, which appropriately weights Outlook, Bull, and Bear scores in accordance with the overall market’s prevailing trend (bullish, neutral, or defensive), has retained a bullish posture since SPY rose above both its 50-day and 200-day simple moving averages in late March. It suggests holding Technology (IYW), Industrials (IYJ), and Consumer Discretionary (IYC), in that order. (Note: In this model, we consider the bias to be bullish from a rules-based trend-following standpoint when SPY is above both its 50-day and 200-day simple moving averages.)
If you prefer a neutral bias, the Sector Rotation model suggests holding Technology, Consumer Discretionary, and Healthcare (IYH), in that order. Or, if you prefer a defensive stance, the model suggests holding Healthcare, Technology, and Industrials, in that order. Note that IYW is suggested for all three scenarios.
An assortment of other interesting ETFs that are scoring well in our latest rankings include: US Global Jets (JETS), Invesco DWA Technology Momentum (PTF), Global X Emerging Markets Internet & E-commerce (EWEB), Defiance Hotel, Airline, and Cruise (CRUZ), AdvisorShares Dorsey Wright ADR (AADR), Donoghue Forlines Risk Managed Innovation (DFNV), Pacer US Large Cap Cash Cows Growth Leaders (COWG), T. Rowe Price Growth Stock (TGRW), AdvisorShares Alpha DNA Equity Sentiment (SENT), Nuveen Growth Opportunities (NUGO), Invesco S&P SmallCap 600 Pure Growth (RZG), AdvisorShares Hotel (BEDZ), First Trust Expanded Technology (XPND), Capital Group Global Growth Equity (CGGO), Inspire Fidelis Multi Factor (FDLS), Fidelity Disruptive Technology (FDTX), Alpha Dog (RUFF), ERShares Entrepreneurs (ENTR), Fount Metaverse (MTVR), First Trust Cloud Computing (SKYY), Fidelity Disruptive Automation (FBOT), AdvisorShares Vice (VICE), and Global X Social Media (SOCL). All score in the top decile (90-100) of Outlook scores.
As always, I welcome your thoughts on this article! Please email me anytime. Any and all feedback is appreciated! In particular, what sections you find the most valuable—commentary, chart analysis, SectorCast scores, or ETF trading ideas / sector rotation model? Also, please let me know of your interest in a Sabrient index for TAMP or ETF investing…or in the new Sabrient SmartSheets to our full rankings of stocks and ETFs!
IMPORTANT NOTE: I post this information periodically as a free look inside some of our institutional research and as a source of some trading ideas for your own further investigation. It is not intended to be traded directly as a rules-based strategy in a real money portfolio. I am simply showing what a sector rotation model might suggest if a given portfolio was due for a rebalance, and I do not update the information on a regular schedule or on technical triggers. There are many ways for a client to trade such a strategy, including monthly or quarterly rebalancing, perhaps with interim adjustments to the bullish/neutral/defensive bias when warranted, but not necessarily on the days that I happen to post this article. The enhanced strategy seeks higher returns by employing individual stocks (or stock options) that are also highly ranked, but this introduces greater risks and volatility. I do not track performance of the ideas mentioned here as a managed portfolio.
Disclosure: At the time of this writing, of the securities mentioned, the author held positions in SPY, QQQ, XHB, and NVDA.
Disclaimer: Opinions expressed are the author’s alone and do not necessarily reflect the views of Sabrient. This newsletter is published solely for informational purposes and is not to be construed as advice or a recommendation to specific individuals. Individuals should take into account their personal financial circumstances in acting on any opinions, commentary, rankings, or stock selections provided by Sabrient Systems or its wholly owned subsidiary, Gradient Analytics. Sabrient makes no representations that the techniques used in its rankings or analysis will result in or guarantee profits in trading. Trading involves risk, including possible loss of principal and other losses, and past performance is no indication of future results.