Rising inflation casts pall over the market, but quality and value provide new opportunities
 by Scott Martindale
President & CEO, Sabrient Systems LLC
I have been warning that the longer the market goes up without a significant pullback, the worse the ultimate correction is likely to be. So, with that in mind, we might not have seen the lows for the year quite yet, as I discuss in the chart analysis later in this post. January saw a maximum intraday peak-to-trough drawdown on the S&P 500 of -12.3% and the worst monthly performance (-5.3%) for the S&P 500 since March 2020 (-12.4%). It was the worst performance for the month of January since 2009 (during the final capitulation phase of the financial crisis) and one of the five worst performances for any January since 1980. The CBOE Volatility Index (VIX), aka “fear gauge,” briefly spiked to nearly 39 before settling back down to the low-20s.
It primarily was driven by persistently high inflation readings – and a suddenly hawkish-sounding Federal Reserve – as the CPI for the 12 months ending in December came in at 7.0% YoY, which was the largest increase for any calendar year since 1981. Then on Feb 10, the BLS released a 7.5% CPI for January, the highest YoY monthly reading since 1982. Of course, stocks fell hard, and the 10-year T-note briefly spiked above 2% for the first time since August 2019.
Looking under the hood is even worse. Twelve months ago, new 52-week highs were vastly outpacing new 52-week lows. But this year, even though new highs on the broad indexes were achieved during January, we see that 2/3 of the 3,650 stocks in the Nasdaq Composite have fallen at least 20% at some point over the past 12 months – and over half the stocks in the index continue to trade at prices 40% or more below their peaks, including prominent names like DocuSign (DOCU), Peloton Interactive (PTON), and of course, Meta Platforms, nee Facebook (FB). Likewise, speculative funds have fallen, including the popular ARK Innovation ETF (ARKK), which has been down as much as -60% from its high exactly one year ago (and which continues to score near the bottom of Sabrient’s fundamentals based SectorCast ETF rankings).
Pundits are saying that the “Buy the Dip” mentality has suddenly turned into “Sell the Rip” (i.e., rallies) in the belief that the fuel for rising asset prices (i.e., unlimited money supply and zero interest rates) soon will be taken away. To be sure, the inflation numbers are scary and unfamiliar. In fact, only a minority of the population likely can even remember what those days of high inflation were like; most of the population only has experienced decades of falling CPI. But comparing the latest CPI prints to those from 40 years ago has little relevance, in my view, as I discuss in the commentary below. I continue to believe inflation has been driven by the snapback in demand coupled with slow recovery in hobbled supply chains – largely due to “Nanny State” restrictions – and that inflationary pressures are peaking and likely to fall as the year progresses.
In response, the Federal Reserve has been talking down animal spirits and talking up interest rates without actually doing much of anything yet other than tapering its bond buying and releasing some thoughts and guidance. The Fed’s challenge will be to raise rates enough to dampen inflation without overshooting and causing a recession, i.e., the classic policy mistake. My prediction is there will be three rate hikes over the course of the year, plus some modest unwinding of its $9 trillion balance sheet by letting some maturing bonds roll off. Note that Monday’s emergency FOMC meeting did not result in a rate hike due to broad global uncertainties.
Longer term, I do not believe the Fed will be able to “normalize” interest rates over the next decade, much less the next couple of years, without causing severe pain in the economy and in the stock and bond markets. Our economy is simply too levered and “financialized” to absorb a “normalized” level of interest rates. But if governments around the world (starting with the US and Canada!) can stand aside and let the economy work without heavy-handed societal restrictions and fearmongering, we might see the high supply-driven excess-demand gap close much more quickly.
In this periodic update, I provide a comprehensive market commentary, offer my technical analysis of the S&P 500 chart, review Sabrient’s latest fundamentals based SectorCast quant rankings of the ten US business sectors, and serve up some actionable ETF trading ideas. To summarize, our SectorCast rankings reflect a bullish bias, with the top three scorers being deep-cyclical sectors, Energy, Basic Materials, and Financials. In addition, the near-term technical picture remains weak, and our sector rotation model moved from a neutral to a defensive posture this week as the market has pulled back.
Overall, I expect a continuation of the nascent rotation from aggressive growth and many “malinvestments” that were popular during the speculative recovery phase into the value and quality factors as the Fed tries to rein in the speculation-inducing liquidity bubble. And although I don’t foresee a major selloff in the high-valuation-multiple mega-cap Tech names, I think investors can find better opportunities this year among high-quality stocks outside of the Big Tech favorites – particularly among small and mid-caps – due to lower valuations and/or higher growth rates, plus some of the high-quality secular growth names that were essentially the proverbial “baby thrown out with the bathwater.” But that’s not say we aren’t in for further downside in this market over the near term. In fact, I think we will see continued volatility and technical weakness over the next few months – until the Fed’s policy moves become clearer – before the market turns sustainably higher later in the year.
Regardless, Sabrient’s Baker’s Dozen, Dividend, and Small Cap Growth portfolios leverage our enhanced Growth at a Reasonable Price (GARP) selection approach (which combines quality, value, and growth factors) to provide exposure to both the longer-term secular growth trends and the shorter-term cyclical growth and value-based opportunities – without sacrificing strong performance potential. Sabrient’s new Q1 2022 Baker’s Dozen launched on 1/20/2022 and is already off to a good start versus the benchmark. In addition, our Dividend and Small Cap Growth portfolios have been performing well versus their benchmarks. In fact, all 7 of the Small Cap Growth portfolios launched since the March 2020 COVID selloff have outperformed the S&P 600 SmallCap Growth ETF (SLYG), and 7 of the 8 Dividend portfolios have outperformed the S&P 500 (SPY). In particular, the Energy sector still seems like a good bet, as indicated by its low valuation and high score in our SectorCast ETF rankings.
Furthermore, we have created the Sabrient Quality Index Series comprising 5 broad-market and 5 sector-specific, rules-based, strategic beta and thematic indexes for ETF licensing, which we are pitching to various ETF issuers. Please ask your favorite ETF wholesaler to mention it to their product team!
Read on....
Commentary:
First off, as a lifelong Rams fan (my favorite player as a kid was Roman Gabriel, which certainly dates me), please indulge me when I exclaim, “Whose house?! Rams house!!” I know some of you might have something to say about that.
Inflation and interest rates:
Moving along, I agree, if inflation keeps running hot, the Fed will be forced to act forcefully, and stocks will struggle. Thus, the latest inflation readings and associated Fed comments have thrown investors into a tizzy. And Russia’s threats upon Ukraine haven’t helped matters. But more impactful than the January CPI print (which was expected to be quite high) was the comment from the uber-hawkish president of the St. Louis Federal Reserve (and new voting member of the FOMC) James Bullard who said he favors interest rate increase of 100 bps by July 1, including 50 bps at the March meeting. As a result, Fed funds futures are projecting an 88% chance of at least 7 quarter-point rate hikes this year.
Far be it from me to second guess a wise and seasoned government official, but I think the risk of an overly hawkish policy mistake outweighs the risk of cutting accommodation too slowly. After all, the problem at hand is a “light switch” resumption in consumer demand to pre-pandemic levels coupled with ongoing disruption in global supply chains, which include manufacturing, transportation, logistics, energy, and labor. The biggest drivers of inflation have been crude oil, natural gas, gasoline, fuel oil, used cars & trucks, utility gas, food, and shelter – all of which were especially impacted by supply chain shocks that are rapidly on the mend, which should soon slow the rise in prices (or may have already peaked). Importantly, semiconductor backlogs will fall as existing plants and shipping get back to capacity and the new plants under construction come online (several of which are being built right here in the US, eliminating the shipping component).
Moreover, companies have had success offsetting rising costs through operating efficiencies, operating leverage, and price hikes – as illustrated by high profit margins (+12.4% for the S&P 500 in Q4) and rising forward EPS guidance for Q1 2022. But it simply was not possible in these unprecedented circumstances, in a globalized economy characterized by just-in-time inventory management, to immediately return supply chains to normalcy nearly as quickly as pent-up demand – and the restrictions and mandates placed on business (particularly the oil & gas industry) have only exacerbated the problems.
And let’s not forget about jobs growth. Nonfarm payroll data showed that the economy added 467,000 jobs in January, which was more than 3x the 150,000 new jobs forecasted – and yet the unemployment rate rose 10 bps to 4.0% as the labor participation rate rose 30 bps to 62.2%. In addition, average hourly wages rose 5.7% YoY. Could it be that higher wages and lessening fears about the virus are bringing folks back to work? As workers return, another bottleneck in the supply chain mends and wage inflation slows. But any further uptick in the unemployment rate will give the Fed pause on aggressive policy action.
All the Fed can do in pursuing its mandate of maximum employment and financial stability (which has increasingly meant both modest inflation and stable asset prices) is to use policy tools that impact demand, i.e., interest rates and money supply (or quantitative easing). Quadratic Capital Management founder Nancy Davis expressed a similar view, saying, "While inflation is weighing heavily on Federal Reserve policy decisions, our current inflationary environment is unconventional and is caused largely by supply chain disruptions, something the Federal Reserve cannot fix with tighter monetary policy.” The St. Louis Fed’s 5-year breakeven inflation rate sits at 2.82% right now (down from a recent high of 3.17% in November), and the 5-year, 5-year forward inflation expectation rate (inflation expected starting 5 years from now) is at 2.04% (down from a recent high of 2.41% in October).
Economists generally believe that inflation is primarily driven by money supply. But a rising money supply alone does not necessarily lead to inflation. As shown in the chart, money supply has risen rapidly since the late 1990’s while velocity of money supply has fallen – such that CPI inflation remained low, and in fact the trend was down (albeit volatile).
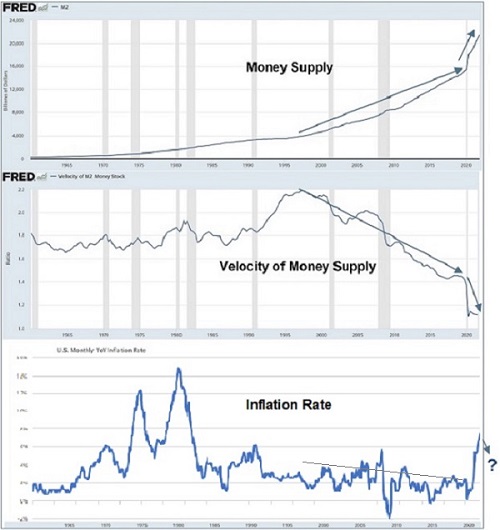
The pandemic-induced emergency response in 2020 brought massive new liquidity injections that caused a big spike in money supply but a big fall in velocity, as the fast-growing money supply exceeded the hobbled economy’s real demand for capital and its ability to absorb it – leading to accelerated asset inflation and unproductive capital allocation (aka “malinvestments,” or in adviser-speak, imprudent). You know what I’m talking about – meme stocks like GameStop (GME), the SPAC craze, low-quality altcoins (like the infamous Dogecoin, which its founders admit was created as a joke, with no real use and unlimited supply), non-fungible tokens (NFTs, which absolutely have a bright future as a concept but perhaps not some of the simple digital images selling for multiple millions of dollars). Even homes in many markets have been bid up beyond the reach of the median buyer due to investor speculation and short-term rentals.
But asset inflation aside, the main problem driving the CPI (other than rent from the housing bubble) is that consumer demand quickly returned to pre-COVID levels while supply chains have been slow to recover, leading to a spike in excess demand (the gap between demand and supply) and elevated CPI inflation until supply chains (factories, transport, logistics, energy, labor) fully mend. I don't foresee any specific drivers for velocity of money to suddenly spike, so recovery in supply chains should level off the inflationary pressures.
As for comparing the latest CPI to 1982, it is not apples-to-apples. The COVID-based shutdowns that decimated the supply side of the equation are wholly unique, as are the fiscal and monetary responses, global coordinated central bank policy, volatility control, and the “Fed put” that flooded the economy with liquidity to instantly restore and maintain the demand side – and which actually started in earnest in 2008 with the financial crisis. Nobody truly understands how we emerge from these engineered circumstances. Whereas in 1982, inflation was on the way down from a high of 14.8% after a lengthy period defined by various Middle East oil embargos (at a time when Energy was the largest sector of our economy) and massive spending on the Vietnam War.
Lastly, inflation is not being driven by greedy corporate chieftains, in my view. They have no desire to perpetuate supply chain disruptions as a convenient excuse for price gouging. Rather, they prefer the competitive marketplace in which they strive to delight their customers with higher product quality, better consumer service, and lower prices. Consumers and businesses alike want nothing more than a return to that kind of normalcy. But I think it is the heavy hand of Big Government totalitarianism-run-amuck that is perpetuating the supply chain disruptions and continuing to scare the bejesus out of such a large swath of the population. Even the hard-Left cheerleaders for Big Government and its “temporary” restrictions on individual liberties, choices, and speech are signaling a weariness with the fallout of their policies. If instead our leaders would just ease up on the mandates, restrictions, and regulations (including on fossil fuels!), and let the free market do what it does naturally, inflation will come down much more quickly. I know what you are thinking: “Good luck with that.” But one can hope.
Looking at the yield curve, the 2-year T-note is up 147 bps over the past 12 months to 1.57% while the 10-year is up only 78 bps to 1.99% as of 2/14/2022, so the yield curve has flattened. I think longer-term interest rates will remain constrained this year, with the 10-year US Treasury yield likely holding at or even below 2.0% (albeit with occasional excursions above that level, as we already have seen, during periods of volatility). The drivers for demand in US Treasuries include US dollar strength as global safe haven, lower comparative rates in most other developed markets, moderating inflationary pressures, regulatory and/or investor mandates for institutions to hold “cash or cash equivalents” in their portfolios, and the general “financialization” of global economy since 1980 (which means high leverage, broad reliance on capital markets, interest-rate sensitivity, short-term focus on profits and shareholder value, increasing dominance of financial industry over manufacturing, and widespread securitization) that makes it hard to absorb a sudden surge in interest rates.
It is understandable that the Fed fears getting too far behind the curve if inflation is truly here to stay, but to my mind, the bigger risk is the classic policy mistake of overtightening rather than the risk of money velocity suddenly shooting up in an inflation-inducing manner. The Fed knows that monetary tightening would depress the economy when it is still well below full capacity, and that the financialization of the economy means that even small changes in interest rates have widespread detrimental impacts. So again, I believe the Fed is merely “talking up” rates and shoring up its inflation-hawk credibility – and the big banks are falling in line with a wink and a nod by selling stocks and bonds. The Fed knows that raising rates as much as Bullard is suggesting wouldn’t have much impact on inflation without stifling economic growth. As Marcel Kasumovich, Head of Research for One River Asset Management, opined, “For all the hawkish hype, bond markets are convinced that the next easing cycle will come in 2023 and that long-term policy rates will remain well below inflation. This is strongly counter to Fed guidance. We see no historical precedent.”
Investment opportunities:
Q4 2021 US GDP came in at 6.9% annualized rate. The US consumer is in fine shape even with inflation, although the Consumer Confidence Index has been falling (likely due to the news headlines these days). US businesses are in fine shape, even with inflation, as the S&P 500 is on pace for a record level of quarterly profits of $55/share on +25.6% EPS growth and +14.1% revenue growth for Q4 (according to FactSet) while showing 12.4% profit margin (which is expected to continue) and raised guidance for Q1. Looking ahead, analysts expect EPS growth of +5.5% for Q1 2022 and +4.8% for Q2. Moreover, we are seeing robust M&A activity and share buybacks, as well as a strong housing market and a recovering manufacturing segment. Bond spreads remain tight, which indicates investor confidence.
So, the ducks are lining up for a strong economy and rising stock market, so long as the Fed doesn’t screw it up with the classic policy mistake of too much tightening. I believe Jerome Powell and his colleagues will opt for a more neutral stance on policy than the hawkish tone they are portraying.
As for valuations, the next-12-months (NTM) forward P/E ratio for the S&P 500 (SPY) is 19.4x, which has dropped significantly below the 21.7x level at the end of 2021, as prices have fallen while EPS estimates have risen. But even so, this valuation is still about 4% above its 5-year average and is driven (due to market cap weighting) by the mega-cap juggernauts that everybody wants to own – often for valid reasons since they shape their markets while pumping out consistent and reliable growth. However, the far lower valuations among high-quality small and mid-caps might offer better opportunities for gains. The Russell 2000 small caps (IWM) sports a forward P/E of 15.2x. But the S&P 600 small caps (SLY), which has an inherent quality bias (due to its requirement of positive reported earnings for both the most recent quarter and for the sum of its trailing four consecutive quarters) is even lower at 14.0x, which is about 18% below its 5-year average, while the similarly quality-biased S&P 400 mid-caps (MDY) is at 15.0x.
However, focusing on the major cap-weighted indexes can distort what’s happening in the broader market. For example, the top 10 largest stocks by market cap – Apple (AAPL), Microsoft (MSFT), Alphabet (GOOG), Amazon.com (AMZN), Tesla (TSLA), Meta Platforms (FB), NVIDIA (NVDA), Berkshire Hathaway (BRK.B), JP Morgan Chase (JPM), and UnitedHealth (UNH) – compose more than 1/3 of the S&P 500 index. The big recovery rally in 2020 off the pandemic lows was great for the many high-potential but highly speculative/low-quality names that you find in the ARKK Innovation ETF (ARKK), but now the Quality factor is back in vogue as investors are demanding that companies justify their elevated valuations with strong top and bottom-line growth and forward guidance.
To illustrate, below is a 1-year chart (through 2/2/2022) of the S&P 500 (SPY) versus the S&P 600 small caps (SLY), Russell 2000 small caps (IWM), and ARKK. While the S&P 500 index was up roughly 20% over the timeframe, ARKK was down about 50%. Many of the Nasdaq’s high-fliers have fallen precipitously from their 52-week highs – with some down 50-90%. Notably, ARKK (and others of the speculative ARK fund family) rank at or near the bottom of Sabrient’s GARP and quality oriented SectorCast ETF rankings. I also included both the SLY and IWM to highlight the renewed focus on Quality and Value, as membership in the S&P 600 has that positive earnings requirement, whereas the Russell 2000 is solely based on market cap. Although they have historically performed similarly, the higher-quality SLY has significantly outperformed the IWM over the past year and yet continues to display a much more attractive valuation.
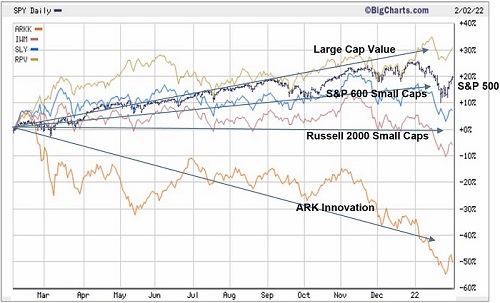
The key point here is that not all stocks are overvalued, and although Big Tech likely will continue to be treated as “safe and defensive” by investors (largely through passive investing), I think that high-quality stocks outside of the Big Tech favorites and speculative growth names will offer better opportunities for investors this year, with lower valuations and higher growth rates.
Again, I expect continued rotation from aggressive growth and the many “malinvestments” that were popular during the speculative recovery phase into the value and quality factors. And although I don’t necessarily foresee a selloff in the highly valued mega-cap Tech names (aside from the recent FB debacle), primarily because they boast huge and reliable profit margins, I think investors will find better opportunities among high-quality stocks outside of the Big Tech favorites – particularly among small and mid-caps – due to lower valuations and/or higher growth rates – so long as high yield spreads don’t spike to crippling levels.
By the way, you might want to check out our new SmartLights™ web application: https://www.sabrientsystems.com/SmartLights-info. It offers a combination of a powerful stock screener and an even more powerful stock analysis app. You can run searches through Sabrient’s proprietary algorithms to identify trading ideas, or you can upload your own portfolio to see how your stocks score in our proprietary algorithms. Our analyst team uses it all the time!
SPY Chart Review:
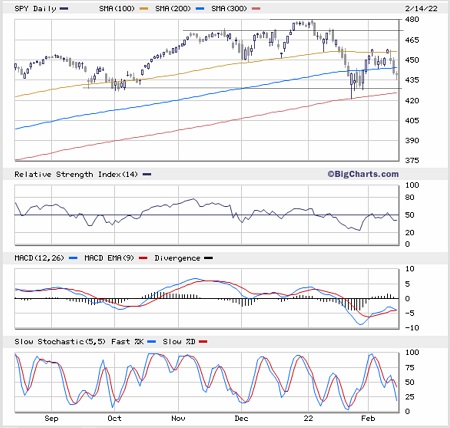
The SPDR S&P 500 Trust (SPY) closed Monday at 439. I mentioned in my December post that there still hadn’t been a test of the 200-day SMA since June 2020 (during the initial pandemic recovery). Well, we sure got it in January…and even got a brief intraday test of the 300-day SMA. Price action remains weak. Looking at the oscillators, RSI, MACD, and Slow Stochastic all look weak and ready to fall a bit further before setting up some sort of rebound. As I suggested it would back in December, SPY pulled back into the December FOMC meeting and then proceeded with its seasonal Santa Claus rally into year end. But then the long-overdue correction set in, essentially right out of the new year gate. The bounce took price back up to the 100-day SMA where it found resistance, followed by several days testing support at the 200-day, which has failed. I think another test of support at the 300-day and the 430 level is in store before any concerted upside can begin. But regardless, I foresee ongoing volatility for much of 1H2022, perhaps through the summer – and a real washout or “capitulation” spike in the VIX might be in store, beyond the 39 reading we got in January or the 32 level we saw today.
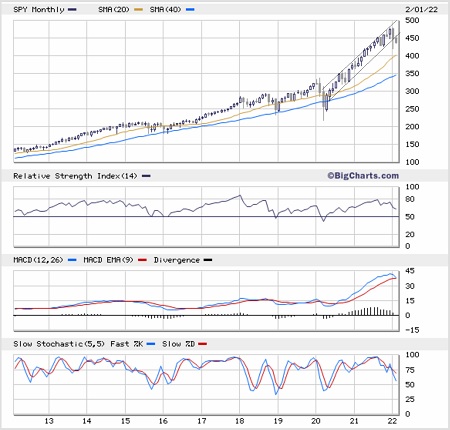
In addition, in my December post, I discussed the 10-year monthly chart of SPY and how ominously stretched it had become from its moving averages. After a bearish “shooting star” pattern for the month of November, and something close to a bearish “hanging man” pattern in December, the setup for January was high probability to finally bring about a correction; it just needed a catalyst, which of course it got from inflation and perhaps Russia. As shown in the chart below, the gap above the 20-day SMA has closed a lot, so perhaps we are close to a bottom. However, price has fallen outside the steep uptrend channel, so it’s hard to say where the bottom might be. Perhaps (or hopefully?), like I suggested from the daily chart above, the 430 level is a downside target on the monthly chart as well.
Latest Sector Rankings:
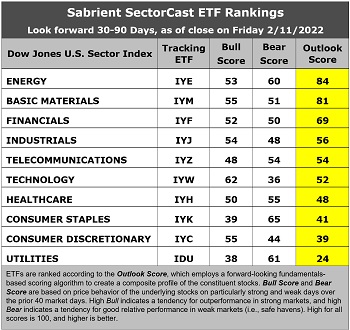
Relative sector rankings are based on our proprietary SectorCast model, which builds a composite profile of each of over 1,000 equity ETFs based on bottom-up aggregate scoring of the constituent stocks. The Outlook Score employs a forward-looking, fundamentals-based multifactor algorithm considering forward valuation, historical and projected earnings growth, the dynamics of Wall Street analysts’ consensus earnings estimates and recent revisions (up or down), quality and sustainability of reported earnings, and various return ratios. It helps us predict relative performance over the next 2-6 months.
In addition, SectorCast computes a Bull Score and Bear Score for each ETF based on recent price behavior of the constituent stocks on particularly strong and weak market days. A high Bull score indicates that stocks within the ETF recently have tended toward relative outperformance when the market is strong, while a high Bear score indicates that stocks within the ETF have tended to hold up relatively well (i.e., safe havens) when the market is weak.
Outlook score is forward-looking while Bull and Bear are backward-looking. As a group, these three scores can be helpful for positioning a portfolio for a given set of anticipated market conditions. Of course, each ETF holds a unique portfolio of stocks and position weights, so the sectors represented will score differently depending upon which set of ETFs is used. We use the iShares that represent the ten major U.S. business sectors: Financials (IYF), Technology (IYW), Industrials (IYJ), Healthcare (IYH), Consumer Staples (IYK), Consumer Discretionary (IYC), Energy (IYE), Basic Materials (IYM), Telecommunications (IYZ), and Utilities (IDU). Whereas the Select Sector SPDRs only contain stocks from the S&P 500 large cap index, I prefer the iShares for their larger universe and broader diversity.
Here are some of my observations on this week’s scores:
1. The rankings continue to look bullish, topped by deep cyclicals Energy and Basic Materials with impressive Outlook scores of 84 and 81, respectively, which is largely unchanged from my October and December posts. You would expect strength in these cyclical sectors given their high earnings leverage within an expansionary economy and solid oil and commodity prices. Energy enjoys strong analyst sentiment (recent positive net revisions to EPS estimates), a low forward P/E of 12.5x, good projected EPS growth of 10.9%, and an attractive forward PEG (forward P/E divided by projected EPS growth rate) of 1.15. Basic Materials displays good analyst sentiment, the lowest forward P/E of 12.0x, strong projected EPS growth of 18.3%, and an ultra-low forward PEG of 0.66. After dwelling in or near the cellar for much of the past few years, Energy has climbed the ladder this year and is now as firmly entrenched at the top as much as it was previously entrenched at the bottom – particularly given that oil prices are so strong. Rounding out the top six are Financials, Industrials, Telecom, and Technology, which is quite the bullish group, and all sport Outlook scores above 50.
2. At the bottom are Utilities and Consumer Discretionary with Outlook scores of 24 and 39, respectively, while Consumer Staples isn’t too far ahead at 41. Utilities is a low (but stable) growth sector that should score low in a surging economy, while Consumer Discretionary appears to be a bit overbought with a high forward P/E of 21.5x and negative net revisions to EPS estimates, although it still displays the highest earnings growth expectations.
3. Looking at the Bull scores, Technology has the top score of 62 as stocks within the sector have displayed relative strength on strong market days. Utilities scores the lowest at 38. The top-bottom spread is 24 points, which reflects low sector correlations on strong market days. It is desirable in a healthy market to see low correlations reflected in a top-bottom spread of at least 20 points, which indicates that investors have clear preferences in the market segments and stocks they want to hold.
4. Looking at the Bear scores, Consumer Staples scores the highest of 65 as stocks within this defensive sector have been the preferred safe havens on weak market days. Technology displays the lowest score of 36, as investors have fled the sector during market weakness. The top-bottom spread is 29 points, which reflects quite low sector correlations on weak market days. Ideally, certain sectors will hold up relatively well while others are selling off (rather than broad risk-off behavior), so it is desirable in a healthy market to see low correlations reflected in a top-bottom spread of at least 20 points.
5. Energy displays the best all-around combination of Outlook/Bull/Bear scores, while Utilities is the worst. Looking at just the Bull/Bear combination, Energy is by far the best, indicating superior relative performance (on average) in extreme market conditions whether bullish or bearish.
6. This week’s fundamentals-based Outlook rankings display a highly bullish bias given that 5 of the top 6 sectors are considered either cyclical (Energy, Materials, Financials, Industrials, Technology) or all-weather (Telecom), while the more defensive sectors (particularly Utilities and Staples) are relegated towards the bottom. Keep in mind, the Outlook Rank does not include timing, momentum, or relative strength factors, but rather reflects the consensus fundamental expectations at a given point in time for individual stocks, aggregated by sector.
ETF Trading Ideas:
Our Sector Rotation model, which appropriately weights Outlook, Bull, and Bear scores in accordance with the overall market’s prevailing trend (bullish, neutral, or defensive), has moved from its neutral bias during the past several weeks to now displaying a defensive bias and suggests holding Energy (IYE), Consumer Staples (IYK), and Basic Materials (IYM), in that order. (Note: In this model, we consider the bias to be defensive from a rules-based trend-following standpoint when SPY is below both its 50-day and 200-day simple moving averages.)
If you prefer a neutral bias, the Sector Rotation model suggests holding Energy, Basic Materials, and Financials (IYF), in that order. Or, if you are more comfortable taking a bullish stance, the model suggests holding Technology (IYW), Basic Materials, and Energy, in that order.
An assortment of other interesting ETFs that are scoring well in our latest rankings include: First Trust Indxx Natural Resources Income (FTRI), AdvisorShares Dorsey Wright ADR (AADR), iShares US Home Construction (ITB), Pacer US Cash Cows Growth (BUL), Viridi Cleaner Energy Crypto-Mining & Semiconductor (RIGZ), WBI BullBear Quality 3000 (WBIL), First Trust Dorsey Wright Momentum & Value (DVLU), ProShares Nanotechnology (TINY), Invesco S&P SmallCap Value with Momentum (XSVM), Pacer US Cash Cows (COWZ), Direxion mRNA (MSGR), Invesco Dynamic Semiconductors (PSI), AdvisorShares Dorsey Wright Micro-Cap (DWMC), Invesco DWA Energy Momentum (PXI), SPDR S&P Global Natural Resources (GNR), Fidelity Stocks for Inflation (FCPI), Innovator IBD 50 (FFTY), Invesco DWA Consumer Cyclicals Momentum (PEZ), ETFMG Treatments Testing and Advancements (GERM), Alpha Architect US Quantitative Value (QVAL), Invesco Dynamic Market (PWC), First Trust Nasdaq Oil & Gas (FTXN), SPDR S&P Metals & Mining (XME), and Affinity World Leaders Equity (WLDR).
As always, I welcome your thoughts on this article! Please email me anytime. Any and all feedback is appreciated!
IMPORTANT NOTE: I post this information periodically as a free look inside some of our institutional research and as a source of some trading ideas for your own further investigation. It is not intended to be traded directly as a rules-based strategy in a real money portfolio. I am simply showing what a sector rotation model might suggest if a given portfolio was due for a rebalance, and I do not update the information on a regular schedule or on technical triggers. There are many ways for a client to trade such a strategy, including monthly or quarterly rebalancing, perhaps with interim adjustments to the bullish/neutral/defensive bias when warranted, but not necessarily on the days that I happen to post this article. The enhanced strategy seeks higher returns by employing individual stocks (or stock options) that are also highly ranked, but this introduces greater risks and volatility. I do not track performance of the ideas mentioned here as a managed portfolio.
Disclosure: At the time of this writing, among the securities mentioned, the author held long positions on SLY, as well as inverse ETFs or protective puts on SPY and QQQ.
Disclaimer: This newsletter is published solely for informational purposes and is not to be construed as advice or a recommendation to specific individuals. Individuals should take into account their personal financial circumstances in acting on any opinions, commentary, rankings, or stock selections provided by Sabrient Systems or its wholly owned subsidiary, Gradient Analytics. Sabrient makes no representations that the techniques used in its rankings or analysis will result in or guarantee profits in trading. Trading involves risk, including possible loss of principal and other losses, and past performance is no indication of future results