Scott Martindale


  by Scott Martindale
  CEO, Sabrient Systems LLC

 Overview

Bullish conviction was severely tested in November for the first time since the April “Liberation Day” selloff. All the naysayers quickly piled on with warnings of an AI bubble and financial returns on immense capex not being realized for many years, if ever. To make matters worse, they warned of sluggish global liquidity growth in the face of rising debt and an impending “debt maturity wall,” i.e., enormous government and corporate refinancing that could overwhelm capital markets, surge borrowing rates, tighten lending standards, crowd out smaller businesses, and thereby constrain economic growth. But alas, the fear didn’t last long, as the old “bad news is good news” narrative was resurrected to predict increasingly dovish Fed monetary policy would save the day. Indeed, it appears that the S&P 500 still has a shot at finishing 2025 with its third straight year of 20%+ returns (which would be only the second time in history, after the five straight years of the 1995-99 dotcom/Y2K run). And yet the K-shaped economy (i.e., investor/creditor class vs. working/debtor class) is leaving too many citizens behind, particularly young and working-class people.

Remember the famous quote from the fearsome heavyweight champion boxer Mike Tyson, “Everyone has a plan until they get hit in the face”? Well, Steve Forbes had a similar quote for the stock market, “Everyone is a disciplined, long-term investor…until the market goes down.” Indeed, the AI-driven bull run seemed uninterruptable for over six months, with the S&P 500’s 50-day moving average providing reliable support all along the way…at least until 11/17 when for the first time in 138 days (since 4/30) the index closed below its 50-day moving average and triggered a panicky selloff. And then even after another incredible earnings report on 11/19 from market leader NVIDIA (NVDA) that sent the market surging higher on 11/20, by mid-day it came crashing back down on news suggesting maybe the jobs market really wasn’t so bad, which led to worries that the Fed might not cut this month after all, and the market finished the day with a big, ugly, red bearish-engulfing candle. As they say, the more overbought, the worse the correction.

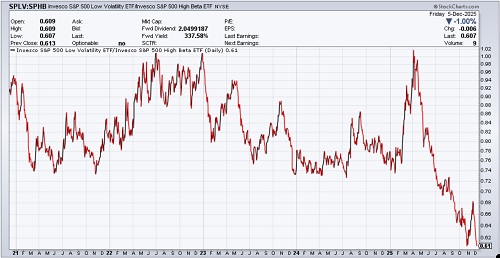
But thankfully, that big, bad, bearish-engulfing candle turned out to be a double-bottom (with the 10/10 low). The S&P 500 found support at its 100-day moving average and then embarked on a rally that has almost entirely retraced its fall from October’s all-time high. It has largely been a speculative “junk rally,” led by the “meme” stocks—like the Roundhill Meme Stock ETF (MEME) and the iShares Micro-cap ETF (IWC), followed by the lower-quality small-cap iShares Russell 2000 (IWM), in which about 40% are unprofitable, then the higher-quality small-cap SPDR S&P 600 (SPSM), in which all are required to be profitable for index entry, and with the mid and large caps trailing behind. Defensives have lagged since April, as illustrated in the chart below showing the ratio of the S&P 500 Low Volatility (SPLV) divided by the S&P 500 High Beta (SPHB), which after a brief jump during the November pullback has returned to its extreme low.

SPLV:SPHB ratio chart

Interestingly, the stock market briefly added a new member of the $1 trillion market cap club during the broad market correction, with drugmaker Lilly & Co. (LLY) enjoying a huge November surge (along with much of the Healthcare sector overall, in a mean reversion catch-up), largely driven by sales in its weight-loss drug Zepbound. So, as LLY pulled back, the trillion-dollar club today is back to 10 members—the original MAG-7 (NVDA, AAPL, GOOGL, MSFT, AMZN, META, TSLA) plus Broadcom (AVGO), Taiwan Semi (TSM), and Berkshire Hathaway (BRK.B).

Short-term technicals on the broad market indexes are overbought once again but still well supported within a bullish uptrend. Nevertheless, for the S&P 500 to hit the 20% return mark for the year will require a bullish catalyst. Most likely it will be the highly anticipated Fed rate cut this week, and importantly, some soothingly dovish words from chairman Jay Powell on additional easing measures plus guidance on the “dot plot” of future rate cuts. However, he can’t be overly dovish as to bring out the “bond vigilantes” in protest, spiking longer-term yields, which would not be favorable for stocks. Market maven Jim Bianco said in an interview on The Money Path that he thinks the tell will be in the number of FOMC member dissents on the expected rate cut, with several dissenters mollifying the bond vigilantes and no dissent angering them. So, Powell walks a tightrope on this, and messaging matters.

Regardless, the liquidity cycle is turning back up, with the Fed already halting its balance sheet reduction (quantitative tightening or QT) as of 12/1, and with more rate cuts in the offing, plus perhaps relaxed capital requirements for banks (like the enhanced supplementary leverage ratio or eSLR) and some form of "QE-lite" to gradually re-expand its balance sheet without antagonizing the bond market. All of this should result in rising M2 money supply. In addition, China has introduced fiscal stimulus and monetary tactics like repurchase operations (“repo”) and a lowered bank reserve requirement ratio (RRR). Furthermore, supply chain pressures are muted, fiscal expansion is underway with lower tax rates and less red tape from the One Big Beautiful Bill Act (OBBBA), and money market funds (aka cash on the sidelines) exceed $8 trillion (the highest ever).

In fact, the Atlanta Fed’s GDPNow is projecting real GDP growth of 3.5% growth in Q3, and forecasters think Q1 2026 might see US growth above 4% given the imminent fiscal impulse (including massive tax refunds in Q1) that should boost the struggling consumer. So, aggregate demand would be expected to rise, likely above the rate of aggregate supply since demand can shift much faster than supply can adjust to match. This would lift asset prices initially, which could be inflationary. As such, some market commentators believe the fed funds neutral rate should match the current rate of nominal GDP growth of 5-6%.

I’m not one of those people. I think any short-term inflationary pressures will be fleeting and offset by the secular disinflationary pressures I often describe: Global Supply Chain Pressure Index (GSCPI) continues to hover at or below the zero line (i.e., its historical average), the benefits of globalization (including comparative advantage) persist despite some strategic onshoring and supply chain diversification, there is a deflationary impulse from China as its dumps cheap goods on the world market in the face of weak domestic demand, and productivity continues to increase through automation and disruptive innovation (including Gen AI).

So, my long-held view remains that a terminal/neutral rate near 3.0% seems right, and the latest fed funds futures suggest 66% odds we get there next year—and that likelihood should increase with the appointment of a new Fed chairman in May (most likely economist Kevin Hassett). Bond yields have normalized with the 10-year Treasury under 4.2%. The flatter yield curve is a market signal to the Fed that it should cut on the short end. The economy needs lower interest rates, including a 30-year mortgage closer to 5%, in tandem with business-friendly fiscal policy and a weaker dollar to: a) sustain rising global liquidity, b) relieve indebted consumers and businesses, c) support US and global economies, and d) avert a global credit crisis. And once that neutral rate is achieved, the Fed can go back into the shadows where it was always intended to be and let fiscal, trade, and tax policies from Congress and the President dominate the news cycle. No more sitting on pins-and-needles at every FOMC meeting or Fed governor speaking engagement.

The return of the “bad news is good news” outlook has fed funds futures solidified at 89% odds of a December cut on 12/10. It also has pushed stocks to within spitting distance of new all-time highs. But notably, bitcoin and other cryptocurrencies corrected much more sharply than stocks, mostly due to deleveraging, and have not yet bounced back like stocks have. Nevertheless, blockchain, tokenization, and stablecoin implementation continue to progress, so I’m not concerned about my crypto allocation—in fact, bitcoin might have just put in a bottom at its 100-week moving average.

Yes, uncertainty persists around trade deals, wars, rising debt, civil strife, stock valuations, a hesitant Fed, and potential government shutdown redux in late January. But investors are positioning for tax and interest rate cuts, deregulation, tame inflation, strong margins & earnings, improving revenue growth, re-privatization, re-industrialization, fast-tracking of power generation infrastructure, robust capex and share buybacks, rising liquidity, a potential “peace dividend,” and a continued flow of foreign capital into the US. Importantly, DataTrek pointed out that Q3 corporate revenue increased by a multi-year record of +8.4%, which is critical for future earnings power—as earnings growth via sales growth is better than cost cutting (higher quality earnings beats). Also, they point out that the percentage of after-tax operating earnings that paid for dividends and stock buybacks has fallen from 96% in 2018 to 81% today, which suggests the difference is being reinvested in business growth—and supports today’s elevated valuations.

In my full commentary below, I talk in greater depth about the K-shaped economy, electricity prices, earnings, debt, inflation, jobs, and Fed policy, as well as the difficulty in “turning the economic ship”—from overreliance on vast, stifling government spending to a robust, unleashed private sector—in the face of political obstructionism, a hostile media, and the impatience of voters in feeling the benefits of the newly passed fiscal stimulus package and the Fed’s monetary stimulus on affordability and mortgage rates, pushing many of them (especially young people and the lower-income/non-asset-holding working class) to shortsightedly embrace the “free stuff” promises of socialist candidates.

I close my commentary by revealing Sabrient’s latest fundamental-based SectorCast quantitative rankings of the ten U.S. business sectors, current positioning of our sector rotation model, and several top-ranked ETF ideas. Top-ranked sectors in Sabrient’s SectorCast model include Technology, Healthcare, and Financials. In addition, Basic Materials, Industrials, and Energy also seem poised to eventually benefit from fiscal and monetary stimulus, domestic capex tailwinds, a burgeoning commodity Supercycle, rising demand for natural gas for power generation, and more-disciplined capital spending programs.

History shows that rising GDP growth, stable inflation, and falling interest rates tend to favor small caps. And because small cap indexes are more heavily allocated to Industrials, Basic Materials, and Financials, enhanced infrastructure spending and a revved-up economy could disproportionately benefit them. Indeed, rather than a continuation of the FOMO/YOLO momentum rally on the backs of a narrow group of AI leaders (and some speculative coattail riders), I expect the euphoria will be more tempered next year such that we get a healthy broadening and wider participation across caps and sectors and with a greater focus on quality and profitability. There are plenty of neglected high-quality names worthy of investment dollars. So, rather than the passive cap-weighted indexes, investors may be better served by active stock selection that seeks to identify under-the-radar, undervalued, high-quality gems primed for explosive growth. This is what Sabrient seeks to do in our various portfolios, all of which provide exposure to Value, Quality, Growth, and Size factors and to both secular and cyclical growth trends.

Concerningly, only 22% of active fund managers are outperforming their passive benchmark this year, largely due to the narrow market leadership from the AI-leading Big Tech titans. However, Sabrient has been performing well. We are best known for our 13-stock “Baker’s Dozen” growth portfolio franchise, which is issued quarterly as a 15-month unit investment trust (UIT) by First Trust Portfolios, and each is designed to offer the potential for outsized gains. For example, the Q1 2024 Baker’s Dozen terminated on 4/21/25 with a gross return of +45.7% vs. +8.2% for S&P 500, and the Q3 2024 portfolio terminated on 10/20/25 up +41.7% vs. +24.1% for S&P 500.

In addition, last year’s 33-stock Forward Looking Value 12 terminated on 11/10/25 up +19.9% vs. +12.7% for the S&P 500 Value Index. Also, small caps tend to benefit most from lower rates and deregulation, and high dividend payers become more appealing as bond alternatives as interest rates fall, so Sabrient’s quarterly Small Cap Growth and Sabrient Dividend (growth & income strategy) also might be timely as beneficiaries of a broadening market.

The Baker’s Dozen growth portfolio and three offshoot strategies for value, dividend, and small cap all leverage Sabrient’s process-driven, growth-at-a-reasonable-price methodology, which was developed by founder David Brown. All four strategies are described in his latest book, Moon Rocks to Power Stocks: Proven Stock Picking Method Revealed by NASA Scientist Turned Portfolio Manager (catch the low-price promotion this week only!). To learn more about both the book and the companion subscription product we offer (which does most of the stock evaluation work for you), please visit: https://DavidBrownInvestingBook.com

Click HERE to find this post in printable PDF format, as well as my latest Baker’s Dozen presentation slide deck and my 3-part series on “The Future of Energy, the Lifeblood of an Economy.” As always, I’d love to hear from you! Please feel free to email me your thoughts on this article or if you’d like me to speak on any of these topics at your event!  Read on….

Scott Martindale


  by Scott Martindale
  CEO, Sabrient Systems LLC

 Overview

Well, the FOMC followed the script and cut the fed funds rate (FFR) by 25 bps (from 4.25-4.50% range down to 4.00-4.25%) in an 18-1 vote. It was the first rate cut since December of last year—even though the rate needs to be 100 bps lower, in my view, as I have been advocating for quite some time, given the prior overreliance on government spending and hiring giving way to the growing impact of elevated rates on private sector growth and hiring, particularly within rate-sensitive industries. No more government largesse means the Fed must get busy with rate cuts. Market breadth was already improving in anticipation of the Fed’s dovish turn, with market segments like small caps, value stocks, banks, and transports perking up.

Although this was a relatively tepid move by the FOMC rather than the full-throated declaration of a new easing cycle that is needed, Fed chair Jerome Powell still believes monetary policy has officially shifted from "modestly restrictive" (his words at the July meeting) to "more neutral” today and characterized the latest rate cut as a "risk management" decision in light of slowing economic activity and jobs growth on the one hand, offset by sticky inflation on the other, which I discuss in greater depth in today’s post.

Of course, slashing FFR even 50 bps would give a panicky signal to the market, so newly appointed Fed Governor Stephen Miran was the lone dissenter, favoring 50 bps. Instead, they will proceed with gradual cuts on a steady path to eventually arrive at its long-term goal of a terminal FFR around 3.00% (2% inflation plus 1% neutral rate, aka “r-star”). The CME futures market now reflects 86% odds of two more 25-bp cuts this year (75 bps total for the year, bringing FFR down to 3.50-3.75%) and 78% odds of another two cuts next year (down to 3.00-3.25%)—as well as 50% odds of three cuts next year, despite the Fed’s own dot plot of two 25-bp cuts this year and just one in 2026. In my view, this will lead to more consumer spending, business borrowing for investment/capex, earnings growth, and stock buying (including retail, institutional, and share buybacks).

In response, the major indexes surged to new highs yet again. Any attempt at a pullback has been nothing more than an overbought technical correction/consolidation, as enthusiasm grows around the promise of AI revolutionizing our lives, workplace, and society at large, leading to rising productivity and prosperity. However, while we await the fully ripened fruits of these rapidly advancing technologies, stock gains have been driven more by multiple expansion in anticipation of great things to come, as well as a weaker dollar and surprisingly strong earnings growth—albeit driven more by cost-cutting and productivity growth than revenue growth, with net margins closing in on their 2021 peak of 13%.

Thus, lofty stock valuations and tight corporate bond spreads suggest an expectation that profitability and ROIC will remain strong for the foreseeable future despite the many storm clouds (such as geopolitical threats, ongoing hot wars, tariffs and unresolved trade negotiations, struggling global trading partners, sticky inflation metrics, weak jobs growth, social strife, and now a federal government shutdown). In fact, rather than investor fear manifesting in falling stock prices and rising market volatility, it instead seems to be reflected in the price of gold and silver, which have been surging.

Back in June, Mike Wilson of Morgan Stanley asserted, “we identified 4%-4.5% [on the 10-year yield] as the sweet spot for equity multiples, provided that growth and earnings stay on track.” Similarly, Goldman Sachs saw 4.5% acting as a ceiling for stock valuations. Wilson identified four factors that he believes would sustain market strength: 1) a trade deal with China (which China desperately needs sorted out), 2) stabilizing earnings revisions, 3) a more dovish Fed (i.e., rate cuts), and 4) the 10-year yield below 4% (without being driven by recessionary data). Indeed, all four have shown good progress.

From the 4/7 lows, retail investors flipped from tariff panic to FOMO/YOLO, and the rest of the investor world has jumped onboard. Speculative “meme” stocks have been hot, and AQR’s Quality-minus-Junk factor (aka “quality margin”) has been shrinking. Moreover, small caps have been surging, as evidenced by the Russell 2000 Small-cap Index (IWM) setting new all-time high last week (for the first time since 2021), which is a historically bullish signal, and the Russell Microcap Index (IWC) has done even better. Similarly, value stocks also have perked up, with the Invesco S&P 500 Pure Value ETF (RPV) also reaching a new high, and the transports, like the iShares Transportation ETF (IYT), seems bent on challenging its highs from last November.

The broad market was long overdue for a healthy broadening to bolster bullish conviction, and indeed it appears the ducks finally lined up to support it. This broadening bodes well for further upside as capital merely rotates rather than leave the market entirely. The Carson Group has observed that for every time since 1980 that the Fed cut rates while the market was within 2% of an all-time high (21 instances), stocks continued to rise over the ensuing 12 months. As Eric Peters of One River Asset Management opined, “There is no appetite for austerity within either party, so their preference is for inflation-resistant assets, which [suggests]…stocks, gold, bitcoin.”

Overall, there is no magic here, the setup is bullish for stocks, with improving market breadth (i.e., wider participation), as we enter Q4. But that’s not to say we won’t get a pullback in the near term. Chart technicals show a relative strength index (RSI) that has been in overbought territory for a historically long time, but I think any significant pullback would be a buyable event. So, following two solidly bullish years, I think this year also will finish strongly, with a potential third-straight 20%+ year (total return, assuming dividends reinvested) in the crosshairs. But the cautionary tale is that, while not unprecedented, a third straight 20%+ year has only happened once before in the past 100 years, during 1995-99, i.e., when it ran for five straight years during the dot-com boom (followed of course by the dot-com bust). Also, while I expect longer-duration yields (and by extension, mortgage rates) to eventually recede, be careful about jumping too aggressively into them, as elevated yields might remain sticky until federal debt and inflationary pressures have shown that they are indeed moderating, as I expect they will by early next year.

Although corporate insider buying has been weak, share buybacks have already set an annual record and are on track to hit $1.1 trillion by year end. Also, investor appetite for IPOs has returned in force, with 259 IPOs on US exchanges through Q3 2025, which is up 75% versus the same point in 2024, reflecting an abundance of both investor optimism and liquidity. And Electronic Arts (EA) is officially going private in the largest leveraged buyout (LBO) in history, at $55 billion.

Furthermore, the Atlanta Fed’s GDPNow Q3 forecast has risen to 3.8% (as of 10/1), interest rates are coming down across the curve, the US economy is holding up, corporate earnings momentum remains strong, the CBOE Volatility Index (VIX) remains low, the Global Supply Chain Pressure Index (GSCPI) remains at or below the zero line (i.e., its historical average), global liquidity and M2 growth is modest/supportive, new tax rates and deregulation from the One Big Beautiful Bill Act (OBBBA) are supportive and stimulative, exciting new technologies are accelerating, strategic reshoring and supply chain redundancies are underway (but not total deglobalization), and secular disinflationary trends and productivity growth have resumed. The only thing missing is a fed fund rate (FFR) at the neutral rate—which is around 3.0%, in my view.

However, as I discuss in my full post below, cautionary signals abound, so investors should be tactically vigilant in this environment of rising valuation multiples, overbought technicals, sluggish corporate revenue growth (with strong earnings growth based on margin expansion from productivity growth and cost-cutting), rising bankruptcies and delinquencies, and falling Leading Economic Indicators by focusing on high-quality companies and diversification (across sectors and asset classes) while holding hedges (like protective put options or inverse ETFs).

Top-ranked sectors in Sabrient’s model include Technology, Financials, Industrials, which all seem poised to benefit from stimulus and capex tailwinds. With the 10-2 and 30-2 Treasury yield spreads currently at 56 bps (4.10-3.54%) and 117 bps (4.71-3.54%) respectively—the highest since early 2022—the steepening yield curve should be favorable for regional banks, which borrow short and lend long (so a higher spread leads to higher profits). Also top-ranked in our model is Healthcare based mostly on valuation, and it indeed might be a sleeper opportunity, as (according to DataTrek Research) “US large cap Healthcare has lagged the S&P 500 by more than 4 standard deviations, a level of underperformance we’ve never seen in a major sector.” And while Energy sits at the bottom of our Outlook rankings, the sector also has earned consideration based on firmer oil prices and disciplined capital plans.

The Sabrient team focuses on fundamental quality—starting with a robust quantitative growth-at-a-reasonable-price (GARP) model followed by a detailed fundamental analysis and selection process—in selecting our Baker’s Dozen, Forward Looking Value, Dividend, and Small Cap Growth portfolios, which are packaged and distributed as UITs by First Trust Portfolios. By the way, the new Small Cap Growth (SCG 48) portfolio launches on Friday 10/3, so 10/2 is the final day to get into SCG 47, which is off to a good start, led by SSR Mining (SSRM) and Mercury Systems (MRCY) among its 44 holdings. The Q3 2025 Baker’s Dozen has also started off well, led by Sterling Infrastructure (STRL) and Valero Energy (VLO) among its 13 concentrated positions, as has our annual Forward Looking Value (FLV 13) portfolio. In fact, most of our 20 live portfolios are doing well versus their relevant benchmarks. Again, value and small caps seem like good ideas for a broadening market.

Notably, our proprietary Earnings Quality Rank (EQR) is a key factor used in our internal models, and it is also licensed to the actively managed First Trust Long-Short ETF (FTLS) as a quality prescreen. In fact, you can find our EQR score along with 8 other proprietary factor scores for roughly 4,000 US-listed stocks in our next-generation Sabrient Scorecards, which are powerful digital tools that rank stocks and ETFs using our proprietary factors. You can learn more about them by visiting: http://HighPerformanceStockPortfolios.com.

In today’s post, I discuss Fed policy, the modest inflationary pressures, the weak private sector jobs market, solid-but-fragile economic growth outlook, lofty stock valuations, and the case for value and small caps given emerging monetary and fiscal support. I also reveal Sabrient’s latest fundamental-based SectorCast quantitative rankings of the ten U.S. business sectors, current positioning of our sector rotation model, and several top-ranked ETF ideas. Click HERE to find this post in printable PDF format, as well as my latest presentation slide deck and my 3-part series on “The Future of Energy, the Lifeblood of an Economy.”

As always, please email me your thoughts on this article, and feel free to contact me about speaking on any of these topics at your event!  Read on….

Scott Martindale  by Scott Martindale
  President & CEO, Sabrient Systems LLC

It would be an understatement to say that last week was particularly eventful, what with the elections and FOMC policy decision, plus some impressive earnings announcements. Election Day is finally behind us, and the results sent investors into a fit of stock market FOMO—in one of the greatest post-election rallies ever—while dumping their bonds. Much like the day after President Trump’s win in 2016, the leading sectors were cyclicals: Industrials, Energy, Financials. And then on Fed Day, markets got their locked-in 25-bp rate cut, and the rally kept going across all risk assets, including strengthening the US dollar on the expectation of accelerating capital flight into the US as Trump’s policies, particularly with support from a Republican-led congress, should be quite business-friendly, with lower tax rates and red tape and much less focus on anti-trust lawfare.

So, there was a lot for investors to absorb last week, and this week brings the October CPI and PPI reports. Indeed, the whole world has been pining for clarity from the US—and they got it. And I’m sure no one misses the barrage of political ads and bitter electioneering. Hopefully, it marks the peak in election divisiveness our society will ever see again. Notably, inflation hedges gold and bitcoin have suddenly diverged, with gold pulling back from its all-time high while bitcoin—which can be considered both a dollar hedge and a risk asset for its utility—has continued its surge to new highs (now over $85k as I write!) on the added optimism around Trump’s crypto-friendly stance.

Besides expectations of a highly aggressive 15% earnings growth in the S&P 500 over the next couple of years, venture capital could be entering a boom following four years of difficulty in raising capital. In an interview with Yahoo Finance, Silicon Valley VC Shervin Pishevar opined, “I think there’s going to be a renaissance of innovation in America…It’s going to be exciting to see… AI is going to accelerate so fast we’re going to reach AGI [Artificial General Intelligence, or human-like thinking] within the next 2-3 years. I think there will be ‘Manhattan Projects’ for AI, quantum computing, biotech.”

It all sounds quite appealing, but there’s always a Wall of Worry for investors, and the worry now is whether Trump’s pro-growth policies like reducing tax rates, deregulation, rooting out government waste and inefficiency (i.e., “drain the swamp”) combined with his more controversial intentions like tariffs, mass deportations of cheap migrant labor, and threats to Big Pharma, the food industry, and key trading partners (including Mexico)—in concert with a dovish Fed—will create a resurgence in inflation and unemployment and push the federal debt and budget deficit to new heights before the economy is ready to stand on its own—i.e., without the massive federal deficit spending and hiring we saw under Biden—thus creating a period of stagflation and perhaps a credit crisis. Rising interest rates and a stronger dollar are creating tighter financial conditions and what Michael Howell of CrossBorder Capital calls “a fast-approaching debt maturity wall” that adds to his concerns that 2025 might prove tougher for investors if the Global Liquidity cycle peaks and starts to decline.

But in my view, the end goals of shrinking the size and scope of our federal government and restoring a free, private-sector-driven economy are worthy, and we can weather any short-term pain along the way and perhaps fend off that looming “debt maturity wall.” Nevertheless, given the current speculative fervor (“animal spirits”) and multiple expansion in the face of surging bond yields (i.e., the risk-free discount rate on earnings streams), it might be time to exercise some caution and perhaps put on some downside hedges. Remember the old adage, “Stocks take the stairs up and the elevator down” (be sure to read my recent post with 55 timeless investing proverbs to live by).

In any case, at the moment, I believe the stock market has gotten a bit ahead of itself with frothy valuations and extremely overbought technical conditions (with the major indexes at more than two standard deviations above their 50-day moving averages). But I think any significant pullback or technical consolidation to allow the moving averages to catch up would be a buying opportunity into year-end and through 2025, and perhaps well into 2026—assuming the new administration’s policies go according to plan. As DataTrek Research pointed out, there is plenty of dry powder to buy stocks as cash balances are high (an average of 19.2% of institutional portfolios vs.10-15% during the bull market of the 2010’s).

This presumes that the proverbial “Fed Put” is indeed back in play. Also, I continue to believe that rate normalization means the FOMC ultimately taking the fed funds rate down to a terminal rate of about 3.0-3.5%—although I’m now leaning toward the higher side of that range as new fiscal policy from the “red wave” recharges private-sector growth (so that GDP and jobs are no longer reliant on government deficit spending and hiring) and potentially reignites some inflationary pressures.

This is not necessarily a bad thing. Although inflation combined with stagnant growth creates the dreaded “stagflation,” moderate inflation with robust growth (again, driven by the private sector rather than the government) can be healthy for the economy, business, and workers while also helping to “inflate away” our massive debt. Already, although supply chain pressures remain low, inflation has perked up a bit recently, likely due to rising global liquidity and government spending, as I discuss in detail in today’s post.

So, my suggestions remain: Buy high-quality businesses at reasonable prices, hold inflation hedges like gold and bitcoin, and be prepared to exploit any market correction—both as stocks sell off (such as by buying out-of-the-money put options, while VIX is low) and as they begin to rebound (by buying stocks and options when share prices are down). A high-quality company is one that is fundamentally strong (across any market cap) in that it displays consistent, reliable, and accelerating sales and earnings growth, positive revisions to Wall Street analysts’ consensus estimates, rising profit margins and free cash flow, solid earnings quality, and low debt burden. These are the factors Sabrient employs in selecting the growth-oriented Baker’s Dozen (our “Top 13” stocks), the value-oriented Forward Looking Value, the growth & income-oriented Dividend portfolio, and Small Cap Growth. We also use many of those factors in our SectorCast ETF ranking model. And notably, our Earnings Quality Rank (EQR) is a key factor in each of these models, and it is also licensed to the actively managed, absolute-return-oriented First Trust Long-Short ETF (FTLS).

Each of our key alpha factors and their usage within Sabrient’s Growth, Value, Dividend, and Small Cap investing strategies (which underly those aforementioned portfolios) is discussed in detail in Sabrient founder David Brown’s new book, How to Build High Performance Stock Portfolios, which is now available to buy in both paperback and eBook formats on Amazon.com.

David Brown's book link

And in conjunction with David’s new book, we are also offering a subscription to our next-generation Sabrient Scorecard for Stocks, which is a downloadable spreadsheet displaying our Top 30 highest-ranked stock picks for each of those 4 investing strategies. And as a bonus, we also provide our Scorecard for ETFs that scores and ranks roughly 1,400 US-listed equity ETFs. Both Scorecards are posted weekly in Excel format and allow you to see how your stocks and ETFs rank in our system…or for identifying the top-ranked stocks and ETFs (or for weighted combinations of our alpha factors). You can learn more about both the book and the next-gen Scorecards (and download a free sample scorecard) at http://DavidBrownInvestingBook.com.

In today’s post, I dissect in greater detail GDP, jobs, federal debt, inflation, corporate earnings, stock valuations, technological trends, and what might lie ahead for the stock market with the incoming administration. I also discuss Sabrient’s latest fundamental-based SectorCast quantitative rankings of the ten U.S. business sectors, current positioning of our sector rotation model, and several top-ranked ETF ideas. And be sure to check out my Final Thoughts section in which I offer my post-mortem on the election.

Click HERE to continue reading my full commentary or to sign up for email delivery of this monthly market letter. Also, here is a link to this post in printable PDF format. I invite you to share it as appropriate (to the extent your compliance allows).

Scott Martindale  by Scott Martindale
  President & CEO, Sabrient Systems LLC

I have been warning that the longer the market goes up without a significant pullback, the worse the ultimate correction is likely to be. So, with that in mind, we might not have seen the lows for the year quite yet, as I discuss in the chart analysis later in this post. January saw a maximum intraday peak-to-trough drawdown on the S&P 500 of -12.3% and the worst monthly performance (-5.3%) for the S&P 500 since March 2020 (-12.4%). It was the worst performance for the month of January since 2009 (during the final capitulation phase of the financial crisis) and one of the five worst performances for any January since 1980. The CBOE Volatility Index (VIX), aka “fear gauge,” briefly spiked to nearly 39 before settling back down to the low-20s.

It primarily was driven by persistently high inflation readings – and a suddenly hawkish-sounding Federal Reserve – as the CPI for the 12 months ending in December came in at 7.0% YoY, which was the largest increase for any calendar year since 1981. Then on Feb 10, the BLS released a 7.5% CPI for January, the highest YoY monthly reading since 1982. Of course, stocks fell hard, and the 10-year T-note briefly spiked above 2% for the first time since August 2019.

Looking under the hood is even worse. Twelve months ago, new 52-week highs were vastly outpacing new 52-week lows. But this year, even though new highs on the broad indexes were achieved during January, we see that 2/3 of the 3,650 stocks in the Nasdaq Composite have fallen at least 20% at some point over the past 12 months – and over half the stocks in the index continue to trade at prices 40% or more below their peaks, including prominent names like DocuSign (DOCU), Peloton Interactive (PTON), and of course, Meta Platforms, nee Facebook (FB). Likewise, speculative funds have fallen, including the popular ARK Innovation ETF (ARKK), which has been down as much as -60% from its high exactly one year ago (and which continues to score near the bottom of Sabrient’s fundamentals based SectorCast ETF rankings).

Pundits are saying that the “Buy the Dip” mentality has suddenly turned into “Sell the Rip” (i.e., rallies) in the belief that the fuel for rising asset prices (i.e., unlimited money supply and zero interest rates) soon will be taken away. To be sure, the inflation numbers are scary and unfamiliar. In fact, only a minority of the population likely can even remember what those days of high inflation were like; most of the population only has experienced decades of falling CPI. But comparing the latest CPI prints to those from 40 years ago has little relevance, in my view, as I discuss in the commentary below. I continue to believe inflation has been driven by the snapback in demand coupled with slow recovery in hobbled supply chains – largely due to “Nanny State” restrictions – and that inflationary pressures are peaking and likely to fall as the year progresses.

In response, the Federal Reserve has been talking down animal spirits and talking up interest rates without actually doing much of anything yet other than tapering its bond buying and releasing some thoughts and guidance. The Fed’s challenge will be to raise rates enough to dampen inflation without overshooting and causing a recession, i.e., the classic policy mistake. My prediction is there will be three rate hikes over the course of the year, plus some modest unwinding of its $9 trillion balance sheet by letting some maturing bonds roll off. Note that Monday’s emergency FOMC meeting did not result in a rate hike due to broad global uncertainties.

Longer term, I do not believe the Fed will be able to “normalize” interest rates over the next decade, much less the next couple of years, without causing severe pain in the economy and in the stock and bond markets. Our economy is simply too levered and “financialized” to absorb a “normalized” level of interest rates. But if governments around the world (starting with the US and Canada!) can stand aside and let the economy work without heavy-handed societal restrictions and fearmongering, we might see the high supply-driven excess-demand gap close much more quickly.

In this periodic update, I provide a comprehensive market commentary, offer my technical analysis of the S&P 500 chart, review Sabrient’s latest fundamentals based SectorCast quant rankings of the ten US business sectors, and serve up some actionable ETF trading ideas. To summarize, our SectorCast rankings reflect a bullish bias, with the top three scorers being deep-cyclical sectors, Energy, Basic Materials, and Financials. In addition, the near-term technical picture remains weak, and our sector rotation model moved from a neutral to a defensive posture this week as the market has pulled back.

Overall, I expect a continuation of the nascent rotation from aggressive growth and many “malinvestments” that were popular during the speculative recovery phase into the value and quality factors as the Fed tries to rein in the speculation-inducing liquidity bubble. And although I don’t foresee a major selloff in the high-valuation-multiple mega-cap Tech names, I think investors can find better opportunities this year among high-quality stocks outside of the Big Tech favorites – particularly among small and mid-caps – due to lower valuations and/or higher growth rates, plus some of the high-quality secular growth names that were essentially the proverbial “baby thrown out with the bathwater.” But that’s not say we aren’t in for further downside in this market over the near term. In fact, I think we will see continued volatility and technical weakness over the next few months – until the Fed’s policy moves become clearer – before the market turns sustainably higher later in the year.

Regardless, Sabrient’s Baker’s Dozen, Dividend, and Small Cap Growth portfolios leverage our enhanced Growth at a Reasonable Price (GARP) selection approach (which combines quality, value, and growth factors) to provide exposure to both the longer-term secular growth trends and the shorter-term cyclical growth and value-based opportunities – without sacrificing strong performance potential. Sabrient’s new Q1 2022 Baker’s Dozen launched on 1/20/2022 and is already off to a good start versus the benchmark. In addition, our Dividend and Small Cap Growth portfolios have been performing well versus their benchmarks. In fact, all 7 of the Small Cap Growth portfolios launched since the March 2020 COVID selloff have outperformed the S&P 600 SmallCap Growth ETF (SLYG), and 7 of the 8 Dividend portfolios have outperformed the S&P 500 (SPY). In particular, the Energy sector still seems like a good bet, as indicated by its low valuation and high score in our SectorCast ETF rankings.

Furthermore, we have created the Sabrient Quality Index Series comprising 5 broad-market and 5 sector-specific, rules-based, strategic beta and thematic indexes for ETF licensing, which we are pitching to various ETF issuers. Please ask your favorite ETF wholesaler to mention it to their product team!
Read on....

Scott MartindaleHere in Santa Barbara, we refer to the annual summer ritual of heavy marine layer engulfing the coastline for much of the day as the “June gloom.” It can be frustrating to beach-going visitors since there are otherwise no clouds, and the inland areas are brilliantly sunny.

smartindale / Tag: CREE, SNDK, BRK.B, MA, ETF, iShares, sectors, SPY, VIX, SPLV, DEF, IYF, iyw, IYH, IYE, IYK, IDU, IYC, IYJ, IYZ, IYM / 0 Comments