by
Scott Martindale
President & CEO, Sabrient Systems LLC
Overview
Market indexes regained all of their losses since the president’s “Liberation Day” tariff announcement one month ago, culminating in an historic +10% 9-day rally for the S&P 500 (and +18% from its 4/7 intraday low) that sent it back above its 20-day and 50-day moving averages to test resistance at its 200-day. But was this just a short-covering relief rally as bearish commentators assert? I said in my April post that the $10 trillion that left the stock market was not the “capital destruction” they claimed, like a wildfire burning down homes, but rather a rotation into the safety of bonds and cash that could quickly rotate back. Sure enough, when retail investors swooped in to scoop up the suddenly fair valuations of the capitulation selloff, leveraged algo momentum traders quickly joined in. But while I think the longer term holds promise, the chart became short-term overbought (and is pulling back this week), and macro conditions are still treacherous, keeping investors jittery and headline-driven. So, the market remains fragile even as we wind down a solid Q1 earnings reporting season, with the FOMC policy announcement on tap this week.
Nevertheless, in my view, positive signs are emerging to suggest: 1) the trade war (particularly with China) and the hot war in Ukraine will both find their way to a resolution, 2) the fiscal legislation (“one big, beautiful bill”) with new tax cuts working its way through congress will soon be passed, 3) the size and scope of federal government that has crowded out the private sector is shrinking and making way for re-privatization and de-regulation of the economy to unleash organic private sector growth, 4) corporate earnings and capex commitments remain strong, and 5) the Federal Reserve will ensure liquidity growth and restart its rate-cutting cycle like other central banks—and liquidity leads pricing in risk asset markets, gold, and cryptocurrencies. So, I think the noise will quiet and the clouds will clear, making way for a renewed focus on corporate earnings and global liquidity to power forward the economy and stocks. And don’t forget—the market loves to climb a wall of worry, which means it discounts the future and typically turns well in advance of the economic and sentiment metrics.
Of course, the biggest news that juiced the stock market is the apparent offramp forming for the trade stalemate between the US and China. Publicly, China has been saber-rattling as a Trumpian bargaining tactic, in my view, and to stoke the flames of political division in our country with midterms on the docket next year—something the CCP doesn’t have to worry much about. Indeed, it has been loath to give an inch even though its economy was already struggling with deflation, a long-running property crisis, sluggish consumer demand, overcapacity, and weak business and consumer confidence well before the recent tariff escalation. Its services PMI just hit a 7-month low, its manufacturing PMI has officially fallen into contraction at 49.0, and its new export orders component plunged to the lowest reading since the pandemic at 44.7. And although China insists the US “unilaterally” started the trade war, the truth is we are finally pushing back after years of turning a blind eye to their tariffs, IP theft, forced technology transfers, hacking, state subsidies, dumping of goods, fentanyl trafficking, and currency manipulation.
In my view, the US is in far better position to weather a brief trade war than mercantilist China. As Treasury Secretary Scott Bessent succinctly articulated, “China’s business model is predicated on selling cheap, subsidized goods to the US, and if there is a sudden stop in that, they will have a sudden stop in their economy. So, they will negotiate.” Both governments know that an escalating trade war with big tariffs and a tight US Federal Reserve is especially bad for China. The dollar/yuan exchange rate is crucially important to China, and the dollar today is nearly as strong it has been against the yuan since yuan’s devaluation during the Global Financial Crisis. With its massive dollar-denominated debt, a weaker dollar relieves China’s financial strain by boosting global liquidity to the benefit of both countries. So, despite its theatrical saber-rattling, China needs a trade deal that ensures a weaker dollar to shore up the yuan and reduce capital flight.
Indeed, we are now hearing from China that “the door is open” to trade talks, and its security czar is evaluating ways to address the use of Chinese precursor chemicals by Mexican cartels to produce fentanyl for distribution in the US. Moreover, although the Port of Los Angeles announced that volumes will fall be 1/3 as several major American retailers are halting all shipments from China, in reality, American businesses as usual are finding a way to succeed (and skirt the most onerous tariffs) by rerouting supply chains through 3rd party countries like Vietnam and Mexico (“trans-shipping”) and delivering to bonded warehouses to delay the official receipt of goods. Also offsetting the tariffs is the 10% drop in the dollar index.
Looking ahead, although volatility likely will remain elevated for the next few months, unless something crazy comes out of left field, I think the market has seen its lows, and the path of least resistance is higher. American consumers, corporations, and entrepreneurs are optimistic by nature and are always pushing boundaries and seeking a path forward, rather than sitting on their hands waiting for government to tell them what to do. And of course, President Trump is not one to sit on his hands for one minute in his effort to “fix” our unsustainable “death spiral” of inflation, debt, deficit spending, offshoring, and hyper-financialization.
But then we have the FOMC, whose members have been quite happy to sit on their hands in the face of tariff turmoil, falling inflation, and slowing GDP and jobs growth. Among the 19 FOMC participants (the 7 Board of Governors and 12 Reserve Bank regional presidents, which includes both the 12 voting members and the 7 non-voting members who serve as voting members on a rotating basis), they almost unanimously (18 of 19) agreed at their March meeting that growth and employment risks are skewed to the downside while inflation risks are skewed to the upside. Overall, the Fed has taken a dovish stance but will be reactive to sudden distress in growth and jobs rather than proactive in preventing such distress.
Although Fed Chair Powell often talks about tariffs as being inflationary, in fact tariffs are deflationary like all forms of taxation—i.e., without a commensurate increase in income or credit, they necessitate a rethinking and reallocation of one’s existing disposable income. Furthermore, Powell & Co. seem to be ignoring the deflationary signals of falling oil prices, slowing household consumption, declining savings rates, and rising delinquencies. Inflation metrics are pulling back after being propped up by elevated energy prices and long-lag components (like shelter costs) and the prior administration’s profligate federal deficit spending that overshadowed—and indeed created—sluggish growth in the private sector. I talk more about inflation metrics and expectations for next week’s CPI and PPI releases in my full commentary below.
To be fair, government spending (to the tune of nearly 6.5% of GDP) exacerbated the inflation and private sector malaise it created by making it difficult for the Powell & Co. to justify helping out the private sector with lower interest rates, thus crowding out the efficient capital allocation and high return on investment of the private sector with the inefficient capital allocation of bloated government boondoggles. Economist Michael Howell of CrossBorder Capital reminds us that “public debt is expanding faster than private debt, fueled by welfare commitments and rising interest burdens, ensuring persistent liquidity growth.” Importantly, Howell persuasively asserts that, “monetary policy must prioritize liquidity over inflation” concerns, so the Fed’s current hands-off, higher-for-longer, reactionary approach risks causing a liquidity crunch. In his view, “The modern financial system is a fragile, collateral-driven mechanism, and one that requires constant intervention [through proactive management] to avoid collapse.”
As Andrew Lees of MacroStrategy Partners has pointed out, “Economies naturally self-order productively when not constrained by excessive regulation and over-bearing government intervention. The current "financialized" economic system as it is, is dependent on debt and unproductive use of capital (Wall Street vs Main Street).” The private sector has proven to be much better at the efficient and highly productive allocation of capital to maximize ROI. So, as Secretary Bessent has described, the Trump administration seeks to reduce the budget deficit to 3% of GDP and increase real GDP growth to 3%, which would lead to the same kind of small-government/strong-private-sector economy that has turned around a foundering Argentina under President Milei.
The May FOMC meeting convenes this week, so we shall see. CME Group fed funds futures show only 3% odds of a 25-bp rate cut, but increases to 32% at the June meeting, and 78% odds of at least 75 bps (3 cuts) by year-end. In my view, they should be readying for 50 bps in rate cuts by July and a target neutral rate of around 3.25-3.50% by early 2026. Certainly the 2-year Treasury yield (the shortest term that is substantially market driven) at 3.80% (as of 5/6) is signaling to the Fed that rates should be much lower than the current 4.25-4.50% fed funds rate. According to a recent post by AlpineMacro, “…the current 10-2 year spread in the bond market is not sustainable, particularly if the economy slows sharply. Ultimately, the long end of the curve will gravitate to the short end, particularly when investors realize that tariff-induced price increases are temporary.” Notably, projections on bond issuance from Secretary Bessent suggest a gradual return to an 80/20 split between T-bonds & notes (80%) versus T-bills (20%) going forward as opposed to the nearly 100% allocation to T-bills (< 1 year) under his predecessor Janet Yellen.
I have been insisting for some time that the FFR needs to be 100 bps lower, as the US economy's headline GDP and jobs numbers were long artificially propped up by excessive, inefficient, and often unproductive federal deficit spending, while the hamstrung private sector has seen sluggish growth. Moreover, today’s DOGE-led spending cuts, trade war uncertainty, and with budget reconciliation and fiscal legislation still in progress have removed much of that artificial stimulus. But regardless of the May FOMC decision, I expect the rate-cutting cycle to restart in June and signed trade deals with our 18 key trading partners beginning this month.
But for the near term, until those things come to fruition, I continue to expect stocks will remain volatile (with VIX above the 20 “fear threshold” but below the 30 “panic threshold”). CNN's Fear & Greed Index just jumped from "Fear” to “Greed” on the dial but remains volatile. The American Association of Individual Investors' ("AAII") Investor Sentiment Survey has shown more than 50% bearish (vs. historical average of 31%) for 10 consecutive weeks, which is the longest streak since 1990. Capital flows reflect a sharp drop in foreign capital flight into US bonds and equities over the past two months in something of a “buyers’ strike,” adding pressure to the US dollar. And last week saw a negative Q1 GDP print, somewhat offset by an upside beat from the jobs report and rising labor force participation.
There are certainly plenty of high-profile bears. One market technician I respect a lot, A.J. Monte of Sticky Trades, still believes stocks will eventually retest their pandemic lows (!). He warned of the dreaded “death cross” when the 50-day moving average crossed down through the 200-day moving average on 4/12. And then we have Christoper Wood of Jefferies, who believes that US stocks saw a permanent (!) peak last December (at lofty valuations) and will never (!) see those levels again—much like Japan’s market peak in 1989. Instead of US stocks, Wood thinks investors should buy Europe, China, Japan, and India. Others have pronounced that the US brand is permanently damaged and that we have witnessed the end of “American exceptionalism.” Heavy sigh.
Call me overly patriotic with rose-colored glasses, but my view is a little different. Capital tends to flow to where it is most welcome and earns its highest returns, so the recent falling tide of foreign capital flight leaving the US will surely return once visibility clears and the dollar firms up. Most any foreign investor will tell you there is no other place in the world to invest capital for the innovation and expected return than the US given our entrepreneurial culture, technological leadership in disruptive innovation, strong focus on building shareholder value, low interest-rate exposure, global scalability, wide protective moats, and our reliable and consistently strong earnings growth, free cash flow, margins, and return ratios, particularly among the dominant, cash flush, Big Tech titans, which continue to use their piles of cash to seed AI startups and other disruptive technologies. Notably, the US boasts more than 50% of the world’s privately owned late-stage start-ups valued at over $1 billion (aka “unicorns”) and leads in R&D spending and patent applications.
Moreover, it’s not just the Technology sector that is appealing to investors. As BlackRock wrote in their Q2 2025 Equity Market Outlook, “Commentators will often cite the prevalence of a large number of Tech companies in the U.S. as the driver of U.S. equity dominance. But our analysis points to wider breadth in U.S. quality. Current return on tangible invested capital (ROTIC), a proxy for a company’s ability to allocate capital for optimal profitability, is significantly higher in the U.S. than elsewhere in the world, suggesting quality exists not in pockets but across sectors.”
As Kevin O’Leary has opined, “Our number one export is the American dream. Everyone wants to come to America and start a business and become personally free." And this will not change just because our president seeks to incentivize the private sector to strategically reshore manufacturing with the ultimate goals of reviving the middle class, narrowing the wealth gap, reducing the trade deficit, ensuring reliable supply chains, and reinforcing national security. Moreover, Trump’s federal cost-cutting, tariff regime, and America-First rhetoric does not aim for absolute deglobalization, fiscal austerity, mercantilism, and isolationism as the MSM would have you believe, but rather to simply rebalance a system that had become completely out of balance—and indeed was falling into that aforementioned death spiral of rising inflation, debt, deficit spending, offshoring, and hyper-financialization. The rebalancing involves re-privatization and de-regulation rather than relying on massive government spending—and what I call “smart austerity” to eliminate waste, fraud, abuse, corruption and unaccountability, plus a “peace dividend” from ending the war in Ukraine.
So, I continue to believe the macro uncertainty and jittery market will ultimately give way to a melt-up, sending the market to back near its highs of Q1 by year-end or early-2026, driven by rising global liquidity, a weaker US dollar, reduced wasteful/reckless government spending and regulatory red tape, lower interest and tax rates, massive corporate capex, and the “animal spirits” of a rejuvenated private sector and housing market.
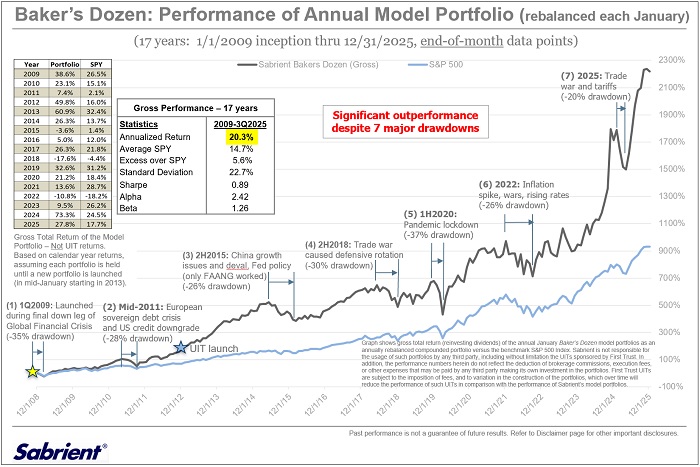
The early April selloff brought down some of the loftiest valuations among the popular mega-cap stocks, with the forward P/E on the S&P 500 falling to 18.5x on 4/8 versus 22.7x at its February peak and today’s 20.6x (as of 5/5). In fact, many of the prominent names in the Technology and Communication Services sectors saw their valuations retreat such that they are scoring well in Sabrient’s growth models (as shown in our next-gen Sabrient Scorecards subscription product)—including large caps like Taiwan Semiconductor (TSM), Broadcom (AVGO), and Spotify (SPOT) that are in the new Q2 2025 Sabrient Baker’s Dozen portfolio, and small caps like Freshworks (FRSH), QuinStreet (QNST), and RingCentral (RNG) that are in our new Sabrient Small Cap Growth 46 portfolio. These portfolios along with Sabrient Dividend 51 (a growth & income strategy yielding 4.05% as of 5/5) are packaged and distributed quarterly to the financial advisor community as unit investment trusts through First Trust Portfolios.
Indeed, rather than the passive cap-weighted indexes dominated by Big Tech, investors may be better served by active stock selection that seeks to identify under-the-radar and undervalued gems primed for explosive growth—many of whom could coattail on the Big Tech names and provide greater returns. This is what Sabrient seeks to do in our various portfolios, all of which provide exposure to Value, Quality, Growth, and Size factors and to both secular and cyclical growth trends.
As a reminder, the “Size” factor refers to market cap and the Fama French study that showed small caps historically tend to outperform over time. Although that has not been the case for the small cap indexes (like Russell 2000) for most of the past 20 years, I still think the small cap universe is where to find the most explosive growth opportunities, even if the broad passive indexes can't keep up. So, insightful active selection is important for small cap investing—which is easier to do given the relative lack of analyst coverage and institutional ownership of small caps.
For each of our portfolios, we seek high-quality, fundamentally strong companies displaying a history of consistent, reliable, and accelerating sales and earnings growth, rising profit margins and free cash flow, solid earnings quality, low debt burden, and a reasonable valuation. Notably, our proprietary Earnings Quality Rank (EQR) is a key factor in each of our growth, value, dividend, and small cap models, and it is also licensed to the actively managed First Trust Long-Short ETF (FTLS).
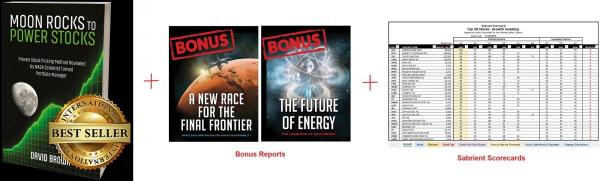
Sabrient founder David Brown describes these and other factors as well as his portfolio construction process in his latest book. David describes his path from NASA engineer in the Apollo moon landing program to creating quant models for ranking stocks and building stock portfolios. And as a companion product to the book, we have launched next-gen versions of Sabrient Scorecards for Stocks and ETFs. You can learn more about both the book and scorecards by visiting: http://DavidBrownInvestingBook.com.
In my full commentary below, I discuss earnings, gold, tariffs, inflation, global liquidity, the power of free market capitalism, and the imminent “bullish triumvirate” of tariff resolution, tax cuts, and deregulation. I also discuss Sabrient’s latest fundamental-based SectorCast quantitative rankings of the ten U.S. business sectors, current positioning of our sector rotation model, and several top-ranked ETF ideas. Our model likes Technology, Healthcare, Communication Services sectors, and assuming interest rates indeed come down and liquidity rises as I expect, I also like dividend stocks and gold. HERE is a link to this post in printable PDF format.
I had so much to say this month that I decided to defer until next month my in-depth commentary on the exciting new developments in energy and electrical generation. Please contact me to speak on any of these topics at your event! Read on….