Sector Detector: Fed policy uncertainty roils markets while the OBBBA kicks into full gear

by Scott Martindale
CEO, Sabrient Systems LLC
Quick note: If you are a financial advisor who would like to see Sabrient portfolios packaged in an ETF wrapper, please drop me an email (or suggest it to your local ETF wholesaler). We have a line-up of active and passive alpha-seeking portfolios and indexes ready to go!
Overview
The January BLS jobs report strengthened while CPI cooled—a match made in heaven for the economy, right? But investors are grappling with what it portends for Fed monetary policy, particularly given the impending changing of the guard at the Fed. That seems to be all the market cares about at the moment. But of course, in the longer term, these trends bode well for lower interest rates and growth in GDP, earnings, and stock prices, particularly given full implementation of the One Big Beautiful Bill Act (OBBBA), which focuses on tax reform, deregulation, energy production, border security, and broad support for the private sector to retake its rightful place as the primary engine of growth via re-privatization, reshoring, and re-industrialization, with much more efficient capital allocation and ROI than government. All told, I think the GDP, jobs, and inflation story suggests room for more rate cuts, as I discuss in detail in my full commentary below.
As I expected, particularly after a third straight strong year for the market, stocks have been more volatile during Q1, with the CBOE Volatility Index (VIX) climbing back above the 20 “fear threshold.” Energy, Basic Materials, high-dividend payers (aka “bond proxies”), defensive sectors Consumer Staples and Telecom, small caps and equal-weight versions of the major indexes have all significantly outperformed the long-time high-flying mega-cap Tech-dominated S&P 500 and Nasdaq 100 that have been so hard to beat for so long.
February has been marked by rising volatility plus much wailing and gnashing of teeth as the AI story (big investments now for even bigger returns and productivity growth in the near future) is suddenly being questioned. No doubt, stocks have seen the manifestation of investor worries of disappointing or delayed ROI on the massive capex for AI, as well as a crowding out of other uses for the cash, such as for dividends and share buybacks. In addition, the concern that AI will make all current software/SaaS companies obsolete has cut down most software stocks at the knees. And then we have the impact of Kevin Warsh’s nomination for Fed chair, which initially sent commodities (including surging gold and silver) into a tailspin on expectation of (heaven forbid!) tighter policy, lower debt, and a stronger dollar—which used to be considered good things and signs of a robust economy.
In addition, the macro clouds of uncertainty persist regarding trade deals and tariffs, the intractable Ukraine/Russia war, the Venezuela, Cuba, and Iran situations (which also impact China, Russia, and oil markets broadly), enforcement of immigration law, civil strife in US cities, political polarization, imminent midterm elections, Fed policy uncertainty, a stagnant “no-hire, no-fire” jobs market, signs of consumer distress, another partial government shutdown (or in this case, just the DHS), and rising federal debt now approaching $39 trillion (of which $31 trillion held by the global public)—not to mention the gargantuan total unfunded/underfunded liabilities that comprise guaranteed programs like Social Security, Medicare, employee pensions, and veterans’ benefits (as much as $50-100 trillion), plus over $6 trillion in state and local government debt of which over $2 trillion represents public pension and healthcare liabilities as well as state budget deficits that might eventually need federal bailouts. The states and cities in the worst shape are almost all “blue” due to their onerous tax and regulatory policies and massive nanny-state entitlement programs.
So, is it time to go all-in on these defensive plays? Are we due for another 2022-esque bear market? I think not. I think the core of an equity portfolio still should be US Big Tech stocks, given the entrepreneurial culture of US, disruptive innovation, and world-leading ROI that attract foreign capital, as well as Big Tech’s huge cash stores, wide moats, global scalability, resilient and durable earnings growth, free cash flow, margins. In fact, Bill Ackman’s Pershing Square just announced it increased its holdings in Meta Platforms (META) to $2 billion (10% of investment capital). However, the Big Tech hyperscalers (e.g., Microsoft, Alphabet, Amazon, and Meta) have always been considered “asset-light” with their focus on IP, software, and high ROI on minimal physical infrastructure, but their massive spending on datacenters essentially has transformed them into “asset-heavy,” capital-intensive.
According to the Financial Times, “A total of more than $660 billion is set to be ploughed into chips and data centres this year... The unprecedented infrastructure build-out will force Big Tech executives to choose between stemming capital returns to shareholders, raiding their cash reserves or tapping the bond and equity markets more than previously planned.” This has impacted investor psyches.
Nevertheless, there has been little deterioration in the fundamental story for the economy and stocks, and in fact the earnings projections for the S&P 500 in CY2026 are pushing upwards of 15% YoY, according to FactSet. Moreover, net margins are now at 10-year highs (and climbing)—and it extends beyond just the Tech sector. Cathie Wood of Ark Invest believes the US has suffered through a “rolling recession” (largely due to high interest rates) that have “evolved into a coiled spring that could bounce back powerfully during the next few years.” Indeed, capital flow already seems be returning to the AI infrastructure plays, including semiconductors, hyperscale cloud providers, and specialized networking, if not the software/SaaS firms, as I discuss in greater depth below.
Still, ever since the market low on 11/20, small and micro-cap indexes have greatly outperformed, as have the S&P 500 High Dividend (SPYD), S&P 500 Equal-Weight (RSP), and the Dow Transports (IYT). Value is doing well, too. So, this market broadening and mean reversion on valuations that is underway should also offer other (and likely better) opportunities among the AI infrastructure builders (datacenters and networking equipment) and power generators (beyond the giants and hyperscalers) from Industrials, Utilities, and Energy sectors, as well as small/mid-caps, value, quality, cyclicals, and equal-weight indexes. In addition, you might consider high-quality homebuilders, regional banks, insurers, energy services, transports, and healthcare/biotech/biopharma companies. Also, falling interest rates and rising liquidity suggest bond-proxy dividend stocks. Select small caps can offer the most explosive growth opportunities even if the small-cap indexes continue to lag the S&P 500. When borrowing costs decline and credit spreads tighten, small caps tend to respond earlier and more robustly than their larger brethren.
Historically, small caps tend to outperform during periods of rising economic growth, cooling inflation, and falling interest rates. Indeed, analysts are expecting a rebound in earnings for the Russell 2000 this year, beyond the healthy expectations for the S&P 500. Keep in mind, while the cap-weight large cap indexes are dominated by Technology, small cap indexes tend toward Industrials, Materials, and Financials (including regional banks), which should benefit from broad-based economic activity, infrastructure spending, and reshoring of supply chains. Moreover, a dovish Fed should support the earnings of the more interest rate-sensitive market segments (like small caps) as well as mortgage lenders, credit card issuers, high-quality regional banks, property & casualty insurers (who hold bonds as claim reserves), homebuilders and suppliers, home improvement firms, title insurance firms, REITs, and automakers/dealers.
But whether the broad indexes finish solidly positive this year may depend upon: 1) liquidity growth, 2) the relative strength of the dollar, 3) the steepness of the yield curve (could the 2-10 spread rise above 100 bps?), 4) the status and outlook on capex for AI and onshoring, and 5) the midterm elections and whether Republicans retain the House. According to economist and liquidity expert Michael Howell of CrossBorder Capital, this stage of the liquidity cycle (slowing liquidity growth) is correlated with falling bond term premia and flattening yield curve—which means Treasury notes and bonds may perform well later in the year. Indeed, given where we are with stability in real interest rates and inflation expectations, including the many disinflationary trends—like AI, automation, rising productivity, falling shelter and energy costs, peace deals, a firmer dollar, and the deflationary impulse from a struggling China—bonds seem ready to return to their historical role as a portfolio diversifier.
After the S&P 500’s terrific bull run over the past three years in which the MAG7 accounted for roughly 75% of the index’s total return, I think this year might see the equal-weight RSP and small cap indexes outperform the SPY, with the SPY gaining perhaps only single-digit percentage. This scenario also might favor strategic beta and active management. Regardless, stock market performance should be dependent upon strong ROI and earnings growth rather than significant multiple expansion. So, rather than the broad passive indexes (which are dominated by growth stocks, Big Tech, and the AI hyperscalers), I think 2026 should be a good year for active stock selection, small caps, and bond-alternative dividend payers—which bodes well for Sabrient’s Baker’s Dozen, Forward Looking Value, Small Cap Growth, and Dividend portfolios.
I go much further into all of this in my full post below, particularly regarding inflation and Fed policy. Overall, my recommendation to investors remains this: Focus on high-quality businesses at reasonable prices, hold inflation and dollar hedges like gold, silver, and bitcoin, and be prepared to exploit any market pullbacks by accumulating high-quality stocks as they rebound, with earnings fueled by massive capex in AI, blockchain, energy, and power infrastructure and factory onshoring, leading to rising productivity, increased productive capacity, and economic expansion. Regarding “high-quality businesses,” I mean fundamentally strong, displaying a history of consistent, reliable, resilient, durable, and accelerating sales and earnings growth, positive revisions to Wall Street analysts’ consensus estimates and a history of meeting/beating estimates, rising profit margins and free cash flow, high capital efficiency (e.g., ROI), solid earnings quality and conservative accounting practices, a strong balance sheet, low debt burden, competitive advantage, and a reasonable valuation compared to its peers and its own history.
These are the factors Sabrient employs in our quantitative models and portfolio selection process. As former engineers, we use the scientific method and hypothesis-testing to build models that make sense. We are best known for our Baker’s Dozen growth portfolio of 13 diverse picks, which is designed to offer the potential for outsized gains. It is packaged and distributed as a unit investment trust (UIT) by First Trust Portfolios—along with three other offshoot strategies for value, dividend, and small cap themes. In fact, the new Q1 2026 Baker’s Dozen portfolio recently launch on 1/20/2026. Also, as small caps and high-dividend payers benefit from falling interest rates and market rotation, the quarterly Sabrient Small Cap Growth and Sabrient Dividend (a growth & income strategy) might be timely investments. Notably, our Earnings Quality Rank (EQR) is a key factor in each of our strategies, and it is also licensed to the actively managed, low-beta First Trust Long-Short ETF (FTLS) as a quality prescreen.
Sabrient founder David Brown reveals the primary financial factors used in our models and his portfolio construction process in his latest book, Moon Rocks to Power Stocks—now an Amazon bestseller—written for investors of any experience level. David describes his path from NASA engineer in the Apollo Program to creating quantitative multifactor models for ranking stocks and building stock portfolios for four distinct investing styles—growth, value, dividend, or small cap.
Here is a link to this post in printable PDF format, where you can also find my latest Baker’s Dozen presentation slide deck. As always, I’d love to hear from you! Please feel free to email me your thoughts on this article or if you’d like me to speak on any of these topics at your event! Read on….
Market Commentary
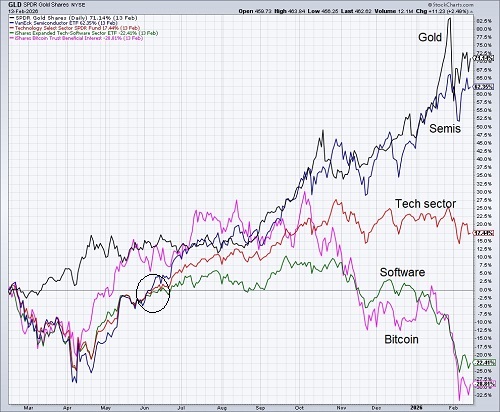
Defensive and neglected sectors in general have been outperforming so far this year in a notable mean reversion. In fact, it’s pretty incredible how hard the once-invincible software industry has sold off on fears of AI disruption. Interestingly, over the past year Bitcoin has traded in tandem with software stocks, as illustrated in the chart below. The Market Ear (from ZeroHedge) observed, “BTC still trades like software. And as software has fallen out of favor, BTC has moved in perfect tandem.” The chart also shows that semiconductors have traded quite robustly in tandem with gold, acting as something of a safe haven, while the broad Tech sector sits right down the middle. The extreme divergence between semis and software began last June, as indicated by the circle.
Nevertheless, given their large user bases and distribution, the top SaaS companies should ultimately benefit from AI and automation leading to greater efficiencies, higher productivity, and lower costs, which should both increase margins and allow for lower pricing to clients. According to The Jevons paradox, technological advancements increase resource efficiency, making the resource cheaper, which paradoxically increases overall consumption rather than reducing it—i.e., a bigger market outweighs lower pricing. Indeed, these software companies have seen their forward P/Es plunge in line with falling prices as analysts have been loath to reduce forward estimates, so there is a disconnect between investor sentiment and analyst sentiment. These companies include Salesforce (CRM), ServiceNow (NOW), SAP (SAP), and Adobe (ADBE).
Even mighty Microsoft (MSFT) has seen its market cap fall from roughly $4.0 trillion on 10/28/2025 to under $3.0 trillion today. Yes, it has lost over $1 trillion in market cap! That’s 25%. Microsoft. But somehow investors have not run for the hills from stocks; they have mainly rotated into other segments, at least partly due to concerns about if and when the massive capex in datacenters will provide commensurate ROI, as well as the crowding out of other uses for the cash, such as for dividends and share buybacks. Indeed, despite the uncertainties and elevated VIX, the Dow Jones Industrials Index managed to briefly eclipse the 50,000 mark for the first time ever. And Walmart (WMT) joined the $1 trillion market cap club. Investor confidence (if not consumer confidence) is high. Corporate bond credit spreads remain near historical lows. And now Alphabet (GOOGL) has issued “century bonds” (yes, maturing in 100 years!) that were actually fully subscribed—a rarity that hasn’t happened en masse since the market heyday of the 1990’s from the likes of Disney, Coca-Cola, Caterpillar, IBM, Motorola, Ford, Chrysler, and JC Penney.
The big selloff we saw at the end of January in gold, silver, bitcoin was mostly due to deleveraging. Toward the end of their runup, they began to drag along oil and other commodities [e.g., Invesco DB Commodity Index Tracking Fund (DBC)] to start the year, as well as the miners and energy producers as reflected by the broad Basic Materials sector [e.g., Materials Select Sector SPDR (XLB) and iShares US Basic Materials (IYM)] and the broad Energy sector [e.g., Energy Select Sector SPDR (XLE), SPDR Oil & Gas Exploration & Production (XOP), and iShares US Energy (IYE)].
Michael Howell of CrossBorder Capital observes, “Risk markets are sending a clear signal—it’s the end of easy money. After a spectacular three-year run, risk assets from Bitcoin to high-growth tech stocks are skidding. This isn’t a coincidence. It’s the direct result of a fundamental shift in the most powerful driver of financial markets: Global Liquidity… The US Federal Reserve, under presumptive Chair Kevin Warsh and egged on by Treasury Secretary Bessent, is now explicitly threatening to shrink its balance sheet—a process known as quantitative tightening (QT). This hawkish pivot, potentially guided by the philosophy of influential backers like star investor Stan Druckenmiller, marks a decisive turn from the era of endless support.” Howell suggests a rotation to “more defensive investments to protect wealth.” He also concedes that the global financial system structurally requires a level of liquidity that will limit how much the Fed’s balance sheet can be reduced (witness the repo market reaction late last year).
Indeed, the chart suggests that Kevin Warsh’s nomination correlates with previously surging gold and silver doing a sudden U-turn into a tailspin—although support seems to have arrived. Keep in mind, he has publicly stated that there is room for additional easing. As such the “de-dollarization trade”—including buying in gold, silver, non-US bonds, and alternative currencies—may continue for the near term, driven by rising debt, geopolitical tensions (including weaponization of the dollar), and investment diversification.
Longer term, however, rather than broad divestment of out of the US, I see the US dollar and Treasuries retaining their traditional role as a safe haven for global capital due to unparalleled size and liquidity, as well as our deep financial markets, rule of law, checks & balances, and strong defense of property rights, not to mention America’s entrepreneurial culture, vast human capital, disruptive innovation, and our corporate focus on shareholder value, global scalability, wide protective moats, and reliable and consistently strong earnings growth, free cash flow, margins, return ratios, and general resilience (i.e., our adaptive “can-do” spirit).
As famed French diplomat and historian Alexis de Tocqueville once said (circa 1850), “The greatness of America lies not in being more enlightened than any other nation, but rather in her ability to repair her faults.” Nevertheless, diversification will keep a bid under gold as a hard-money alternative to fiat currencies and sovereign debt (as deflationary trends, shrinking populations, and stagnant economies distress our major trading partners), and industrial demand for silver and copper should go parabolic with the rapid buildout AI datacenter and power generation facilities as well as adoption of electric vehicles, solar energy (PV cells), automation, and robotics, not to mention safe-haven buying due to global uncertainties.
Deregulation:
Much has been said about deregulation within the OBBBA and how perhaps as much as $2.1 trillion in federal regulatory costs hinder economic growth, according to the Competitive Enterprise Institute (CEI). According to Michael Gayed of the Lead-Lag Report, “When regulatory restrictions loosen, it allows companies to be more nimble, more financially flexible in the ways they can generate revenue & income and gives them the resources to grow the company and reward shareholders.” Here are some ways he sees deregulation might be implemented:
- Banks and financial institutions may see loosened rules on proprietary trading and lending, and capital requirements could be reduced, thus incentivizing more liquidity to be injected into the financial system.
- Energy companies may see relaxed oil & gas drilling and environmental compliance constraints.
- Healthcare companies may see reforms that reduce price caps or ease restrictions on new treatment approvals, and product development could be sped up to bring new pharmaceuticals and therapeutics to the market sooner.
- Telecom may see less regulation on net neutrality or infrastructure deployment.
Notably, the Trump Administration just announced what it calls “the single largest deregulatory action in U.S. history” by revoking the 2009 Greenhouse Gas Endangerment Finding, which gave the EPA broad power to institute strong anti-fossil fuel regulations, plus all subsequent federal emissions standards for vehicles. As a result of this action, the EPA generally cannot regulate greenhouse gases under the Clean Air Act. The administration expects this change to save US taxpayers $1.3 trillion, restore consumer choice, make vehicles more affordable, and help to decrease the cost of living—although lawsuits from certain states and environment groups are sure to come.
Jobs and inflation:
The BEA will release its first estimate of Q4 2025 real GDP on 2/20, but after +3.8% in Q2 2025 and +4.4% in Q3 2025, the Atlanta Fed GDPNow is forecasting a solid +3.7% for Q4 (although down from its +5.4% forecast in January). For full-year 2026, estimates are generally around +2.5%, but of course investors are hoping for even stronger growth via looser Fed policy, rising global liquidity, robust spending on AI, blockchain, and power infrastructure and strategic manufacturing, leading to rising productivity, increased productive capacity, and economic expansion. ISM Manufacturing for January hit 52.6, its fastest pace since 2022 and the first expansion reading (above 50) in 12 months, with new orders surging to 57.1 (and new orders-to-inventory ratio of 1.19, the highest since 2021) and order backlogs hitting 51.6 (the first expansion reading in 40 months). All good stuff.
The January jobs and inflation reports have begun to roll in, causing additional confusion regarding the impact on Fed policy. The BLS nonfarm payrolls gave an upside surprise with 130,000 new jobs and the official unemployment rate fell from 4.4% to 4.3% while the broader U6 unemployment rate fell from 8.4% to 8.0%. Importantly, real (after considering inflation) average hourly earnings growth increased by +1.2% (+3.7% nominal growth) YoY. Government hiring is falling while private sector jobs are rising. In fact, civilian employment, an alternative measure that includes small-business start-ups, increased 528,000.
Moreover, the BLS wrote, “From January 2025 to January 2026, real average hourly earnings increased 1.2%, seasonally adjusted. The change in real average hourly earnings combined with a 0.6% increase in the average workweek resulted in a 1.9% increase in real average weekly earnings over this period.” And it was even better for production and non-supervisory employees, for whom “real average hourly earnings increased 1.5%, seasonally adjusted. The change in real average hourly earnings combined with an increase of 0.6% in the average workweek resulted in a 2.2% increase….” In other words, workers have seen a modest increase in purchasing power.
As for inflation, CPI surprised lower at +2.4% YoY and Core CPI at +2.5%. The upper chart below compares the headline YoY inflation numbers. But I also like to look at the annualized 3-month rolling averages of PPI, CPI, Core CPI, and Core PCE (the Fed’s preferred metric) to get a better sense of the current trend. It shows that the gyrations seem mostly “back to normal” around the 2% line. The most recent of the metrics is January, which shows 3-month rolling annualized trend of +2.40% for CPI and +2.40% for Core CPI (following December readings of +2.07% for CPI and +1.60% for Core CPI), which reflects upward price resets early in each year that annualize at higher levels but then come back down during the year. It is evident that PPI tends to be more volatile month-to-month, but the amplitude seems to be settling down. Notably, the falling quarterly New Tenant Rent index is finally showing up in long-lagged CPI shelter cost (3-quarter lag), as I discussed in my January post. It only measures recently signed rental agreements, so it is a better indicator of the current trend in rental prices than the All Tenant Rents Index. So, CPI shelter, which accounts for 35% of CPI, should continue to trend lower and push down the broader CPI index.
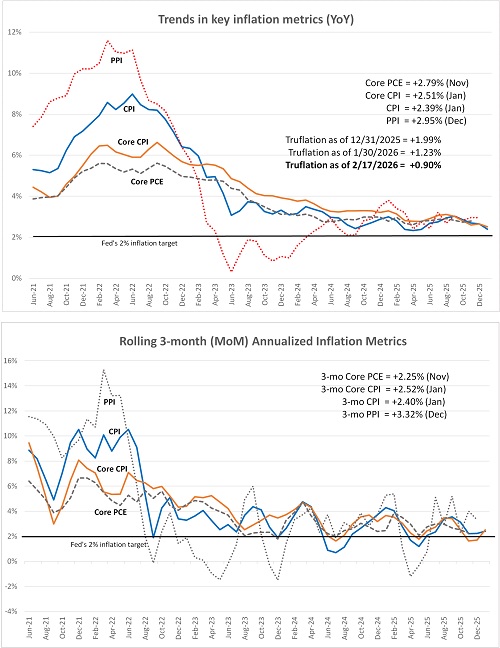
Furthermore, the Cleveland Fed’s Inflation Nowcasting model expects CPI, Core CPI, PCE, and Core PCE all to come within the range of +2.38-2.56% in February’s official BLS report. Another metric is the real-time, blockchain based "Truflation” metric, which is updated daily based on 30 million data points and tends to presage CPI by several months—and is much better at reflecting current housing costs than CPI or PCE. As the firm recently wrote, “Truflation's real-time US index is [falling fast] …driven by the Housing sector cooling faster than the BLS surveys can capture… The gap between the real price data from Truflation and household surveys from the BLS persists.” Indeed, as of 12/31/2025, it had fallen to +1.99% YoY (vs. % for CPI); as of 1/30/2026, it showed +1.23% (vs. % for CPI); and as of 2/17/26 it showed a scant +0.90%. Could that be where CPI is headed?
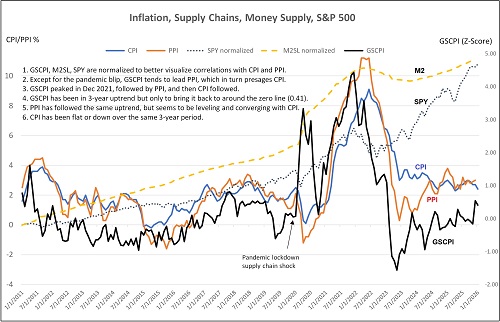
In addition, the New York Fed’s Global Supply Chain Pressure Index (GSCPI) is a Z-score (i.e., the number of standard deviations from the mean) that seems to be settling in around the zero line (i.e., its historical average). As shown in the chart below, GSCPI tends to presage PPI, which although more volatile, tends to presage CPI. So, low supply chain pressures suggest moderating PPI which suggests moderating CPI—and indeed CPI has been gradually receding over the past three years.
Given the strong correlation between bond yields and inflation, this suggests lower bond yields ahead. However, Peter Orszag, CEO of Lazard, and Adam Posen, president of the Peterson Institute for International Economics, recently opined, “Taken individually, lagged tariff pass‑through, tightening labor supply, looser fiscal policy, and accommodative financial conditions would each push inflation modestly higher. Taken together—and interacting with increasingly fragile household inflation expectations—they create a macro environment in which inflation rising above 4% by the end of 2026 is not only plausible but arguably the most likely scenario.” They added, “We believe these factors outweigh the downward‑pressure trends that consensus has been fixated on—namely, the ongoing decline in housing inflation and gains in productivity.”
Well, while their credentials are impressive (and a bit intimidating), I’m sticking to my guns with my falling-inflation thesis given the resumption of so many secular disinflationary trends, such as the buildout and implementation of Gen AI, automation, and robotics, rising productivity, falling shelter and energy costs, peace deals (war is inflationary, peace is the opposite), a deflation impulse on the world from China (due to its domestic struggles and falling consumer demand), low inflation in Europe (hitting the ECB’s 2% target), increased domestic productive capacity (i.e., “duplicative excess capacity,” in the words of Treasury Secretary Scott Bessent), and a strengthening dollar. The one fly in the ointment is the continued surge in industrial metals prices (which historically correlates with 5-year breakeven inflation, currently sitting at 2.42% as of 2/13). Still, I expect lower inflation ahead and a rate cut by June (perhaps even in March). Assuming fed funds rate cuts lead to lower rates across the yield curve, this would be quite bullish for the economy and stocks. As of 2/17, CME Group fed funds futures give 64% chance of a 25-bp cut by June and 77% chance of at least 50 bps by year end.
Because the jobs and inflation reports last week led to a greater market expectation of rate cuts, the dollar slightly weakened back to near its 52-week low, but also bond yields fell across the yield curve. The 10-2 Treasury spread collapsed by 10 bps from its high at the beginning of February down to 64 bps to close the week, with the 2-year Treasury yield closing the week at 3.41% and the 10-year yield closing below 4.05%. Also, the 30-year fell 22 bps to below 4.70%. Notably, the 30-year mortgage rate also fell to 6.09% as of 2/12, according to Freddie Mac. The 10-2 spread (and term premium) had been steadily rising since its deep -1.86-bp inversion in mid-2023 and is now back within its “normal” long-term range. As a reminder, a rising term premium even as the Fed is in a rate-cutting cycle reflects investor concerns about rising debt and deficits, as well as anger from the “bond vigilantes,” i.e., activist institutional investors and hedge funds who are protesting fiscal irresponsibility and don’t think the Fed should be cutting. So, last week’s fall in the term premium reflects greater confidence.
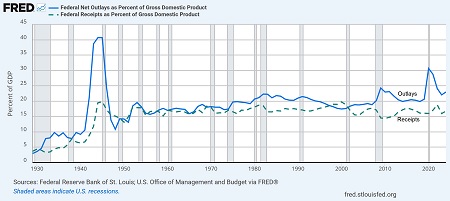
Below is a chart comparing federal outlays and federal receipts as percentages of GDP, which is published annually. The difference between the two numbers is the budget deficit to GDP ratio, which Treasury Secretary Scott Bessent aims to pare down to 3% of GDP. The 2024 reading was -6.2% (23.0% in outlays vs. 16.8% in receipts, as shown). The 2025 number is not yet officially out, but it is estimated to still be well north of 6%. If we can grow the budget more slowly than the GDP growth rate, and tax receipts grow at the same rate as GDP (indeed tax receipts historically tend to come in around 17% of GDP no matter the tax regime), perhaps we can eventually shrink the gap between the two lines to Bessent’s 3% target—and maybe someday return to the 1998-2001 period of balanced budgets (shown in the chart). One can dream.
Fed policy and the dollar:
The dollar tends to get stronger in foreign exchange markets when: 1) US economic growth outpaces other developed markets, 2) the Fed tightens policy by pausing rate cuts, or 3) geopolitical concerns driven global investors into the safety of the US dollar and Treasuries. Sectors that benefit are those that have relatively limited forex risk, like domestically focused small caps and value stocks (like industrials and energy services companies) rather than large multinationals. Also, the major goods importers (like retailers and distributors) have increased purchasing power, which lowers their import costs and improves margins.
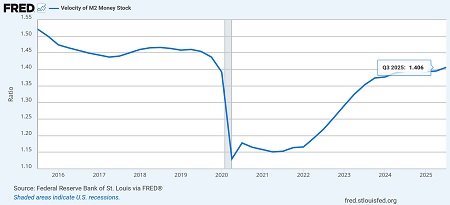
A stable/firmer dollar slows global liquidity growth, which inhibits global economic growth. But this has been partially offset by rising velocity of money (transactions per dollar in circulation), which in the US is at its highest level since Q4 2019, as shown in the chart below from the St. Louis Fed. Also, the US has benefited from foreign capital flight, the majority of which does not show up in our M2 money supply thus creating “shadow liquidity” that has helped inflate our capital markets—albeit at the expense of the rest of world (ROW). As inflation eases and central banks cut interest rates, the US and India (the world’s fastest growing major economy) continue to drive global economic activity while Europe and China (among others) struggle to reinvigorate growth.
Also, the Fed is the steward of the M2 money supply. Through monetary policy tools like interest rates and bank reserve requirements, the Fed influences bank deposits, which comprise about 90% of M2. If the Fed grows the M2 money supply in line with the GDP growth rate, based on the economy’s true productive capacity, it can maintain price stability. If the Fed creates too much liquidity growth in excess of GDP growth, consumer demand grows faster than supply, which is inflationary. For example, 1) the Fed has “printed money” beyond the real economic growth rate for “direct monetization” to fund fiscal stimulus (like the federal “helicopter money” distributed during the pandemic), or 2) the Fed has “monetized the debt” onto its balance sheet by implementing QE, i.e., buying bonds from commercial banks who then have more cash to lend, which distorts pricing and encourages excessive leverage and risk-taking. However, if the Fed keeps liquidity too tight, it constrains GDP growth and consumer demand, which is disinflationary/deflationary. Although the velocity of money (which is mainly market driven) can help adjust for slight imbalances in Fed policy, aligning money supply growth with economic growth leads to price stability and efficient capital allocation.
And then we have the other important policy from the Fed which is today’s abundant reserves vs. the previous scarce reserves policy. Simply put, before 2008, the Federal Reserve used scarce reserves to manage monetary policy, influencing interest rates through small changes in reserve supply. Banks were not incentivized to hold reserves. After the financial crisis, the Fed adopted an abundant-reserves system, setting rates administratively using tools like interest rate on reserve balances (IORB) and overnight reverse repurchase agreements (ON RRP), which create target interest rates to incentive more (looser) or less (tighter) outside lending. This shift brought greater stability and less market volatility but increased the Fed’s presence in money markets and blurred the lines between monetary and fiscal policy while also making the financial system more dependent on the Fed and thus more vulnerable to policy risks.
While on balance, we should prefer a strong-dollar policy, sometimes a weaker dollar can be strategically desirable. And of course, it is not completely dependent upon Fed monetary policy. Fiscal policy (and government profligacy) can have a big impact as well. But with regard to monetary policy, the FOMC is tasked with independently seeking a balance between today’s stagnant jobs market and sticky inflation. “Affordability” has become the political term du jour, and to help address affordability, the president recently announced his intentions to:
- Direct Fannie Mae (FNMA) and Freddie Mac (FHLMC) to purchase $200 billion in mortgage-backed securities to remove fixed income supply from the market and drive down longer-term rates (in another form of yield curve control).
- Restrict private equity firms from buying single family homes (typically all-cash buyers, which crowds out individuals who need to carry mortgages) thus reducing demand and stabilizing price increases.
- Place a 10% cap for one year on the interest rate credit card companies can charge (this will be a tough one to implement).
Regardless, home affordability has been improving, with 30-year mortgage rates trending lower and now sitting at 6.09% (as of 2/12)—rates haven’t been below this level in a sustained way since September 2022.
Also, the Fed is implementing a program called Reserve Management Purchases (RMP) for temporary liquidity injections that expand the balance sheet without the intention of monetary stimulus, which skeptics like Michael Howell call “Not-QE, QE.” The Fed says it differs from QE because it involves buying short-term bills rather than longer-term bonds. Nevertheless, the US Treasury can create a similar impact when it boosts issuance of short-term bills and reduces issuance of longer-term notes and bonds, thus reducing supply (and thus interest rates) on the longer end, which by extension reduces mortgage rates. The combined impact is more de facto yield curve control (YCC).
I have spoken in the past about YCC and manipulation by the Treasury by having virtually all new issuances in short-dated T-bills, which kept supply low on the long end, thus driving down bond yields and creating a maturity mismatch. Going forward, though, short-term supply will need to be more limited to drive down rates (through open market operations), and the yield curve should steepen further—although I expect it will be driven by lower short-term rates and a slight rise in term premium (reflective of investor concerns about high debt and deficits and perhaps some “bond vigilantes,” i.e., investors who don’t think the Fed should be cutting).
Essentially, Fed monetary policy is about adjusting the cost of capital, i.e., the cost to borrow, the incentive to save, and the relative attractiveness among competing assets. When rates rise, money becomes more expensive, liquidity tightens, safe assets become more appealing, and risk assets get repriced lower (from a discounted cash flow standpoint, a higher discount rate reduces present value). But when rates fall, money becomes cheaper, liquidity expands, and investors are pushed further out on the yield curve (higher risk) in search of higher returns. In addition, a lower fed funds rate reduces volatility across the financial system, including banks, credit markets, and bond markets, which makes banks more confident to lend (rather than park money in interest-paying Fed reserves) and gives investors the confidence to increase duration. This is why stocks rally, credit spreads tighten, and speculative assets catch a strong bid. In other words, big moves in capital markets can occur following small moves in the bond market—like a “butterfly effect.”
So, would a Kevin Warsh chairmanship mean the end of the “Fed put”? Renowned investor and former CEO of Duquesne Capital Stanley Druckenmiller, who worked with and mentored Warsh, opined, "The branding of Kevin as someone who's always hawkish is not correct. I've seen him go both ways. I could not think of a single other individual on the planet better equipped." And in the view of Real Investment Advice, “A Warsh-led Fed would likely emphasize a smaller balance sheet, clearer exit rules for emergency facilities, and formulaic policy decisions based on real economic outcomes rather than financial-market reflexivity…. Rather than responding to every bout of market stress with interest rate cuts, QE, or new lending facilities, a Kevin Warsh Fed would likely tolerate more volatility as the cost of restoring credibility.... Assuming this analysis proves true, investors would lose a dependable tailwind, and valuation—not liquidity narratives—would regain its role as the primary driver of long-term returns. Accordingly, active investment strategies may once again prove more rewarding than passive strategies [underline added].”
I have been advocating for less low-ROI government spending (and politburo-style decisions) and more unleashing of the free market and private sector to be the primary engine of economic growth. Thankfully, the new Fed chair nominee Kevin Warsh seems to believe in shrinking the Fed balance sheet, which, as I have opined myself many times, has served to widen the wealth gap by backstopping high-leverage risk-taking and advantaging big banks and those with the most access to the cheap capital (Wall Street) over small banks, small businesses, and average Americans (Main Street). In 2011, Warsh wrote: “The path to prosperity requires taking the long road. It requires policy reforms that make the economy less reliant on the preferences of government and more responsive to the market. That means prioritizing long-term growth over fleeting market stability… temporary stimulus and market manipulation.” He also believes that AI will ignite both a productivity boom and disinflation, leading to lower interest rates, stronger growth in real GDP and real wages, and a lower debt-to-GDP ratio.
Look no further than China for an example of how excessive reliance on government reduces ROI. Famed futurist and economist George Gilder recently wrote, “China’s national return on capital has declined materially since Chairman Xi has been in power. Under Xi, investment has been redirected toward state-owned and state-favored enterprises with persistently lower returns. In the industrial sector, private firms earned returns on assets of roughly 9-11% in the 2000s, compared with about 4-6% for state-owned firms (SOEs); by the mid-late 2010s, those figures had fallen to roughly 7-8% and 3-4%, respectively. Yet capital investment continued to shift toward the state’s pets…. Under Xi, China has required 50-100% more investment to generate a unit of growth than it did a decade earlier.”
Impressively, the latest report (Q3 2025) on US productivity growth showed acceleration at a +4.9% annualized rate, the fastest in two years (following +4.1% in Q2 2025, +2.3% in full-year 2024, and +2.7% in 2023), reflecting a potential long-term trend driven by AI adoption, increased business dynamism, and improved efficiency. Also, output per hour is rising faster than total hours worked. Notably, according to the National Association of Manufacturers, every $1 spent creates a total impact of $2.65 to the US economy, and every new factory worker leads to 4.8 workers added to the economy. That’s the kind of high ROI the private sector brings (compared to low-ROI government spending on entitlements and boondoggles).
Famed economist Ed Yardeni likes to say, “Productivity is like fairy dust. It makes everything better. When its growth increases, that boosts real GDP’s growth rate, moderates inflation, allows real hourly compensation to rise faster, and lifts profit margins.” And deregulation and incentives for oil & gas development have contained oil prices, further constraining inflationary pressures. Rising supply from the OPEC+ group of nations and hopes for progress in the Russia-Ukraine war, Iran conflict, and Venezuela’s oil infrastructure rehab have pushed oil prices lower, reinforcing the broader disinflation narrative. And yet, electricity prices continue to rise. This is not simply due to rising demand from AI, much of which will be fulfilled by collocated/dedicated power sources. Rather it will be due to the disproportionate reliance on wind, solar, and battery storage capex, which is unreliable and non-dispatchable compared to fossil fuels and nuclear.
You can read more about our energy situation in my special report titled, “The Future of Energy, the Lifeblood of an Economy,” including Sabrient’s top stock picks in various energy-related industries, by visiting https://www.MoonRocksToPowerStocks.com.
Final comments:
Eric Peters, CEO of One River Asset Management and Coinbase Asset Management, wrote another compelling thought piece recently. In part, he opined, “Biden launched the Infrastructure Investment and Jobs Act in 2021. The Inflation Reduction Act and CHIPS Act in 2022. They together catalyzed $1 trillion in private investment. Under Trump, the US has taken equity stakes in Lithium Americas, MP Materials, Vulcan Elements, Intel, Westinghouse, US Steel, and entered profit sharing agreements with Nvidia and AMD. It has announced Project Vault, a strategic mineral stockpile, along with energy deregulation, manufacturing subsidies, tax breaks. And you can be sure that Fed/Treasury will be coordinating to unlock lower cost and more abundant capital. It’s only just starting…. ‘You can mark my words. In 36 months…the most economically compelling place to put AI will be space. It will then get ridiculously better to be in space,’ said Elon Musk. Solar panels generate about 5x more power in space than on Earth (due to no atmospheric loss or night), making it ‘actually much cheaper to do in space’ for massive AI workloads, despite current challenges like launch costs (he expects Starship to solve rapidly). SpaceX’s FCC filing for a million-satellite constellation of solar-powered orbital data centers and the merger of SpaceX/xAI, positioned it as a scaling solution beyond Earth’s grid constraints.”
It’s just mind-boggling stuff. While some politicians are trying to slow down the AI train—or stop it altogether—the better bet is to find asymmetric investments (having more upside than downside) to get onboard the train.
In closing, as rates fall and the market broadens, we might see continued rotation into value stocks, small-mid caps, cyclicals, dividend payers, bonds, and industrial metals (like copper, aluminum, cobalt, lithium, platinum, palladium), as well as equal-weight indexes, strategic beta ETFs, and active selection. On that note, Sabrient’s process-driven, growth-at-a-reasonable-price active-selection methodology is revealed by Sabrient founder David Brown in his new book, Moon Rocks to Power Stocks: Proven Stock Picking Method Revealed by NASA Scientist Turned Portfolio Manager.
It is also available in both paperback and eBook formats on Amazon for investors of all experience levels (an Amazon bestseller!). It teaches how to methodically and strategically build wealth in the stock market. David describes his path from NASA engineer in the Apollo Program to creating quant models for ranking stocks and building portfolios in four distinct investing styles—growth, value, dividend, and small cap. To learn more about David's book as well as the companion subscription product (Sabrient Scorecards) that does most of the stock evaluation work for you, visit: https://www.moonrockstopowerstocks.com
Latest Sector Rankings
Relative sector rankings are based on Sabrient’s proprietary SectorCast model, which builds a composite profile of each of roughly 1,500 equity ETFs based on bottom-up aggregate scoring of the constituent stocks. The Outlook Score is a Growth at a Reasonable Price (GARP) model that employs a forward-looking, fundamentals-based multifactor algorithm considering forward valuation, historical and projected earnings growth, the dynamics of Wall Street analysts’ consensus earnings estimates and recent revisions (up or down), quality and sustainability of reported earnings, and various return ratios. It helps us predict relative performance over the next 3-6 months.
In addition, SectorCast computes a Bull Score and Bear Score for each ETF based on recent price behavior of the constituent stocks on particularly strong and weak market days. A high Bull score indicates that stocks held by the ETF recently have tended toward relative outperformance when the market is strong, while a high Bear score indicates that stocks within the ETF have tended to hold up relatively well (i.e., safe havens) when the market is weak. Outlook score is forward-looking while Bull and Bear are backward-looking.
As a group, these three scores can be helpful for positioning a portfolio for a given set of anticipated market conditions. Of course, each ETF holds a unique portfolio of stocks and position weights, so the sectors represented will score differently depending upon which set of ETFs is used. We use the iShares that represent the ten major U.S. business sectors: Financials (IYF), Technology (IYW), Industrials (IYJ), Healthcare (IYH), Consumer Staples (IYK), Consumer Discretionary (IYC), Energy (IYE), Basic Materials (IYM), Telecommunications (IYZ), and Utilities (IDU). Whereas the Select Sector SPDRs only contain stocks from the S&P 500 large cap index, I prefer the iShares for their larger universe and broader diversity.
The table below shows the latest fundamentals-based Outlook rankings and our full sector rotation model:
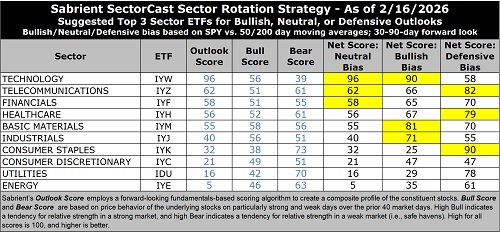
The latest rankings display a neutral bias, in my view, given that cyclicals, secular growth sectors, and defensive sectors are mixed across the rankings.
Technology (dominated by the mega-cap Big Tech titans and AI-driven highflyers) remains at the top with a robust Outlook score of 96, reflecting the high quality of those juggernauts despite having the highest forward P/E at 25.5x. However, this multiple is down substantially from the 31x it hit several months ago while other sectors’ valuations have risen, reflecting the mean reversion and rotation we are seeing in the market. Remarkably, with a rising consensus next-12-months (NTM) EPS growth estimate hitting 23.6%, the forward PEG (ratio of P/E to EPS growth) is now the lowest at just 1.08.
Keep in mind, investors tend to be quite willing to “pay up” for strong growth, so this relative value opportunity might not last long. Tech also displays solidly positive sell-side analyst earnings revisions, by far the highest profit margins and return ratios, and the best insider sentiment (open market buying). Because many Tech stocks are riding secular growth trends (i.e., little cyclicality), no other sector comes close to the consistent sales growth, margins, operating leverage, and return on capital. And Tech not only benefits from its own product development and productivity gains, but those products help other companies with their product development, product delivery, and productivity—so Tech benefits by helping all sectors grow and prosper.
Rounding out the top 7 are Telecom, Financials, Healthcare, Basic Materials, and Industrials. At the bottom of the rankings are Energy and defensive sector Utilities. Utilities has been a solid performer this year, even though the sector is typically considered to be a defensive “bond-proxy” dividend play, but that has driven up its valuation, with a forward P/E of 19.8x for only modest projected EPS growth over the next 12 months (8.8%) and so a high forward PEG of 2.24—but its growth projections should start to rise with the datacenter buildout and associated ramp-up in power demand. Although US electricity consumption has been increasing only gradually over the past few years, ICF International forecasts a 25% increase by 2030 and 78% by 2050, driven largely by AI-related initiatives. Also, Energy has been benefiting from the market rotation (driving up its forward P/E to 20.1x) as investors are attracted to the shareholder-friendly policies and payouts—as well as getting ahead of the projected surge in energy demand, much like Utilities.
Keep in mind, the Outlook Rank does not include timing, momentum, or relative strength factors, but rather reflects the consensus fundamental expectations at a given point in time for individual stocks, aggregated by sector.
Sector Rotation Model and ETF Trading Ideas
Our rules-based Sector Rotation model, which appropriately weights Outlook, Bull, and Bear scores in accordance with the overall market’s prevailing trend (bullish, neutral, or defensive), just switched to a neutral bias last week after the S&P 500 fell solidly below its 50-day moving average and remained there as of Friday (as confirmation). (Note: In this model, we consider the bias to be bullish from a rules-based trend-following standpoint when SPY is above both its 50-day and 200-day simple moving averages, but neutral if it is between those SMAs while searching for direction, and defensive if below both SMAs.)
As highlighted in the table above, the Sector Rotation model suggests holding Technology (IYW), Telecom (IYZ), and Financials (IYF), in that order. However, if you prefer a bullish stance, it suggests holding Technology, Basic Materials (IYM), and Industrials (IYJ). Or, if you prefer to take a defensive stance, it suggests holding Consumer Staples (IYK), Telecom, and Healthcare (IYH), with Utilities (IDU) close behind.
Here is an assortment of other interesting ETFs that are scoring well in our latest rankings: iShares MSCI Global Silver and Metals Miners (SLVP), WisdomTree Efficient Gold Plus Gold Miners Strategy (GDMN), iShares MSCI Global Gold Miners (RING), VanEck Junior Gold Miners (GDXJ), Technology Trusector (TRUT), US Global GO Gold and Precious Metal Miners (GOAU), Global X PureCap MSCI InfoTech (GXPT), iShares Global Tech (IXN), Castellan Targeted Equity (CTEF), SP Funds S&P Global Technology (SPTE), First Trust Nasdaq ABA Community Bank (QABA), Abacus FCF Innovation Leaders (ABOT), Crossmark Large Cap Growth ((CLCG), Invesco Dorsey Wright Technology Momentum (PTF), Amplify Junior Silver Miners (SILJ), iShares Future AI & Tech (ARTY), Innovator IBD 50 (FFTY), First Trust Indxx Critical Metals (FMTL), NYLI US Large Cap R&D Leaders (LRND), State Street SPDR S&P Pharmaceuticals (XPH), ARS Focused Opportunities Strategy (AFOS), Janus Henderson Global Artificial Intelligence (JHAI), AXS Esoterica NextG Economy (WUGI), and First Trust Small Cap BuyWrite Income (FTKI). All score in the top decile (90-100) of Sabrient’s Outlook scores.
As always, I welcome your thoughts on this article! Please email me anytime. Any and all feedback is appreciated. Also, please let me know of your interest in any of Sabrient’s new indexes for ETF investing, such as High-Quality Growth (similar to our Baker’s Dozen model), High-Quality Growth & Income, SMID-Cap Quality Plus Momentum, High-Quality Energy, Quality Legacy & Green Energy, Defensive Equity, Space Exploration & Off-Earth Sustainability, and the Sabrient Select High-Conviction Portfolio (actively managed).
IMPORTANT NOTE: I post this information periodically as a free look inside some of our institutional research and as a source of some trading ideas for your own further investigation. It is not intended to be traded directly as a rules-based strategy in a real money portfolio. I am simply showing what a sector rotation model might suggest if a given portfolio was due for a rebalance, and I do not update the information on a regular schedule or on technical triggers. There are many ways for a client to trade such a strategy, including monthly or quarterly rebalancing, perhaps with interim adjustments to the bullish/neutral/defensive bias when warranted, but not necessarily on the days that I happen to post this article. The enhanced strategy seeks higher returns by employing individual stocks (or stock options) that are also highly ranked, but this introduces greater risks and volatility. I do not track performance of the ideas mentioned here as a managed portfolio.
Disclosure: At the time of this writing, of the securities mentioned, the author held positions in SPY, FTLS, GOAU, XOP, gold, silver, copper, palladium, bitcoin.
Disclaimer: Opinions expressed are the author’s alone and do not necessarily reflect the views of Sabrient. This newsletter is published solely for informational purposes only. It is neither a solicitation to buy nor an offer to sell securities. It is not intended as investment advice and should not be used as the basis for any investment decision. Individuals should consider their personal financial circumstances in acting on any opinions, commentary, rankings, or stock selections provided by Sabrient Systems. Sabrient makes no representation that the techniques used in its rankings or analyses will result in profits. Trading involves risk, including possible loss of principal and other losses, and past performance is no guarantee of future results. Investment returns will fluctuate, and principal value may either rise or fall. Sabrient disclaims liability for damages of any sort (including lost profits) arising from the use of or inability to use its rankings or analyses. Information contained herein reflects our judgment or interpretation at the time of publication and is subject to change without notice.
Copyright © 2026 Sabrient Systems, LLC. All rights reserved.