Sector Detector: Inflation and interest rates at a crossroads as the Fed’s Warsh era begins

by Scott Martindale
CEO, Sabrient Systems LLC
Quick note: Sabrient’s new Small Cap Growth 52 Portfolio just launched on 6/17 as a 15-month portfolio holding 43 stocks across a range of sectors. It offers an alpha-seeking alternative to the broad small-cap indexes. Notably SCG 46 is the next to terminate on 7/22, and it currently shows a gross total return of +81% vs. +48% for its benchmark S&P SmallCap 600 Growth (SLYG), as well as 61% for Russell 2000 Small Caps (IWM), and +43% for S&P 500 (SPY), as of 6/22.
Overview
The resilient bull market continues to be powered by a compelling combination of technological innovation, robust corporate earnings, resilient consumer spending (despite energy and supply-driven inflationary pressures), and investor optimism around productivity-driven economic growth, despite ongoing macro uncertainties (there’s always something). Notably, the April rally off the market correction was broad-based, then May saw a marked narrowing with Tech the clear leader while most other sectors struggling (as bond yields surged, which hurts interest-rate sensitive industries), and now June has the market resuming its broadening efforts, as evidenced by price action (including a new high for the Russell 2000 small caps) and a convergence in forward P/E multiples (e.g., cap-weight S&P 500 falling, equal-weight S&P 500 and Russell 2000 small caps rising).
In my full commentary below, I discuss:
1. Relative valuations and the SpaceX-led parade of mega-IPOs on tap
2. GDP, inflation, jobs, and productivity
3. Fed policy in the new Kevin Warsh chairmanship
4. AI backlash, the realities, and how to address it
5. Datacenter power demand and the NIMBY problem
6. My final comments section on government versus private sector capital allocation and ROI
7. Sabrient’s sector rankings, positioning of our sector rotation model, and some top-ranked ETF ideas
As I discussed in my May post, valuations in the broad market indexes have been falling even as the market has surged, as earnings surged at an even faster rate. The equal-weight indexes have outperformed their cap-weight brethren, most notably in the Tech sector, with the MAG-7 badly underperforming the aggregate of everyone else in the sector. Who are the new leaders? Those benefiting from all the hyperscalers’ capex, including names like Sandisk (SNDK), Western Digital (WDC), Seagate Technology (STX), Micron (MU), Broadcom (AVGO), Dell (DELL), Vertiv (VRT), Quanta Services (PWR), EMCOR (EME), Arista Networks (ANET), Bloom Energy (BE), Comfort Systems (FIX), and Sterling Infrastructure (STRL)—many of which have been holdings in Sabrient’s quarterly Baker’s Dozen portfolios.
With the splashy IPO debut of Elon Musk’s SpaceX (SPCX), there are now 12 companies in the $1 trillion market cap club as of 6/19 [including lone non-Tech name Berkshire Hathaway (BRK-B]. And given the rest of the mega-IPO lineup expected this year, some commentators are suggesting a new Big Tech-leadership acronym, such as “MANGOS”—Meta, Anthropic, NVIDIA, Google, OpenAI, and SpaceX. Or the “AI Big 10” that adds Micron, AMD, and Broadcom to the existing MAG-7.
Many of the main headwinds of H1 seem to be finding resolution. The Iran conflict is apparently winding down, and oil price has tumbled from around $105/bbl at its May peak to below $75/bbl (front-month futures contract for WTI on NYMEX), which soon will be reflected in inflation metrics. Consumer spending and retail sales have held up despite falling real wage growth, and now the extremely poor consumer and investor sentiment metrics are showing nascent signs of improvement—although still far from the euphoria or “irrational exuberance” of the dot-com era. Also, the huge SpaceX IPO hit the market without any notable damage.
Overall, I still think fundamental tailwinds outweigh headwinds as investors position for continued AI progress, robust capex for AI, reshoring, and re-industrialization, looser Fed monetary policy, resurgence in global liquidity growth, and One Big Beautifull Bill Act (OBBBA) policies fully kicking in with its pro-growth policies like tax reform, deregulation, smaller government, pro-energy protocols, and broad support for the private sector to retake its rightful place as the primary engine of growth via re-privatization, reshoring, and re-industrialization, with much more efficient capital allocation and ROI than government.
Furthermore, this should continue to attract foreign capital into the US (“shadow liquidity,” much of which is not counted in M2), cut the debt and deficit-to-GDP ratio, and unleash organic private sector growth. Today’s valuations are reasonable, particularly given rising corporate earnings forecasts (now at +23% YoY for CY2026), but future stock valuations likely will be driven more by rising earnings and ROI than by AI hope-driven multiple expansion, particularly given the lingering macro uncertainties and the risk of higher interest rates.
In addition, aside from the oil and supply-driven disruptions that have temporarily goosed inflation metrics, many disinflationary trends are still in place, including the secular implementation of AI and automation, rising productivity, falling shelter costs, the deflationary impulse from a struggling China, a stable/rising dollar (up nearly 5% YTD), and slow M2 growth (about 4.7% vs. last year and 3.5% annualized over the past 3 years, vs. 6.0% pre-pandemic average since 1960). So, as supply chains are repaired and rerouted (as I discussed in my April post) and as oil prices and inflation recede, we could see some multiple expansion—to perhaps as high as 24x on the S&P 500 (after the recent contraction to below 22x on a next-12-months basis)—which would further support stocks. Indeed, the market seems to be setting up the next up leg. Every dip has been a buying opportunity. According to InvesTech Research, “Margin Debt as a percentage of nominal GDP shot up 9% in May, reaching a new all-time high.”
Q1 earnings reporting season was stellar, with robust YoY earnings growth, margins, and productivity, plus rising forward guidance and analyst earnings forecasts. Blended EPS growth across sectors was up 28% in Q1, led by Tech sector at 54%. Revenue growth was 11%, led by Tech at 16%. Profit margins were 15%, led by Tech at 29%. But because EPS growth has exceeded price performance, the P/E multiple has shrunk. The S&P 500 started the year at 6,845 and closed last week at 7,500. The latest Wall Street consensus for S&P 500 operating EPS is about $339 for 2026 (implied P/E of 22.1x based on $7,500 price) and $392 for 2027 (forward P/E of 19.1x on current price). Both are roughly 10% higher than at the start of the year. An official resolution to the Iran conflict and supply shock could allow for some multiple expansion, perhaps pushing the forward P/E to 24x—which implies the S&P 500 Index hitting 8,000 by year-end 2026 and potentially 9,300 by year-end 2027. Are these realistic targets? Not out of the question, in my view, although bouts of volatility along the way surely should be expected—perhaps severe pullbacks as price stretches from moving averages (like a rubberband).
As the S&P 500’s concentration in Big Tech has grown, its dividend yield has compressed to below 1.0%—reminiscent of the late-1990s and well below its multi-decade average around 1.7%—mainly because those high-growth Big Tech companies that dominate the cap-weight index don’t need to pay dividends to attract investors. Instead, investors are willing to pay up for strong growth and high margins, increasingly discounting a world in which AI becomes deeply embedded in business operations in a long-term secular investment cycle rather than short-term cyclical trend. And this is in spite of the elevated benchmark 10-year Treasury yield around 4.5%, which normally would suppress valuation multiples (on a discounted cash flow basis). Although Big Tech is largely immune to interest rate volatility, the smaller companies—into which the market is seeking to broaden—are not.
Furthermore, many uncertainties remain. Investors are concerned about the worrisome inflation prints, Fed policy under the new chairmanship, and the concise-but-vague MOU with Iran. Moreover, the long stretch of years in which demand for US stocks has far outstripped supply (“scarcity”) seems to be suddenly reversing. The line-up of mega-IPOs this year, pre-IPO shares coming out of lock-up, and Big Tech’s shift from using its massive cash flow for share buybacks to supplementing cash with new share issuances to instead fund historic levels of AI-related capex for datacenters, advanced compute hardware (chips, memory, servers), networking, and power infrastructure. According to Michael Gayed, the four largest hyperscalers (Meta, Alphabet, Microsoft, Amazon) spent $416 billion on capex in 2025 and have projected 2026 capex of $725 billion.
Concurrently, there is concern about Big Tech earnings quality and circular financing (e.g., NVIDIA investing in its customers who in turn buy NVIDIA’s GPUs), not to mention speculation on how soon all this massive AI spend will pay off (i.e., ROI) and what happens if and when the capex firehose dials down or shuts off. However, as the engraving in every convex passenger-side car mirror reminds us, “Objects in the mirror may be closer than they appear,” which certainly seems to be the case with AI as fundamentals are evolving much faster and impacting workflows much sooner than most anyone expected.
As for the Fed’s increasingly hawkish stance and rising odds of a rate hike (like the ECB just instituted), my view is that a hike won’t reduce the oil or food prices that are driving up the inflation metrics unless it induces an economic recession, which is not what the Fed or anyone wants to see. Assuming the Iran conflict is indeed coming to an end, inflation and interest rates likely have topped, with disinflationary structural trends resuming control and bonds catching a bid.
I remain of the belief that interest rate-sensitive segments of the economy, including housing, homebuyers, small businesses, and lower-income consumers, are already struggling with current financing and mortgage rates, offset only by the locked-in low interest rates from 2020-21, in a K-shaped economy, with higher income people doing well and spending, while lower income is being squeezed. For instance, higher income households have not reduced their driving habits at all, while most others have, and teenagers are having a hard time finding summer jobs due to all the older workers who have re-entered the workplace to supplement their retirement income. Moreover, the still-solid GDP growth metrics have been overly reliant on the combination of the AI race and its massive infrastructure spending, financed mostly on Big Tech cash flow than debt, plus unsustainable levels of fiscal deficit spending—i.e., around $1.9 trillion or 5.8% federal deficit-to-GDP, which includes $1 trillion in interest payments on 100% publicly held federal debt-to-GDP (and 123% total debt-to-GDP).
Notably, if you look solely at the primary deficit (excluding interest on debt), the ratio to GDP is 2.6% (20.1% spending minus 17.5% total revenue), which exceeds the 50-year historical average of 1.7% primary deficit-to-GDP ratio. If any of this spending slows, recessionary conditions might follow. In other words, we need all segments of the economy to flourish, and that can be supported by lower rates. And by the way, elevated inflation helps “inflate away” the debt as long as growth in real (after-inflation) GDP is positive (preferably strongly positive, like 2.5% or more) and exceeds growth in deficit spending, and interest rates remain contained (including any financial repression or yield curve control).
Having a hyper-financialized global economy means that rising rates could cripple debt-addicted businesses, governments (including our own federal government), and the housing market (which is critical for a healthy consumer). Sure, mortgage rates have been much higher in the past, but home prices today are based on a lower baseline of post-GFC easing and low rates. And given recent strengthening of the dollar, some emerging market economies with dollar-denominated debt may be forced into default. In other words, today’s global financial system simply can’t handle higher US interest rates.
Given the market broadening beyond the Big Tech titans, and assuming the Fed does not become overly hawkish, we continue to see opportunities in active stock selection, small caps, and bond-alternative dividend payers. Indeed, Sabrient’s Baker’s Dozen, Forward Looking Value, Small Cap Growth, and Dividend portfolios have been largely outperforming their benchmarks. Our latest Q2 2026 Baker’s Dozen Portfolio launched on 4/17 as a 15-month portfolio with a mid-cap bias and a diverse group of 13 stocks across eight business sectors. After two months, it is already off to a good start, up +9.5% vs. +5.1% for SPY and +3.6% for equal-weight S&P 500 (RSP), as of 6/22. Notably, last year’s Q1 2025 Baker’s Dozen terminated on 4/20 with a gross total return of +46.7% vs. +20.3% for SPY, and the next-to-terminate Q2 2025 portfolio is up +61% vs. +43% for SPY and +32% for RSP. And, as a reminder, our Earnings Quality Rank (EQR) is licensed to the actively managed, low-beta First Trust Long-Short ETF (FTLS) as a quality prescreen. FTLS now has $2.4 billion in AUM.
Sabrient employs a variety of fundamental financial factors in our quantitative models and portfolio selection process. Sabrient Scorecards for Stocks and ETFs are investor tools that provide access to several of our proprietary models for idea generation and portfolio monitoring. To learn more, I invite you to visit https://MoonRocksToPowerStocks.com where you can download founder David Brown’s latest book (an Amazon international bestseller) and 2 bonus reports (on investing in the Future of Energy and Space Exploration)—all in PDF format—and start subscribing to the Scorecards, which make David’s process easy for idea generation and portfolio monitoring. They include our Top 30 stocks each week for 4 distinct investing strategies—Growth, Value, Dividend, and Small Cap. To go straight to the Scorecard subscription, go to: https://www.moonrockstopowerstocks.com/sabrient-scorecard
Here is a link to the post in printable PDF format. As always, I’d love to hear from you! Please feel free to email me your thoughts on this article or if you’d like me to speak on any of these topics at your event! Click here to continue reading my full commentary....
Market Commentary
Today’s economy is defined by crosscurrents, such as secular technological disruption and rising productivity versus fears of job losses and falling real wages, as well as rising asset prices versus declining affordability. The May jobs reports put to bed growing worries about the “jobpocalypse,” as private payrolls and civilian employment surged while prior months were revised up and revisions to March-April put the 3-month average at 188,000 new jobs, which is the highest since Q1 2024. And yet stocks sold off. President Trump showed his frustration on Truth Social, “With a great Jobs Report…stocks should go up, not down. That’s the way it was for 200 years. Growth does not mean inflation! How else can a country attain GREATNESS???”
Of course, it happened because the concern now among traders is that the strengthening jobs market coupled with rising inflationary pressures may give the Fed license for a rate hike. But I say to the Fed, not so fast. Although the broad economy has proven quite resilient in the face of today’s elevated yield curve, many segments of the economy are struggling to hang on.
Historically, periods of low unemployment and positive market returns have supported consumer optimism. Today, however, many households perceive the economy entirely differently given the combination of: 1) elevated living costs (however “transitory” they may be due to the Iran conflict and associated supply chain constraints), 2) growing reliance on debt, higher interest rates and tighter lending standards, 3) slowing real (inflation-adjusted) income growth, and 4) concerns about technology displacing jobs. This has created a sense of uncertainty and instability that traditional economic indicators don’t fully capture.
Individuals are not simply reacting to inflation; they are reacting to uncertainty around their future earning power. And many small businesses, homebuilders, hopeful first-time homebuyers and lower-income/working-class families continue to struggle under the weight of elevated interest rates. So, although many FOMC members are pushing for (and fed funds futures and betting markets are expecting) at least one rate hike this year, I continue to believe the Fed would be better advised to cut its policy rate, ultimately to 3.0%, which would allow a broader swath of the economy to participate and contribute to a more robust and broad-based economy, most notably housing, refinancing, consumer credit, and business borrowing, not to mention provide relief to borrowers in emerging markets suffering under a rising dollar.
Nevertheless, a backdrop of stable policy rates, soon-to-moderate inflation, and continued real GDP growth creates a positive environment for equities and other risk assets, even under new Fed chair Kevin Warsh, who has been vocal about shrinking the Fed’s balance sheet (i.e., allowing bond holdings to mature such that the US Treasury must pay them off and refinance in the public market). The key is that liquidity, term premium, and real‑time inflation all matter as much as the headline policy rate.
AI capex is surging. And unlike the dot-com era, earnings (not just revenues) continue to accelerate. NVIDIA (NVDA) has been the poster child for the AI trade and Big Tech leadership. But today, with well above $5 trillion in market cap, its days of meteoric share price surges are likely behind it. So, who will be the new investor darling? Perhaps Micron Technology (MU) fits the bill due to its leadership in high-bandwidth memory—the specialized DRAM required to fuel AI accelerators. Micron has joined 11 other high-flying companies in the trillion-dollar market cap club, rising from the 127th largest stock by market cap a year ago to the 11th largest today.
In fact, The Market Ear opined, “NVDA increasingly looks like the funder of the latest semiconductor squeeze. The stock has struggled even as large parts of the semiconductor complex continue to rip higher.” In other words, investors may be lightening up on NVDA shares to buy MU. A recent article in Barron’s suggested market leadership today has become a semiconductor “Fab-5” comprising Micron, Broadcom, Advanced Micro Devices (AMD), and Taiwan Semiconductor (TSM) in addition to juggernaut NVIDIA.
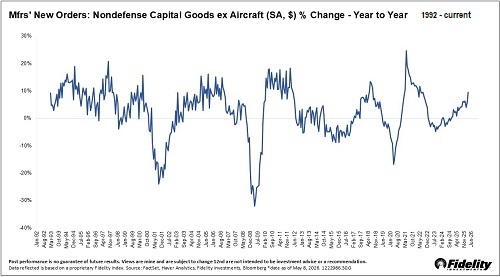
With the OBBBA kicking into gear this year, we are starting to see the rest of the Russell 3000 companies (beyond Big Tech) ramping up capex and seeing productivity and margin gains. So, these are the early innings and a potential signal of market broadening. The Russell 2000 SmallCap Index (IWM) hit a new all-time high on 6/22. According to Denise Chisholm of Fidelity, economists often focus on “core” durable goods orders, stripping out volatile defense and aircraft orders, but when manufacturers are stepping up orders for long‑lived equipment, she see it as one of the cleanest real‑time signals of a capital spending rebound, as illustrated in her chart below, which helps a broader swath of companies. Recent YoY growth in capital spending is in the top quintile of its historical range, she says, and rather than pressuring profits or slowing hiring, such capital spending historically has been associated with more hiring and more durable earnings growth.
Again, as I discussed in my May post, valuations have been falling broadly even as the market has surged, as earnings surged at an even faster rate. Compared to the dot-com era, capex is being funded mostly by cash flow rather than capital markets (issuing stock and bonds to raise cash). But as a result, Big Tech firms are no longer considered asset-light and so are being priced a little bit more in line with asset-heavy companies. Moreover, I expect to see the equal-weight S&P 500 aggregate margins and earnings continue their nascent recovery in an effort to catch up (somewhat) with the impressive cap-weight aggregate earnings.
And yet 2/3 (66%) of consumers are cutting back on overall spending due to rising gasoline prices and other inflationary impacts on their budgets, according to The Conference Board Consumer Confidence Survey, which would be expected to put downward pressure on prices and corporate profit margins—i.e., disinflation. I have spoken often in the past about hyper-financialization driving asset inflation, even while consumer price inflation was modest. But we have a K-shaped economy. In a healthy, balanced economy, wage growth outpaces consumer prices, allowing increased savings and spending. Instead, our economy has been relying on Big Tech spending, growth in global liquidity from central bank policies that fund rising deficit spending, leading to rising national debt and carrying costs.
The US economy now “requires significantly less energy per unit of GDP than in earlier decades, reflecting efficiency gains and a shift away from manufacturing toward services. As a result, oil price spikes are less inflationary and less disruptive to real economic activity than in the past when energy intensity was much higher. Today, total energy (e.g., gasoline, fuel oil, electricity, utility gas, petrochemicals, shipping/transport) accounts for about 10% of PPI, 7.5% of CPI, and 5% of PCE.
But according to economist and liquidity guru Michael Howell of CrossBorder Capital, “…underlying monetary conditions are tightening. Central banks may not yet be raising policy rates, but that is not the whole story. In the US, a strong economy is drawing liquidity out of financial markets faster than the authorities are putting it back, so the liquidity measures we track are deteriorating. In China, meanwhile, the People’s Bank (PBoC) appears to have turned off the money tap. This Hong Kong headline captures the shift: ‘China’s PBOC shuts liquidity tap for first time in 2 years, nudging idle cash into economy.’”
Secular growth exposure continues to command new investment given the strength of earnings revisions and capital spending trends tied to AI infrastructure buildout and accelerating adoption. And quantum computing stocks just got a big boost from the federal government’s announced strategic investments (national security-critical), and the White House is exploring other direct equity stakes in many other new technologies. Moreover, institutional investors continue to hold substantial capital on the sidelines, and moments of increased volatility have repeatedly been treated as buying opportunities—which reflects both confidence in the broad economic fundamentals and a lack of compelling investment alternatives risk capital and long-term capital appreciation. Even Berkshire Hathaway (BRK-B) with its post-Buffett leadership led by CEO Greg Abel is finally investing in Tech, starting with Alphabet (GOOGL) to help fund its massive AI compute infrastructure.
And yet, the Shiller Cyclically Adjusted Price Earnings (CAPE) ratio recently topped 41 (more than double its long-term average and near its dot-com high of 44), and Warren Buffett’s preferred valuation measure (total market cap-to-GDP ratio) has hit extreme historical highs (near 230%). However, keep in mind that the CAPE doesn’t account for the radical change from staid, asset-heavy, low-margin industrial conglomerates to hyper-growth, asset-light, high-margin Big Tech dominance, and the Buffett Indicator doesn’t consider earnings growth, valuation multiples, profit margins, ROI, or liquidity growth, which are the primary drivers of share prices.
Goldman Sachs has identified two recurring dynamics that tend to characterize the unwinding phase of high-valuation, highly concentrated bull markets: 1) a meaningful rise in speculative risk-taking that distorts market expectations and creates asymmetrical downside risk, and 2) a deterioration in the underlying economic and corporate fundamentals that have traditionally supported equity valuations, including tighter monetary policy, slowing earnings growth, and weakening consumer demand. However, Goldman Sachs does not believe either condition has fully materialized today and suggests that while investor optimism is strong, broader signs of euphoria (or “irrational exuberance”) remain somewhat contained, particularly given the robust earnings growth and rising guidance.
SpaceX leads parade of mega-IPOs:
SpaceX’s arrival in the public market saw it quickly leap 20% out of the gate to eclipse a $2 trillion valuation (and kept rising another 20% the second day, with the Iran peace deal announcement), putting it at #6 on the market cap list just behind Amazon (AMZN) and making Elon Musk the world’s first trillionaire—with a net worth roughly equal to bitcoin’s total market cap ($1.3 trillion), or of the combined net worth of the next five richest people (Larry Page, Sergey Brin, Jeff Bezos, Larry Ellison, and Michael Dell). There are now 12 companies (as of 6/19) in the $1 trillion market-cap club.
SPCX investors own three core business segments: 1) Space (launch and spaceflight services), 2) Connectivity (the Starlink satellite internet network), and Artificial Intelligence (which includes xAI, compute infrastructure, and social media platforms like X). Notably, Elon himself was convinced the startup would fail early on. Indeed, there were 15 rockets and major prototypes that either exploded or were destroyed during launch or landing (3 orbital rocket failures, 7 explosive Starship test flights, and 5 ground test explosions). Of course, critics mocked the repeated setbacks—but each one was critical in generating needed lessons and information on the weak links.
Keep in mind, the market impact of SPCX is not its full market capitalization but its publicly traded free-float market cap, which at a reported 4% range is closer to just $100 billion. But its impact on equity supply and its weight in market indexes will grow as lock-up periods end, early investors cash out, and free float rises. And beyond SPCX, there is a lot more equity supply for the market to absorb this year, including additional mega-IPOs OpenAI, Anthropic, and Stripe, as well as issuances of new shares to raise capital (rather than taking on pricey debt) from the hyperscalers Alphabet (GOOGL), Meta (META), Microsoft (MSFT), and Amazon—all of which might pressure other stocks as liquidity sources, particularly other Big Tech names, and the many smaller companies as passive index-tracking funds are compelled to purchase shares of these massive new entrants.
This could have a profound reversal of what has been the market’s status quo of increasing scarcity, as Bloomberg recently put it. We have long seen M&A and LBOs taking out publicly traded companies faster than the launch of new IPOs, leading to a shrinking number of stocks, and we grew accustomed to the ultra-cash-generating Big Tech giants using a lot of that cash to buy back shares, further reducing supply. But suddenly we not only have these record-setting new IPOs lined up to dump massive supply of new shares onto the market along with new issuances of equity from the hyperscalers for capex, but also the hyperscalers are using their cash flow for capex rather than buybacks, further reducing demand.
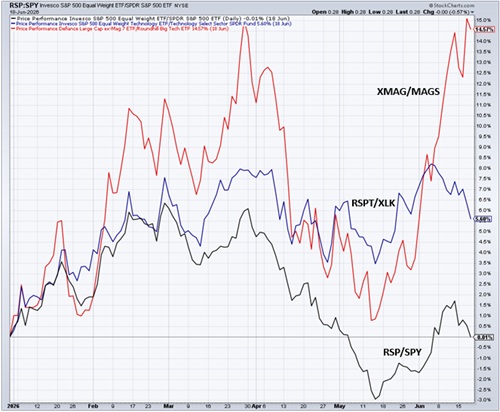
Equity markets remain near record highs, but leadership has been narrow—although starting to broaden. A small group of AI, semiconductor, and hyperscale-computing names have been driving returns, while many consumer-facing bellwethers lag. Investor sentiment increasingly depends on AI-driven productivity gains offsetting broader macro pressures. But it is starting to change. As shown in the YTD chart below, the Large Cap ex-MAG-7 (XMAG) has been greatly outperforming MAG-7 (MAGS), Equal-Weight Technology (RSPT) has outperformed Tech Select SPDR (XLK), and equal-weight RSP has performed in line with cap-weight SPY.
While stocks have done well, the bond market has endured selling and rising yields, suggesting a less optimistic outlook. Long-term Treasury yields have risen back to pre-GFC levels, and expectations for Fed easing have faded mostly due to three key drivers: 1) higher energy prices tied to geopolitical tension, 2) persistent fiscal deficits that pressure Treasury supply (and bring out the “bond vigilantes”), and 3) resilient economic data that reinforces the higher-for-longer rate outlook. Hopes for quick rate cuts to relieve pressure on housing, refinancing, consumer credit, and business borrowing have largely disappeared.
Some economists question whether lower interest rates have a net benefit to the private sector as is widely assumed, because as the federal government pays out higher interest rates, more money flows to those holding the debt, i.e., the private sector (including pension funds and retirees), which means more disposable income. On the other hand, the net detriment to indebted middle/working class and lower-income consumers, small businesses, and interest-rate sensitive market segments—like the housing market (mortgage rates)—is more clear-cut. As the slowest home-sale market in decades is stretching into a fourth straight year, CNBC just reported that home sellers delisted properties in April at the highest rate since 2022, with 5.8% of all home listings nationwide pulled from the market (led by 10% in Atlanta). Again, we are witnessing a K-shaped economy, with higher income people doing well and continuing to spend, while lower incomes are being squeezed.
GDP, inflation, jobs, and productivity:
BEA’s second estimate of Q1 2026 real GDP came in at +1.6% YoY, which is down from the advance estimate of +2.0%, due to downward revisions to investment and consumer spending. A big driver for the modest reading was imports growth being roughly double exports, thus reducing headline GDP by 1.3 pps (i.e., GDP would have been +2.9% if exports-minus-imports were balanced). Moreover, First Trust pointed out that “Core GDP”—i.e., consumer spending, business fixed investment, and residential construction, excluding volatile components like inventories, government spending, and trade (exports-minus-imports)—was +2.4%.
Corporate profits rose +0.9% QoQ in Q1 and are up +12% YoY. After posting huge losses for three consecutive years, the Fed finally returned to profitability in Q4 and posted another small profit in Q1, which was the fastest growth for any 4-quarter stretch since 2023. According to First Trust, “…the increase in Q1 was entirely due to profits from domestic non-financial industries, which rose 3.7%. Profits from domestic financial companies declined 0.3%, while profits from the rest of the world fell 9.8%.”
Notably, industrial production continues its uptrend and was up modestly in May, driven by mining and oil & gas drilling, high-tech equipment, and reshoring of semiconductor production. High-tech manufacturing is up +12.6% YoY (and an annualized +19.8% over the past 6 months). Overall capacity utilization was 76.2%.
However, at the same time, real gross domestic income (GDI) increased +0.9% YoY, which might be concerning. Theoretically, Gross Domestic Product (GDP) and Gross Domestic Income (GDI) should be identical, as GDP measures activity from the spending side while GDI measures it from the income side. But in practice, they often diverge due to timing and measurement differences, which is only meaningful if the divergence persists. GDI historically has been the more reliable signal near turning points. For example, in past cycles, income growth and corporate profits have weakened before spending rolled over. GDP would continue to show growth, often supported by inventories, government spending, or credit, before eventually “catching down” to match GDI. That’s why a gap in which GDP looks solid but GDI looks weak has typically been a warning sign. Nonetheless, it is somewhat comforting to see that Core GDP is holding up—in other words, headline GDP has not been overly reliant upon the volatile components of inventories and government.
Regarding overreliance on government spending, to paraphrase Ludwig von Mises and Friedrich Hayek, prominent historical figures of the Austrian School of Economics, if you agree to give up your liberty in exchange for the promise of prosperity, history shows that you end with neither liberty nor prosperity. Vast entitlements (aka the welfare state) remove the incentive structure for striving and achieving, and “equality” means everyone’s standard of living is brought down to the lowest common denominator. Totalitarian central planning and the welfare state destroy both freedom and the free-market mechanisms required to generate wealth, ultimately resulting in widespread poverty and state coercion. For now, we are successfully resisting the siren song of socialism, although it is growing louder and more popular in some quarters.
The Atlanta Federal Reserve Bank’s GDP Now Model is now projecting Q2 growth at a 3.0% rate, and some commentators are predicting as much as 6% real GDP growth in Q3. The BEA’s first estimate for Q2 will be released on 6/25. Of course, much of recent economic growth is being led by massive capital spending on AI and datacenters, so a case can be made that economic growth is not sufficiently broad. But at least the limited boom in AI and datacenters is coming primarily from market forces rather than government-directed malinvestment (like the “green energy” initiatives of recent years. More resources being allocated by politicians rather than market forces always slows growth. The massive pandemic “helicopter money” stimulus has been largely spent and is not firmly behind us. Deficits have been relatively stable, and the money supply has slowed dramatically. If the economy were to fall into recession, it would be because of this liquidity drain—and perhaps Fed tightening of monetary policy.
Let me update what I discussed in my May post regarding the latest inflation readings juxtaposed with supply chain metrics. The New York Fed’s Global Supply Chain Pressure Index (GSCPI) tends to lead PPI, which in turn tends to lead CPI. May GSCPI at 1.77 (z-score, or number of standard deviations from the mean) is down only slightly from April’s 1.82 reading, but it seems to have peaked. And now that the Strait of Hormuz is (apparently) fully open, energy prices and supply chain disruptions should recede, alleviating these event-driven inflationary drivers, so that GSCPI can recede back toward the zero line—and pull PPI (and CPI) back down with it. Already, oil is has fallen from around $105/bbl to below $75/bbl (NYMEX WTI futures), and again, total energy (e.g., gasoline, fuel oil, electricity, utility gas, petrochemicals, shipping/transport) accounts for about 10% of PPI, 7.5% of CPI, and 5% of PCE. It is estimated that each $10/bbl increase in crude oil adds about 0.2% to headline CPI.
The BLS reported May PPI rose to +6.42% YoY, the highest in over 4 years, while Core PPI (x-food & energy) was up +4.9%, which is down from April’s +5.3%. Meanwhile, May CPI came in at +4.17% YoY, while Core CPI (x-food & energy) was +2.82%. Housing rents continue to be the main driver of core inflation, although recent data is hinting that rent increases might be slowing down. The relative trends are shown in the chart below of YoY metrics for PPI, CPI, Core CPI, Core PCE, and Trimmed Mean PCE (Fed chair Warsh’s preferred metric).
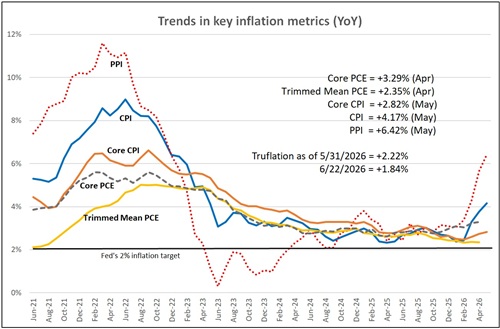
The trends in headline PPI and CPI would be frightening if they were indicative of a structural problem in the global economy—but of course, the Iran-induced supply shocks on energy and food prices are event-driven rather than structural. Notably, alternative metrics like Core CPI (+2.82% in May), Trimmed Mean PCE (+2.35% in April, its latest reading), and Truflation (+2.22% at end of May), which attempt to capture the true underlying price pressures, each paint a much more sanguine picture of underlying inflation. [Note: Trimmed Mean PCE strips out the outlier sub-metrics to filter the most extreme price swings (that can distort the total) to offer a more stable and relevant perspective. And the real-time, blockchain-based Truflation metric is updated daily based on 30 million data points and tends to presage CPI by several months.]
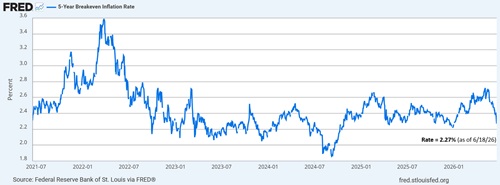
In addition, the 5-year breakeven inflation rate has fallen to 2.27% as of 6/18, as shown in the chart below. It reflects the implied forward expectations of investors in 5-Year Treasury Constant Maturity Securities and 5-Year Treasury Inflation-Indexed Constant Maturity Securities.
As for the FOMC’s summary of economic projections (aka “dot plot”), it now reflects an expectation of PCE and core PCE ending 2026 at around 3.6% and 3.3%, respectively. Looking ahead to the June inflation metrics, the Cleveland Fed Inflation Nowcast model predicts CPI of +4.01%, Core CPI of +2.85%, PCE of +3.82%, and Core PCE of +3.30%, as of 6/22.
Productivity was up 2.8% YoY in Q1, while hourly compensation increased 3.3%, which implies unit labor cost inflation was just 0.5% YoY. Then, the May CPI report showed that real (inflation-adjusted) hourly earnings declined -0.1% MoM and are down -0.7% YoY. So, the economy has continued to grow while employment and wage growth have slowed—greatly impacted by essentially zero et immigration and government employment have fallen off a cliff (as promised by the Trump Administration).
According to economist Ed Yardeni, the post-pandemic economy rebounded strongly, with GDP growth back to its 3.1% historical average in Q4 2023, a pace he expects will continue through the end of the decade, supported by strong productivity growth. In his longstanding “Roaring 2020s” scenario, productivity growth accelerates in the second half of this decade in the range of 3.5-4.5%, supporting real GDP growth and containing inflation—at least partly by keeping unit labor costs (ULC) and hourly compensation under control. Today’s labor-market tightness gives businesses a stronger incentive to invest in AI, automation, and other technologies that make workers more productive, and Yardeni believes these tools can affordably and profitably enhance both physical and cognitive productivity across a wider range of businesses.
In fact, Yardeni refers to data as the “fourth factor of production,” in addition to the historically recognized three factors of land, labor, and capital. However, while land, labor, and capital are relatively scarce, the supply of data is unlimited. He says, “The Digital Revolution, which began in the 1960s, is all about processing as much information as possible, as quickly as possible and as cheaply as possible. Today's AI technologies can certainly do all that much better than IBM mainframes back in the mid-1960s.”
According to Denise Chisholm of Fidelity, historical data shows that the highest correlated cost component to corporate margins is unit labor cost, and the proportion of unit labor costs to total corporate expenses remains in the bottom quartile of history. However, in my view, if such stunning productivity gains only lifts corporate margins and doesn’t trickle down to wage earners (so that they share the spoils with capital owners), the wealth gap—and societal unrest—will continue to grow.
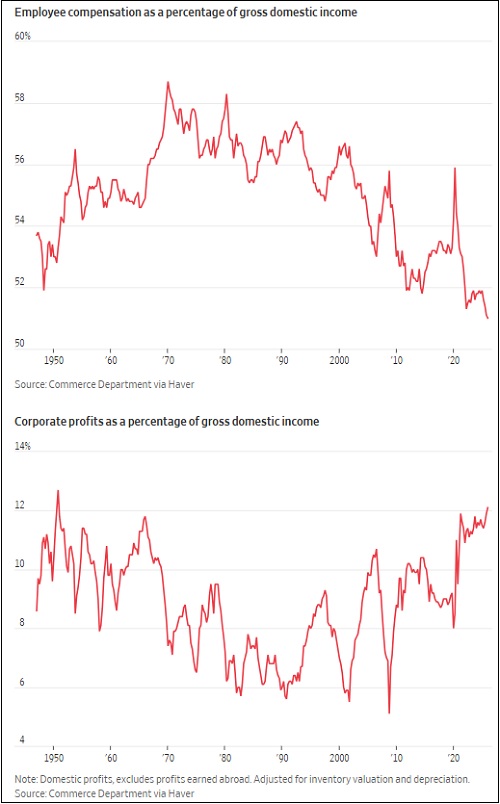
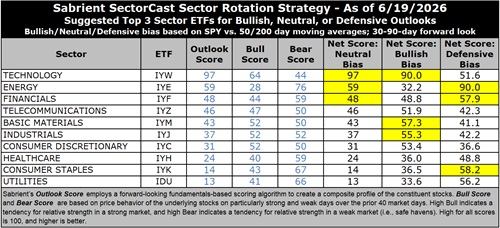
Indeed, Greg Ip explained in a recent WSJ article and the charts below, “Worker compensation—wages and benefits—grew 0.8% in the first quarter from the fourth, while domestic corporate profits jumped 2.7%. As a result, labor’s share of gross domestic income…sank to 51%, the lowest since records began in 1947. Profits’ share climbed to 12.1%, the highest since 1950. It’s the latest milestone in a trend that became pronounced in the 2000s, then picked up speed after the pandemic. Adjusted for inflation, hourly wages are up 3% since the end of 2019 while profits are up 50%. That, in a nutshell, explains the chasm between an ebullient stock market and anxious public…. But the trend predates the AI boom. The causes are complex and the implications sobering. You can be a red-blooded capitalist and still worry about the political stability of an economy in which ever more output flows toward shareholders instead of employees. A backlash is already brewing [such as the California ‘billionaire tax’ initiative on the November ballot].”
Fed policy in the new Warsh regime:
I have been quite clear in my view of the overriding weight of the many powerful, secular, disinflationary trends vs. short-term, event-driven, or one-time price spikes. Those trends include aging demographics, slowing global population growth, accelerating disruptive innovation like AI and automation, rising productivity, falling shelter and energy costs, global peace (as hostile nations are quickly pacified/disarmed), modest liquidity growth, a strong/stable dollar, and the deflationary impulse on the world from a struggling China. And although there might be some inflationary impacts of reshoring of manufacturing and diversification of supply chains in the short term, it is also adding redundancy and additional domestic industrial capacity, i.e., “duplicative excess capacity,” in the words of Treasury Secretary Scott Bessent (for national security purposes), which is ultimately disinflationary.
In addition, we can expect relief/recovery in supply chain shocks and energy prices, softer demand growth, and base effects (i.e., YoY comparisons to the recent high levels), each of which point to disinflation over the next 1-2 years, with many forecasters predicting inflation metrics converging toward the Fed’s 2% target sometime in 2027.
So, although the standard or kneejerk reaction to today’s worrisome inflation metrics is to raise the fed funds rate, it would disproportionately hurt small business, the housing market, and lower-income and working-class people. As previously discussed, there is no real wage growth or “demand pull” driving today’s inflationary pressures, like we saw during the pandemic era of Keynesian fiscal stimulus via “helicopter money.”
According to Michael Underhill of Capital Innovations, “Higher rates raise the cost of capital, slow discretionary spending, compress margins, and pressure equity valuations. Markets run on liquidity—and a Fed leaning harder into inflation-fighting mode becomes a structural headwind for risk assets. Markets are still working out what comes next… Markets don’t yet know how [Warsh will] balance the trade-off between growth durability and inflation discipline, and that ambiguity alone tightens financial conditions.” I agree. And I will reiterate that the struggling areas of the US economy and emerging markets need a fed funds rate of 3.0%.
New Fed chair Kevin Warsh has consistently signaled a preference for both lower policy rates and a smaller Fed balance sheet. Achieving both would be hard in the near term, given our large fiscal deficits Treasury issuance to finance new spending and refinance maturing debt. But he is positioning himself as a reformer. For starters, he has dispensed with forward guidance on rate policy that he has long opposed but that has gradually expanded since the Greenspan era. As First Trust’s econ team put it, “Warsh doesn’t like the intense form of ‘forward guidance’ that’s evolved at the Fed, where it treats the markets and the economy like some sort of young child that is always on the verge of a tantrum and needs to be placated, as if every shift must be communicated well ahead of time, and the Fed needs to ask for permission.”
As a result, investors will have to focus more on interpreting actual economic data rather than interpreting the Fed’s messaging. According to Wil Stith of Wilmington Trust, “[Warsh] wants financial markets to help policymakers understand what investors are seeing without shaping those views through constant signaling… The objective is to obtain a cleaner read on risk, economic weakness, and inflation pressures rather than having market pricing heavily influenced by what the Fed has already communicated.”
Warsh also has launched five special task forces to reform how the central bank operates and address the shortcomings in achieving its mandates. A panel of economists and subject-matter experts for each task force will start with “first principles" and deliver actionable recommendations by year-end. The five task forces and their distinct mandates include:
1. Public Communications: Reevaluating how the Fed communicates policy to financial markets, including overhauling traditional mechanisms like the quarterly Summary of Economic Projections (SEP).
2. Balance Sheet: Assessing the optimal composition and size of the balance sheet, and addressing concerns about the Fed's extensive bond holdings and the resulting distortion of market signals.
3. Data Sources: Scrutinizing how the Fed sources and uses economic data, with focus on current statistical methods using lagging data and which fails to accurately reflect the modern US economy.
4. Productivity and Jobs: Analyzing the shifting labor landscape, particularly the impacts of AI and other transformative technologies on employment and productivity.
5. Inflation Management: Reassessing the frameworks used to manage inflation, while reaffirming the Fed's commitment to achieving its 2% target.
AI backlash:
Politically speaking, particularly heading into the midterms, public pushback is growing regarding two key issues that impact average Americans: 1) job losses (you’ve seen the layoff announcements, with recent college grads seeing rising unemployment), and 2) strain on the power grid (for massive datacenters) leading to rising electricity costs and utility capex for expansion (i.e., costs that must be recouped from customers). This threatens continued hyperscale capex growth.
Markets view AI as a transformative productivity engine capable of driving extraordinary corporate profitability, worker productivity, and long-term economic growth. Simultaneously, many workers increasingly view this technology as a direct threat to their employment stability, compensation growth, and professional relevance. The challenge is not merely understanding AI as an investment theme; it is understanding AI as a macroeconomic force with implications for labor markets, consumption patterns, political sentiment, and long-term capital allocation. The same innovation driving stock market euphoria is also contributing to broader societal anxiety—particularly among middle- and upper-middle-income knowledge workers who historically have formed the backbone of resilient consumer demand. At graduation speeches, many young people boo when AI is mentioned.
With community sentiment against AI real and worsening, a populist backlash and anti-AI legislation can’t be far behind—which would leave China a clear path to AI dominance and control, much like their stranglehold on other critical national security areas, like manufacturing and rare earth elements mining and processing. This has become the biggest risk to the powerful AI trade, much the same as every previous disruptive technology wave, from railroads to the Internet, when the public feared the impact on their families and livelihoods. Nevertheless, the fundamental story seems too strong, the benefits too entrancing, the capital commitments too large, and the competitive dynamics (including national security interests) too urgent to derail this train.
Economist Ed Yardeni recently wrote, “We disagree with the widely held notion that AI is a net job killer. In our opinion, AI will create jobs on balance. Humans will use AI to achieve greater output at lower cost, creating a wealthier society that needs more and newer types of human labor. We agree with Jevons' Paradox: Making a production input more efficient lowers the cost of the final product, stimulates demand for it, and ultimately results in greater demand for the input itself, despite the productivity gain.”
Famed futurist George Gilder recently wrote, “As productivity rises, possibilities multiply and people demand more—and better: housing, health care, entertainment, education, travel, food…. Wealth increases with productivity; as wealth increases, new forms of demand emerge…. After averaging roughly 1% to 1.5% annually for much of the past two decades, U.S. productivity growth recently accelerated to 2.7%. That’s enough to make economists talk about a possible productivity boom, readily translated into better products, lower prices, shorter workweeks, and entirely new industries…. Going back as far as we have data, productivity gains have repeatedly been converted into some combination of higher wages, lower prices, new industries, better products, and more leisure…. The purpose of technology is not to create [or eliminate] jobs. It is to create abundance.”
And abundance means that the proverbial “economic pie” grows, living standards rise, leisure time expands, new industries emerge, and new jobs are created. In a nutshell, AI will be a tool to enhance worker productivity and grow the economic pie, not do away with workers or replace them with robots.
Entrepreneur David Friedberg of the All-In Podcast crew sees this growing negative sentiment as a real concern. He recently laid out three drivers for it, which he believes must be addressed:
“First, I think that there's like an underlying view that: a) Technology creates leverage for a small group of people, which creates power imbalances, and nothing represents that more than AI. b) A small number of people that control, profit from, and benefit from AI are going to end up getting outsized returns relative to the broader population… c) The [rapid] time to diffusion here is such that it's going to be extremely asymmetric for society... For example, nuclear bombs really created this moment in people's minds in the mid-20th century that, by the back half of the 20th century, gave everyone a high degree of skepticism about technology and science generally: that those who have the knowledge and those who engineer solutions with the knowledge can create outsized advantages for themselves, and it puts the rest of us at risk—the rest of the world, the rest of the population—at risk. And because those questions about ‘when does this benefit me, how does it benefit me’ can't be answered today, the economic benefit that's accruing to the few today becomes the narrative…that a few people take from the many. And so, there's something deeply disturbing for the average person about that. They don't understand how it works, why it works, what it'll do for them, when it will do it, and all that they're being told is that some people are making trillions of dollars. So, I think it's pretty obvious why this has got such a backlash.”
“…Secondly, I think that there's a deep amount of external energy that's fueling this anti-technology sentiment in the United States and has been for decades. I don't think it's just China with NGO's today. I think that there is a long history of state actors intervening in media activities in foreign nations to try and create the sentiment and fuel the sentiment that reduces progress in that competitive state. I think this goes all the way back to KGB design during the Cold War and it's been refined and honed and improved over time. This is not just some conspiracy theory. There are plenty of great books about this. The techniques of what's going on specifically today, …I don't have any great details on that. But I [think there is] foreign interest in seeing technology advancement slow in competitive nations. The United States probably does similar things to other nations. And I think that that's probably a key part of [what we are seeing].”
“…And then I think a third piece is like when the Copernican Revolution happened, it was…like heliocentricity was a totally new way of thinking for humans and it was deeply disruptive to the Church, and it was deeply disruptive to the power centers to tell people Earth is at the center of the universe. We're in control. We're the direct channel to God. And the idea that the Sun is at the center of the solar system and we spin around it and we're a tiny speck in the universe was very hard for people to grasp. There's something about AI [that seems] not human-centric, and it kind of shifts and messes with the ego of the human. It's almost anti-humanist and I think that that's like a deep psychological current a lot of people and their disdain for this technology… It's not the cause but I think it fuels it. So, I think there's a lot of complicated aspects to this… and there's a real set of global competition underway where you know various state actors and interests are competing with each other.”
Venture capitalist Bill Gurley advises: “Historically, innovation has led to more prosperity for humans…And I see no reason why that won't happen today. But in the short run, from a bottom-up perspective, every human that wants to protect themselves needs to be the most AI-enabled version of themselves they can be. And the people that might be a threat of job loss are someone who stands hard, fast, and refuses to use AI. And I would just say that's simply like saying, I'm not going to use email. I'm not going to use a spreadsheet. I'm not going to use a computer."
Entrepreneur and venture capitalist David Sacks: “Proficiency in Claude [by Anthropic] is the most marketable skill right now in the economy. People are using these tools in entirely new ways. I think that we're at the outset of a boom caused by bespoke software proliferating throughout the economy and being used by firms that never thought of themselves as tech firms before. All of which is leading to more productivity, and that leads to a healthier economy, and that leads to more job creation.”
Economist Ed Yardeni sees AI as more like a productivity-enhancing force than a job-destroying force. Aside from job losses in entry-level white-collar jobs (e.g., junior programming, data-entry, or routine work), he cites continued labor-market resilience, “rewiring” work for productivity/efficiency gains, complementary effects on skilled workers (amplifying expertise and experience), job creation from AI infrastructure investment (skilled trades and construction labor), employer retraining (rather than layoff) efforts, and strong earnings/economic growth despite rapid AI adoption. Notably, despite recent announcements of layoffs in some fields (mostly involving repetitive work) and fears of AI-driven job losses and reduced hiring of college grads, Bank of America just hired 2,000 summer interns and another 2,000 full-time entry-level analysts—and the bank says its 18,000 software developers have become 20-25% more productive from AI.
But for now, AI datacenters have been one of the more controversial AI talking points for the general public, and the hostility towards their construction is growing fast (NIMBY!). While both Elon Musk and Google have pushed space-based options, those are still far from reality, making the ocean an interesting and more realistic alternative. Peter Thiel just led a $140M Series B for Panthalassa, an Oregon-based startup that builds autonomous floating compute structures powered by ocean waves, with 85-meter steel node bobs in open ocean, converting wave motion into electricity for onboard AI chips, all cooled naturally by seawater, and beam AI results back via SpaceX’s Starlink.
Datacenter power demand and the NIMBY problem:
Natural gas remains the best option to fuel power generation. Gas production in the Permian Basin has doubled since 2018, reaching 25.4 billion cf/day in 2025, according to the Energy Information Administration. The region now accounts for 22% of total US marketed natural gas production. But because gas is a byproduct of crude oil production, supply growth has consistently outpaced pipeline capacity. As a result, at least 11 newbuild or expansion pipeline projects are completed, under construction, or in advanced planning stages. In fact, over the next five years, the demand for midstream infrastructure is entering what analysts are calling the "biggest buildout surge in 20 years."
This massive buildout of gas transportation infrastructure is driven by the convergence of surging Permian production, growing LNG export demand, and the growing power requirements of datacenters. But the single largest driver for new pipeline and terminal capacity is the massive expansion of LNG exports. US export capacity is on track to rise 80% by 2028 as a fleet of new Gulf Coast terminals (like Golden Pass and Rio Grande LNG) come online. US natural gas exports are forecast to grow by nearly 30% by next year, reaching over 20 billion cf/day), according to the EIA.
One obstacle to datacenter construction is that someone has to pay for the increased energy demand. Early on, it meant power plants passing along the costs to consumers. Not surprisingly, consumers began to push back, petitioning against having datacenters in their communities, even if it could provide an economic benefit. But the NIMBY (Not In My Back Yard) problem runs deeper than just electricity bills. Communities are objecting to the physical footprint of new transmission lines, substations, and power infrastructure that large-scale datacenter development requires. The problem is about transmitting power, not just generating it. That's why President Trump called on hyperscalers to produce their own power (i.e., build their own power infrastructure) in his 2026 address to Congress.
According to Infrastructure Capital, “Northeast electricity prices have climbed to among the highest in the nation, driven by constrained natural gas supply, the retirement of coal and nuclear plants, and surging demand from data centers and electrification mandates.” Two pipeline projects taking natural gas to energy-starved northeast states have been revitalized after previously being blocked by New York state regulators, and the DOE is incentivizing electricity transmission modernization to enhance capacity and reduce friction losses.
The location of new datacenters is increasingly driven by proximity to natural gas production rather than traditional factors like network latency and land cost. Companies are building facilities near natural gas basins where on-site electricity generation eliminates dependence on the broader grid. This shift is creating new demand centers for natural gas that did not exist five years ago, actively supported by the Department of Energy. SpaceX recently disclosed that COLOSSUS and COLOSSUS II run primarily on natural gas and gas turbine technology.
Gas turbines are the fastest, most scalable way to feed a datacenter demanding 100 MW or more, which describes every serious AI training cluster being built today. But supply chain constraints for sophisticated natural gas turbines remain a challenge. Today’s natural gas turbine manufacturers must master metallurgical superalloys, complex internal air-cooling channels, and micro-machined coatings to withstand firing temperatures exceeding 2,600 degrees Fahrenheit—which is well above the melting point of the metals themselves, according to the Institute of Energy and the Environment.
But federal efforts to streamline permitting at both FERC and DOE are designed to reduce approval timelines. Moreover, the Trump Administration’s energy policy framework explicitly favors dispatchable baseload power projects (like natural gas, nuclear, and geothermal) over intermittent renewable sources (like solar and wind). For midstream pipeline operators, the convergence of Northeast affordability concerns, datacenter demand, LNG export growth, and favorable federal policy creates a multiyear investment cycle.
GE Vernova (GEV) is the dominant maker of industrial gas turbines in the United States. The company's Electrification segment, which includes HVDC systems, substations, switchgear, and transformers, essentially provides the complete infrastructure stack that a hyperscaler needs to build a self-sufficient power ecosystem. In Q1 alone, GEV booked $2.4 billion in electrification equipment orders specifically to support datacenters, which is more than all of 2025 combined, and its turbine backlog has been climbing steadily. Also, every turbine the company sells turns into a recurring services and maintenance customer for decades. As SpaceX and the broad AI industry demand more turbines, that services backlog compounds in tandem.
Of note, Chevron (CVX) and Microsoft just announced $7 billion Project Kilby in Texas, a 2.67 GW natural gas-fueled plant sourced from the Permian Basin. Expected to come online in 2028, it will be Microsoft’s datacenter campus, while Chevron owns and operates the power plant and GEV builds the turbines.
But ultimately, the tremendous power requirements of AGI (or even ASI) will go well beyond what we can (or should) burn hydrocarbons to provide. No, we will need nuclear fission. Indeed, the Trump administration’s ambitious American Energy Dominance agenda includes having 10 GW of large reactors under construction by 2030 and quadrupling our nuclear generation capacity from roughly 100GW today (94 operable reactors in 54 power plants across 28 states) to 400GW by 2050. Or preferably it will entail the holy grail of nuclear fusion.
Or even better yet, perhaps we will realize the dream of today’s entrepreneurial visionaries—like the inimitable Elon Musk of SpaceX, Planet Labs (PL) CEO Will Marshall, Starcloud CEO Philip Johnston, and Axiom Space CEO Kam Ghaffarian—to create a constellation of orbital datacenters powered directly by the sun (where there are no clouds or weather to disrupt it)—with enough left over to beam back to Earth. David Brown and I touched on this in our special report, A New Race for the Final Frontier: Space Exploration and Off-Earth Sustainability, which you can find here. According to Elon Musk, “You can manufacture solar radiators on the Moon from lunar materials. We could probably do around 1 terawatt per year of AI space compute from Earth, but 1,000 terawatts or more from the Moon—a truly staggering number.” For reference, the world currently consumes 3.5 TW of electric power (and 15-20 TW of total primary energy consumption (including gasoline, heating oil, and industrial processes).
Or perhaps we will realize George Gilder’s “post-chip” vision of a superconductive material like graphene that could house an entire datacenter on a single 12”x12” wafer, drastically reducing power requirements by eliminating bulky packaging, sprawling server farms, and energy-intensive communication bottlenecks (i.e., moving data between discrete GPU chips via copper wires).
Final Comments:
Our dysfunctional political climate has gotten so bad that we have one side (“the resistance”) openly trying to undermine the success of the party in power—and by extension, the success of the country. In the past, such dynamics were driven primarily by differences in economic ideologies, like deficit spending and expanded entitlement programs paid for my higher taxation (to immediately raise tax revenue) versus balanced budgets and reduced entitlement programs along with lower taxation (to stimulate economic growth and raise tax revenue over time). But today’s mainstream politics (aside from the growing Far Left open-border, anti-Israel, socialist movement) seems more driven by hatred for the president and a passion to see him fail—no matter the cost to the country, society, and the world. Indeed, President Trump was formerly a Democrat himself, and his programs today reflect the same views he held 40 years ago, which reflected the view of leading Democrats at the time, as well. But today’s Democrats impulsively reject anything he does, even if it means also rejecting their own long-held views (e.g., on crime, immigration, entitlements, fraud, Iran, and Israel).
A recent post by the Cato Institute explained how onerous government policies designed to “protect” employees and address growing income inequality actually depress wage growth and worker mobility. They cite an updated study by NYU economist Niklas Engbom showing that higher labor market fluidity (i.e., job-to-job mobility) leads to faster life-cycle wage growth. But “tax and regulatory policies tend to reduce that fluidity, thereby depressing wage growth…because a fluid labor market allows workers to sort into the positions that best employ their skills and encourages them to further develop those or new skills, boosting overall productivity.” Thus, policymakers should seek to “enhance workers’ autonomy and mobility.”
Similarly, entrepreneur David Friedberg opined, “Does anyone in Congress subscribe to the notion that I think is rooted in empiricism that the more we spend, the harder it is for people to have economic mobility, and I think that there's a simplified notion that government has to play a role in driving people's progress. And the truth is the more government intervenes in markets, the more inefficient and the more expensive those markets get. And therefore, the more inaccessible wealth and value creation is for any individual, and the freer the market the less the government intervenes the less the government is spending the less the government is buying the better things get for people generally speaking. And it seems to me every time I visit DC I leave profoundly unhappy because I meet with people in Congress and this is a notion that seems to be diametrically opposed to their viewpoints that everything is about doing more for people, that government needs to do more on both sides of the aisle—versus if the government did less, things would get more affordable, things would get more accessible, and people would have greater economic mobility.”
Vivek Ramaswamy asserted at a recent townhall, “It has created a culture of dependence… The modern Declaration of Independence we need is independence from the overgrown State, actually”—which has led to a rise in popularity of socialism among young people who grew up during this period of government-sponsored QE and helicopter money that distorted asset prices and worsened the wealth gap.
Most scathing of all has been the comments from JPMorgan Chase CEO Jamie Dimon, who is highly critical of Congress and its management of our tax dollars, which he believes are squandered on politicians’ friends and the vast “swamp” of over 17,000 lobbyists and special interest groups, with negligible benefit to the intended beneficiaries. Anthony Pompliano of Professional Capital Management paraphrased and commented on JP Morgan’s Jamie Dimon’s interview at the WEF, “The pitch is always the same: raise taxes, help people. But the outcome is always the same, too. Most of the money ends up with lobbyists, interest groups, and politicians’ friends…. I agree with Jamie here. Why would we take money out of the hands of the best capital allocators and give it to the government? The government is only good at wasting money. They literally suck at capital allocation. So, this whole idea of trying to say let’s tax people more so we can help others never happens. Somehow all the money ends up in the hands of friends of the politicians….”
These opinions reflect my oft-stated view about our federal and state government’s typically high-cost, low-ROI spending bills on entitlements and boondoggles versus the high ROI and job creation that the private sector brings. I have been advocating for less low-ROI government spending and more unleashing of the free market and private sector to be the primary engine of economic growth.
Also, the private sector has proven to be good at creating price deflation (lower prices due to competition and productivity improvement) while the government is good at creating asset inflation (higher prices due to monetary and fiscal policy intervention that increases liquidity). The private sector is the main engine of innovation and productivity, which can lower costs, while government heavily influences financial conditions and liquidity, which can amplify or dampen asset prices.
Today, with the federal government shrinking under the Trump Administration and the private sector taking the reins, the economy is no longer overly reliant on inefficient government deficit spending, earmarks, and boondoggles and instead is prospering from a greater focus on organic growth and efficient capital allocation from a vibrant private sector. Under the previous administration, the private sector contributed only around 2% to GDP growth and was heavily influenced by spending bills (politburo-style picking & choosing of winners and losers) rather than organic growth. But it is being reinvigorated by the new administration’s policies and incentives. Looking ahead to Q2 2026, as I mentioned earlier, the Atlanta Fed’s GDPNow model is forecasting a robust 3.0% growth rate in real GDP (as of 6/17), largely driven by massive capital spending on AI datacenters, and some commentators are predicting as much as 6% real GDP growth in Q3.
Our massive public debt has led the federal government to enact policies that juice economic growth, streamline permitting and cut red tape, boost productivity, curb energy prices, control inflation, reduce interest rates, and loosen monetary conditions, with little in the way of dreaded austerity (except for shrinking the size of government itself). To that end, the AI buildout is boosting productivity, while deregulation and support for oil & gas development have contained energy prices, and all of this has helped constrain inflationary pressures, while “financial repression” has helped lower government debt servicing costs. Financial repression is a set of government policies that artificially lower the cost of borrowing and help government to reduce its debt, including interest rate ceilings, capital controls, yield curve control (refinancing federal debt mostly on the short end of the curve), and directed lending (to support industrial policy). Of course, some worry that all the economic stimulus could lead to a “blow-off top” in stocks and other risk assets like in 1999. But as I have discussed at length in previous posts, the dot-com comparison falls short in many ways.
History shows that debt used for funding productive assets, like infrastructure, innovation, and education, can sustain growth and even pay for itself over time. But borrowing to finance unproductive entitlements and debt service does not. Unfortunately, the political and demographic realities make it nearly impossible to reverse course without severe economic fallout. Unless policymakers redirect fiscal priorities toward investment in productive capacity, the economy will remain trapped in a cycle of rising obligations, low growth, and declining returns. Fortunately, private sector-led “disruptive innovation” offers a way out, most notably the AI transformation. If leveraged wisely, including targeted investment and smart policy, AI can lift productivity, restore growth, and ease the fiscal strain.
Cato Institute study concluded, “Because corporate taxes are so economically destructive, lowering or eliminating the tax altogether may not have the fiscal consequences some fear. Trump and Congress should build on the success of the TCJA by repealing targeted subsidies, like those in the Democrat’s Inflation Reduction Act, and replace them with broad-based business tax cuts that will make America the most attractive place in the world to do business.”
Indeed, if we get out of own way, as they say, and stop the malinvestment of wars, boondoggles, and unwinnable battles against a changing climate, we can allow the magic of an unleashed private sector to do its thing in creating disruptive innovation and productivity gains from so many amazing and previously unthinkable but now rapidly advancing technologies, including generative AI, artificial general intelligence (AGI), quantum computing, blockchain and cryptocurrency, 5G, IoT, Big Data, Web 3.0, cloud computing, digitization, ecommerce, video conferencing, augmented/virtual reality (AR/VR), computer vision (CV), gaming, networks, sensors, 3-D printing, robotics, automated manufacturing, autonomous vehicles, horizontal drilling & fracking, clean fuels, green/renewable energy, nuclear fusion, electric/hydrogen transportation, space exploration, cybersecurity, decentralized finance (DeFi), fintech, nanotech, biotech, telehealth, precision medicine, computational biology, genomics, genetic sequencing, biologics, and the rapid development of diagnostics, therapeutics, and vaccines that may render future pandemics obsolete.
I discussed the history of energy, today’s surging demand, likely solutions, key companies, and Sabrient’s top Energy sector picks, in my special report, “The Future of Energy: The Lifeblood of an Economy.” You can find it at:
https://MoonRocksToPowerStocks.com.
You also can learn more about Sabrient’s process-driven, growth-at-a-reasonable-price active-selection methodology as revealed by Sabrient founder and former NASA engineer (Apollo Program) David Brown in his new book, Moon Rocks to Power Stocks: Proven Stock Picking Method Revealed by NASA Scientist Turned Portfolio Manager. You also get two Bonus Reports on the history and new opportunities for 1) Energy and 2) Space Exploration, including our top stock picks for each—all in PDF format. [Note: David’s book is also available in both paperback and eBook formats on Amazon (an international bestseller!).] The book teaches how to methodically and strategically build wealth in the stock market for four distinct investing styles—growth, value, dividend, and small cap.
Or if you just want to find out how to access the Sabrient Scorecard, an investor tool that provides access to our proprietary scores for all stocks to make the stock evaluation process easy for idea generation and portfolio monitoring, along with our Top 30 stocks each week for 4 distinct investing strategies—Growth, Value, Dividend, and Small Cap—I welcome you to visit: https://www.moonrockstopowerstocks.com/sabrient-scorecard
Latest Sector Rankings
Relative sector rankings are based on Sabrient’s proprietary SectorCast model, which builds a composite profile for each of over 1,500 equity ETFs based on bottom-up aggregate scoring of the constituent stocks. The Outlook Score is a Growth at a Reasonable Price (GARP) model that employs a forward-looking, fundamentals-based multifactor algorithm considering forward valuation, historical and projected earnings growth, the dynamics of Wall Street analysts’ consensus earnings estimates and recent revisions (up or down), quality and sustainability of reported earnings, and various return ratios. It helps us predict relative performance over the next 3-6 months.
In addition, SectorCast computes a Bull Score and Bear Score for each ETF based on recent price behavior of the constituent stocks on particularly strong and weak market days. A high Bull score indicates that stocks held by the ETF recently have tended toward relative outperformance when the market is strong, while a high Bear score indicates that stocks within the ETF have tended to hold up relatively well (i.e., safe havens) when the market is weak. Outlook score is forward-looking while Bull and Bear are backward-looking.
As a group, these three scores can be helpful for positioning a portfolio for a given set of anticipated market conditions. Of course, each ETF holds a unique portfolio of stocks and position weights, so the sectors represented will score differently depending upon which set of ETFs is used. We use the iShares that represent the ten major U.S. business sectors: Financials (IYF), Technology (IYW), Industrials (IYJ), Healthcare (IYH), Consumer Staples (IYK), Consumer Discretionary (IYC), Energy (IYE), Basic Materials (IYM), Telecommunications (IYZ), and Utilities (IDU). Whereas the Select Sector SPDRs only contain stocks from the S&P 500 large cap index, I prefer the iShares for their larger universe and broader diversity.
The table below shows the latest fundamentals-based Outlook rankings and our full sector rotation model:
The latest rankings display a bullish bias, in my view, given that cyclicals and secular growth sectors dominate the top of rankings, and defensive sectors are at the bottom. Next 12 months (NTM) analyst earnings forecasts still look quite strong for most sectors, and investors seem optimistic that the Iran conflict and shipping blockade is behind us. Only Consumer Staples and Healthcare have seen reduced EPS estimates. Expected CY2026 EPS growth over CY2025 for the S&P 500 in aggregate has risen to +23%.
Technology (dominated by the mega-cap Big Tech titans and AI-driven highflyers) remains firmly at the top with a robust Outlook score of 97, reflecting the high quality of those juggernauts despite having the highest forward P/E at 29.0x, which is well below the 31x multiple it reached last fall. Moreover, the consensus NTM EPS growth estimate of +29.3% is rising faster than price, such that the forward PEG (ratio of P/E to EPS growth) for Tech has fallen to just 0.99. Tech also displays strongly positive sell-side analyst earnings revisions, a modest forward PEG ratio of just 0.99, and by far the highest profit margins, return ratios, and insider buying. Keep in mind, investors tend to be quite willing to pay up for strong growth, so the relative value gap we saw a few weeks ago is closing.
Because many Tech stocks are riding secular growth trends (i.e., little cyclicality), no other sector comes close to the consistent sales growth, margins, operating leverage, and ROI. And Tech not only benefits from its own product development and productivity gains, but those products help other companies with their product development, product delivery, and productivity—so Tech benefits also by helping all sectors grow and prosper.
Others with low forward PEGs include Energy (0.87), Basic Materials (0.99), and Financials (1.11). As for forward P/E, Energy (11.1x) and Financials (14.1x) are the lowest.
After Tech, the next six sectors are Energy, Financials, Telecom, Basic Materials, Industrials, and Consumer Discretionary. At the bottom of the rankings are noncyclical defensive sectors Utilities and Consumer Staples. These two sectors have the lowest forward EPS growth rates, among the lowest consensus analyst revisions to EPS estimates, and the least insider buying.
Keep in mind, the Outlook Rank does not include timing, momentum, or relative strength factors, but rather reflects the consensus fundamental expectations at a given point in time for individual stocks, aggregated by sector.
To learn more about how you can access our weekly Stock and ETF Scorecards, please visit:
https://www.moonrockstopowerstocks.com/sabrient-scorecard
Sector Rotation Model and ETF Ideas
Our rules-based Sector Rotation model, which appropriately weights Outlook, Bull, and Bear scores in accordance with the overall market’s prevailing trend (bullish, neutral, or defensive), switched from a defensive to a bullish bias when the S&P 500 leapt above both its 50-day and 200-day moving averages simultaneously in early April. (Note: In this model, we consider the bias to be bullish from a rules-based trend-following standpoint when SPY is above both its 50-day and 200-day simple moving averages, but neutral if it is between those SMAs while searching for direction, and defensive if below both SMAs.)
As highlighted in the table above, the Sector Rotation model suggests holding Technology (IYW), Basic Materials (IYM), and Industrials (IYJ), in that order. Or, if you prefer to take a neutral stance, it suggests holding Technology, Energy (IYE), and Financials (IYF). However, if you prefer to maintain a defensive stance, it suggests holding Energy, Consumer Staples (IYK), and Financials.
Here is an assortment of other interesting ETFs that are scoring well in our latest rankings: SPDR S&P Oil & Gas Exploration & Production (XOP), Columbia Select Technology (SEMI), Technology Trusector (TRUT), Alger Russell Innovation (INVN), iShares US Tech Independence Focused (IETC), QRAFT AI-Enhanced US Large Cap Momentum (AMOM), Fidelity Enhanced Large Cap Growth (FELG), Nuveen Growth Opportunities (NUGO), AXS Esoterica NextG Economy (WUGI), Invesco Energy Exploration & Production (PXE), iShares AI Innovation and Tech Active (BAI), Global X PureCap MSCI InfoTech (GXPT), Nomura Focused Large Growth (LRGG), iShares Technology Opportunities Active (TEK), VictoryShares Small Cap Free Cash Flow (SFLO), US Global GO Gold and Precious Metal Miners (GOAU), Castellan Targeted Equity (CTEF), Pictet AI & Automation (PBOT), iShares Global Tech (IXN), First Trust SmallCap Buy-Write Income (FTKI), Alger AI Enables & Adopters (ALAI), and Baron Technology (BCTK). All score in the top decile (90-100) of Sabrient’s Outlook scores.
As always, I welcome your thoughts on this article! Please email me anytime. Any and all feedback is appreciated. Also, please let me know of your interest in any of Sabrient’s new indexes for ETF investing, such as High-Quality Energy, High-Quality Healthcare, Defensive Equity, High-Quality SMID Growth, High-Quality Growth & Income, and High-Quality Value, as well as the actively managed Space Exploration & Off-Earth Sustainability and Sabrient Select High-Conviction Portfolio (similar to our Baker’s Dozen portfolio, but larger). Visit Sabrient.com for more information on the six passive indexes.
IMPORTANT NOTE: I post this information periodically as a free look inside some of our institutional research and as a source of some trading ideas for your own further investigation. It is not intended to be traded directly as a rules-based strategy in a real money portfolio. I am simply showing what a sector rotation model might suggest if a given portfolio was due for a rebalance, and I do not update the information on a regular schedule or on technical triggers. There are many ways for a client to trade such a strategy, including monthly or quarterly rebalancing, perhaps with interim adjustments to the bullish/neutral/defensive bias when warranted, but not necessarily on the days that I happen to post this article. The enhanced strategy seeks higher returns by employing individual stocks (or stock options) that are also highly ranked, but this introduces greater risks and volatility. I do not track performance of the ideas mentioned here as a managed portfolio.
Disclosure: At the time of this writing, of the securities mentioned, the author held positions in SPY, FTLS, STRL, GEV, XOP, GOAU, and gold.
Disclaimer: Opinions expressed are the author’s alone and do not necessarily reflect the views of Sabrient. This newsletter is published solely for informational purposes only. It is neither a solicitation to buy nor an offer to sell securities. It is not intended as investment advice and should not be used as the basis for any investment decision. Individuals should consider their personal financial circumstances in acting on any opinions, commentary, rankings, or stock selections provided by Sabrient Systems. Sabrient makes no representation that the techniques used in its rankings or analyses will result in profits. Trading involves risk, including possible loss of principal and other losses, and past performance is no guarantee of future results. Investment returns will fluctuate, and principal value may either rise or fall. Sabrient disclaims liability for damages of any sort (including lost profits) arising from the use of or inability to use its rankings or analyses. Information contained herein reflects our judgment or interpretation at the time of publication and is subject to change without notice.
Copyright © 2026 Sabrient Systems, LLC. All rights reserved.