by Scott Martindale
CEO, Sabrient Systems LLC
Quick note: If you are a financial advisor who would like to see Sabrient portfolios packaged in an ETF wrapper, please drop me an email (or suggest it to your local ETF wholesaler). We have a line-up of active and passive alpha-seeking portfolios and indexes ready to go!
Overview
The January BLS jobs report strengthened while CPI cooled—a match made in heaven for the economy, right? But investors are grappling with what it portends for Fed monetary policy, particularly given the impending changing of the guard at the Fed. That seems to be all the market cares about at the moment. But of course, in the longer term, these trends bode well for lower interest rates and growth in GDP, earnings, and stock prices, particularly given full implementation of the One Big Beautiful Bill Act (OBBBA), which focuses on tax reform, deregulation, energy production, border security, and broad support for the private sector to retake its rightful place as the primary engine of growth via re-privatization, reshoring, and re-industrialization, with much more efficient capital allocation and ROI than government. All told, I think the GDP, jobs, and inflation story suggests room for more rate cuts, as I discuss in detail in my full commentary below.
As I expected, particularly after a third straight strong year for the market, stocks have been more volatile during Q1, with the CBOE Volatility Index (VIX) climbing back above the 20 “fear threshold.” Energy, Basic Materials, high-dividend payers (aka “bond proxies”), defensive sectors Consumer Staples and Telecom, small caps and equal-weight versions of the major indexes have all significantly outperformed the long-time high-flying mega-cap Tech-dominated S&P 500 and Nasdaq 100 that have been so hard to beat for so long.
February has been marked by rising volatility plus much wailing and gnashing of teeth as the AI story (big investments now for even bigger returns and productivity growth in the near future) is suddenly being questioned. No doubt, stocks have seen the manifestation of investor worries of disappointing or delayed ROI on the massive capex for AI, as well as a crowding out of other uses for the cash, such as for dividends and share buybacks. In addition, the concern that AI will make all current software/SaaS companies obsolete has cut down most software stocks at the knees. And then we have the impact of Kevin Warsh’s nomination for Fed chair, which initially sent commodities (including surging gold and silver) into a tailspin on expectation of (heaven forbid!) tighter policy, lower debt, and a stronger dollar—which used to be considered good things and signs of a robust economy.
In addition, the macro clouds of uncertainty persist regarding trade deals and tariffs, the intractable Ukraine/Russia war, the Venezuela, Cuba, and Iran situations (which also impact China, Russia, and oil markets broadly), enforcement of immigration law, civil strife in US cities, political polarization, imminent midterm elections, Fed policy uncertainty, a stagnant “no-hire, no-fire” jobs market, signs of consumer distress, another partial government shutdown (or in this case, just the DHS), and rising federal debt now approaching $39 trillion (of which $31 trillion held by the global public)—not to mention the gargantuan total unfunded/underfunded liabilities that comprise guaranteed programs like Social Security, Medicare, employee pensions, and veterans’ benefits (as much as $50-100 trillion), plus over $6 trillion in state and local government debt of which over $2 trillion represents public pension and healthcare liabilities as well as state budget deficits that might eventually need federal bailouts. The states and cities in the worst shape are almost all “blue” due to their onerous tax and regulatory policies and massive nanny-state entitlement programs.
So, is it time to go all-in on these defensive plays? Are we due for another 2022-esque bear market? I think not. I think the core of an equity portfolio still should be US Big Tech stocks, given the entrepreneurial culture of US, disruptive innovation, and world-leading ROI that attract foreign capital, as well as Big Tech’s huge cash stores, wide moats, global scalability, resilient and durable earnings growth, free cash flow, margins. In fact, Bill Ackman’s Pershing Square just announced it increased its holdings in Meta Platforms (META) to $2 billion (10% of investment capital). However, the Big Tech hyperscalers (e.g., Microsoft, Alphabet, Amazon, and Meta) have always been considered “asset-light” with their focus on IP, software, and high ROI on minimal physical infrastructure, but their massive spending on datacenters essentially has transformed them into “asset-heavy,” capital-intensive.
According to the Financial Times, “A total of more than $660 billion is set to be ploughed into chips and data centres this year... The unprecedented infrastructure build-out will force Big Tech executives to choose between stemming capital returns to shareholders, raiding their cash reserves or tapping the bond and equity markets more than previously planned.” This has impacted investor psyches.
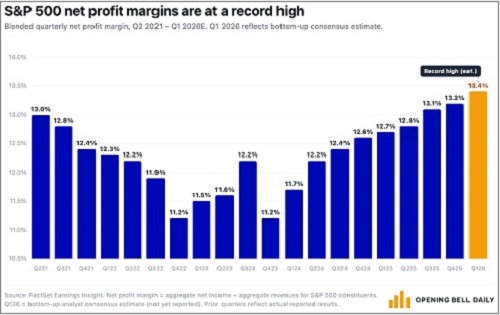
Nevertheless, there has been little deterioration in the fundamental story for the economy and stocks, and in fact the earnings projections for the S&P 500 in CY2026 are pushing upwards of 15% YoY, according to FactSet. Moreover, net margins are now at 10-year highs (and climbing)—and it extends beyond just the Tech sector. Cathie Wood of Ark Invest believes the US has suffered through a “rolling recession” (largely due to high interest rates) that have “evolved into a coiled spring that could bounce back powerfully during the next few years.” Indeed, capital flow already seems be returning to the AI infrastructure plays, including semiconductors, hyperscale cloud providers, and specialized networking, if not the software/SaaS firms, as I discuss in greater depth below.
Still, ever since the market low on 11/20, small and micro-cap indexes have greatly outperformed, as have the S&P 500 High Dividend (SPYD), S&P 500 Equal-Weight (RSP), and the Dow Transports (IYT). Value is doing well, too. So, this market broadening and mean reversion on valuations that is underway should also offer other (and likely better) opportunities among the AI infrastructure builders (datacenters and networking equipment) and power generators (beyond the giants and hyperscalers) from Industrials, Utilities, and Energy sectors, as well as small/mid-caps, value, quality, cyclicals, and equal-weight indexes. In addition, you might consider high-quality homebuilders, regional banks, insurers, energy services, transports, and healthcare/biotech/biopharma companies. Also, falling interest rates and rising liquidity suggest bond-proxy dividend stocks. Select small caps can offer the most explosive growth opportunities even if the small-cap indexes continue to lag the S&P 500. When borrowing costs decline and credit spreads tighten, small caps tend to respond earlier and more robustly than their larger brethren.
Historically, small caps tend to outperform during periods of rising economic growth, cooling inflation, and falling interest rates. Indeed, analysts are expecting a rebound in earnings for the Russell 2000 this year, beyond the healthy expectations for the S&P 500. Keep in mind, while the cap-weight large cap indexes are dominated by Technology, small cap indexes tend toward Industrials, Materials, and Financials (including regional banks), which should benefit from broad-based economic activity, infrastructure spending, and reshoring of supply chains. Moreover, a dovish Fed should support the earnings of the more interest rate-sensitive market segments (like small caps) as well as mortgage lenders, credit card issuers, high-quality regional banks, property & casualty insurers (who hold bonds as claim reserves), homebuilders and suppliers, home improvement firms, title insurance firms, REITs, and automakers/dealers.
But whether the broad indexes finish solidly positive this year may depend upon: 1) liquidity growth, 2) the relative strength of the dollar, 3) the steepness of the yield curve (could the 2-10 spread rise above 100 bps?), 4) the status and outlook on capex for AI and onshoring, and 5) the midterm elections and whether Republicans retain the House. According to economist and liquidity expert Michael Howell of CrossBorder Capital, this stage of the liquidity cycle (slowing liquidity growth) is correlated with falling bond term premia and flattening yield curve—which means Treasury notes and bonds may perform well later in the year. Indeed, given where we are with stability in real interest rates and inflation expectations, including the many disinflationary trends—like AI, automation, rising productivity, falling shelter and energy costs, peace deals, a firmer dollar, and the deflationary impulse from a struggling China—bonds seem ready to return to their historical role as a portfolio diversifier.
After the S&P 500’s terrific bull run over the past three years in which the MAG7 accounted for roughly 75% of the index’s total return, I think this year might see the equal-weight RSP and small cap indexes outperform the SPY, with the SPY gaining perhaps only single-digit percentage. This scenario also might favor strategic beta and active management. Regardless, stock market performance should be dependent upon strong ROI and earnings growth rather than significant multiple expansion. So, rather than the broad passive indexes (which are dominated by growth stocks, Big Tech, and the AI hyperscalers), I think 2026 should be a good year for active stock selection, small caps, and bond-alternative dividend payers—which bodes well for Sabrient’s Baker’s Dozen, Forward Looking Value, Small Cap Growth, and Dividend portfolios.
I go much further into all of this in my full post below, particularly regarding inflation and Fed policy. Overall, my recommendation to investors remains this: Focus on high-quality businesses at reasonable prices, hold inflation and dollar hedges like gold, silver, and bitcoin, and be prepared to exploit any market pullbacks by accumulating high-quality stocks as they rebound, with earnings fueled by massive capex in AI, blockchain, energy, and power infrastructure and factory onshoring, leading to rising productivity, increased productive capacity, and economic expansion. Regarding “high-quality businesses,” I mean fundamentally strong, displaying a history of consistent, reliable, resilient, durable, and accelerating sales and earnings growth, positive revisions to Wall Street analysts’ consensus estimates and a history of meeting/beating estimates, rising profit margins and free cash flow, high capital efficiency (e.g., ROI), solid earnings quality and conservative accounting practices, a strong balance sheet, low debt burden, competitive advantage, and a reasonable valuation compared to its peers and its own history.
These are the factors Sabrient employs in our quantitative models and portfolio selection process. As former engineers, we use the scientific method and hypothesis-testing to build models that make sense. We are best known for our Baker’s Dozen growth portfolio of 13 diverse picks, which is designed to offer the potential for outsized gains. It is packaged and distributed as a unit investment trust (UIT) by First Trust Portfolios—along with three other offshoot strategies for value, dividend, and small cap themes. In fact, the new Q1 2026 Baker’s Dozen portfolio recently launch on 1/20/2026. Also, as small caps and high-dividend payers benefit from falling interest rates and market rotation, the quarterly Sabrient Small Cap Growth and Sabrient Dividend (a growth & income strategy) might be timely investments. Notably, our Earnings Quality Rank (EQR) is a key factor in each of our strategies, and it is also licensed to the actively managed, low-beta First Trust Long-Short ETF (FTLS) as a quality prescreen.
Sabrient founder David Brown reveals the primary financial factors used in our models and his portfolio construction process in his latest book, Moon Rocks to Power Stocks—now an Amazon bestseller—written for investors of any experience level. David describes his path from NASA engineer in the Apollo Program to creating quantitative multifactor models for ranking stocks and building stock portfolios for four distinct investing styles—growth, value, dividend, or small cap.
Here is a link to this post in printable PDF format, where you can also find my latest Baker’s Dozen presentation slide deck. As always, I’d love to hear from you! Please feel free to email me your thoughts on this article or if you’d like me to speak on any of these topics at your event! Read on….