
by Scott Martindale
CEO, Sabrient Systems LLC
Quick note: Sabrient’s new Q3 2026 Baker’s Dozen Portfolio will launch on Monday 7/20 as a 15-month portfolio with a mid-cap bias and a diverse group of 13 stocks across 8 business sectors, including several under-the-radar names. Notably, the next-to-terminate Q2 2025 Baker’s Dozen shows a gross total return of +54.7% from its inception date of 4/17/25 through 7/10/26, vs. +45.6% for SPY. Until 7/17, the Q2 2026 portfolio remains in primary market for new investment. Its top performers so far are Seagate Technologies (STX), Roku (ROKU), and AbbVie (ABBV).
Overview
During Q2 2026, the S&P 500 and Nasdaq Composite indexes posted their best quarter since the pandemic recovery in 2020, rising +14.9% and +21.4%, respectively, driven by AI-related chip stocks, as the resilient bull market powers on. And encouragingly, market breadth expanded nicely as the Russell 2000 small cap index was up +21.4% (following a flat +0.9% Q1), giving it its best H1 since 1991 (+22.6%) as investors sought to broaden their exposure into growing companies poised to benefit from the One Big Beautiful Bill Act’s (OBBBA) tax policies, deregulation, and incentives.
After ChatGPT arrived in November 2022, the market was all about AI-dominant Big Tech, creating hyperscale, and spending unprecedented capex (consuming all the hyperscalers’ massive cash flow, plus some new debt) that drove a 150% gain in the Nasdaq over the ensuing 3.5+ years (annualizing around 30%/yr). But so far this year, the “S&P 493” have vastly outperformed the MAG7 (which peaked on 5/14 and then sold off 15% by 6/26 before bouncing), and investors have invited small caps—and other “trickle down” industries benefiting from massive AI capex—to join the party, despite the event-driven oil price shock, inflation spike, and rising Treasury yields. But Treasury yields are likely being driven more by the hawkish Fed talk than from concerns about structural inflation, and although the coast isn’t entirely clear of macro hurdles, it would be highly unusual for this broadening advance to spell the end of the bull market.
In my full commentary below, I discuss:
1. The trend in consumer sentiment vs. stock prices
2. AI capex and power demand
3. Fundamental tailwinds and the impact on China
4. The “SaaSpocalyse” and what happens next
5. Global liquidity concerns
6. Status and outlook for GDP, inflation, jobs, and productivity
7. My final comments section on stanching the insidious rise of socialism in this country
8. Sabrient’s sector rankings, positioning of our sector rotation model, and some top-ranked ETF ideas
Investor preferences even within Big Tech are definitely rotating. Suddenly, Apple (AAPL) has caught up with Alphabet (GOOGL) as the top performing MAG7 stocks YTD. Apple is expanding its relationship with Broadcom (AVGO) in a $30 billion chipmaking deal to produce more than 15 billion chips in the US, including expansion of Broadcom’s Fort Collins, CO facility. There are now 13 stocks in the $1 trillion market cap club—the MAG7 plus tech sector comrades Taiwan Semi (TSM), Broadcom (AVGO), SpaceX (SPCX), and Micron (MU), along with financial Berkshire Hathaway (BRK-B) and healthcare name Lilly & Co (LLY).
Meanwhile, previous investor darling NVIDIA (NVDA) is now trading at its lowest multiple since 2019. Despite posting an 85% YoY increase in revenue, hitting a whopping $81.6 billion last quarter, share price has been flat such that its forward P/E at around 22x is on par with the broad S&P 500’s composite forward P/E. Compare that to its 5-year average of 72x. The chart below is from Phil Rosen of Opening Bell Daily.
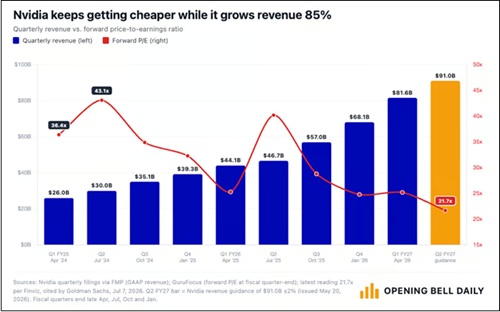
After pulling back nearly 20% from its all-time high on 5/14, NVIDIA has recovered some ground and is up about +13% YTD, but rival Advanced Micro (AMD) is up +160% and Intel (INTC) is up +200% over the same timeframe, with forward P/Es around 75x and 125x, respectively. More broadly, according to Morgan Stanley, the P/E premium for the MAG7 versus the other S&P 493 has compressed from above 30% to roughly 10%. I suppose investors don’t see how it can continue to achieve such amazing growth and huge margins, which are attracting more competition in the space. Regardless, analysts continue to raise estimates, and NVIDIA should remain a growth juggernaut for the foreseeable future—particularly with hyperscaler capex (much of which buys NVIDIA products) projected to reach $1 trillion in 2027.
Incredibly, although NVIDIA lost around $1 trillion in market cap during its May-June correction, it is now back above $5 trillion in market cap and is the world’s largest company—on par with Germany’s entire nominal GDP, which is the third-largest economy in the world behind the US and China. NVIDIA represents about 8.5% of the S&P 500 index market cap, and it is larger than: 1) the entire Russell 2000 small cap index ($3.5 trillion), 2) 6 of the world’s top 10 stock exchanges (including UK, France, Italy, India, and Spain); 3) 6 of the 11 sectors of the S&P 500 individually; and 4) the combined market cap of the S&P 500’s Materials, Real Estate, and Utilities sectors.
Broadening beyond the market’s biggest stocks is well in motion. Both the Russell 2000 small cap index (+20% YTD) and the Dow Jones Transportation Average (+18% YTD) have had their best start to a year since 1991. Financials, Healthcare, and Industrials all displayed outperformance versus the broad S&P 500 during June. Corporate profitability has been solid across industries, reflecting resilient demand, disciplined cost management, technological innovation, and sustainable productivity gains—not to mention the trillions of dollars in capex for the gradual onshoring/reshoring of manufacturing, much of it already underway. Net corporate income now accounts for 12.4% of GDP.
As I write about regularly, the outlook for inflation continues to improve, particularly given the many underlying global disinflationary trends. This week brings the June CPI/PPI numbers, which I expect will be lower—although the resumption this month in hostilities in Iran and the resultant jump in oil and gasoline prices might signal some inflationary pressures for the July metrics and cause investors (and the Fed) to hold off on any celebration. Notably, seven OPEC+ countries (Saudi Arabia, Russia, Iraq, Kuwait, Kazakhstan, Algeria, and Oman) agreed to increase oil production by a combined 188,000 barrels per day starting in August. But beyond that announcement, supply chains have rapidly diversified in response to the Strait of Hormuz bottleneck—and what the International Energy Agency (IEA) has called “the largest supply disruption in history”—such that it is no longer strangling the global economy, as I discussed in my April post. Indeed, this was long overdue as Iran has not been a reliable observer of the “right of transit passage” in narrow international straits under the UN Convention on the Law of the Sea (UNCLOS) in 47 years.
In my full commentary below, I discuss the divergence between poor consumer sentiment versus strong advisor sentiment and a rising stock market, as well as the shift in focus from both the federal government and institutional investors into hard assets and infrastructure. Moreover, through the end of this decade and likely beyond, I expect to see smaller government and less low-ROI government spending in favor of more high-ROI capital allocation from an unleashed private sector as the primary engine of organic economic growth through fiscal support like favorable tax policy, deregulation, and other supply-side incentives for reshoring/onshoring to increase productive capacity.
This should lead to strong real GDP growth, a peace dividend, rising productivity and a resumption in other disinflationary trends that bring back inflation under 2.5%, and a new “hands-off” Federal Reserve under new chairman Kevin Warsh that aims for less market intervention and does not fear that robust economic growth (aka “overheated” or “above trend”) fuels inflation. Instead, Warsh believes as I do that inflation in general is driven by excessive monetary expansion and deficit spending (including massive spending bills, “helicopter money,” and QE), rather than by a strong and productive private economy.
As such, I still think the S&P 500 might hit 8,000 by year end, although I also think gold, silver, copper, and bitcoin remain long-term accumulation plays, even though they might see further near-term headwinds (e.g., war, a hawkish Fed, and a strong dollar). Given the market broadening beyond the Big Tech titans, and assuming the Fed does not become overly hawkish, we continue to see opportunities in active stock selection, small caps, and bond-alternative dividend payers.
Indeed, Sabrient’s Baker’s Dozen, Forward Looking Value, Small Cap Growth, and Dividend portfolios have been largely outperforming their benchmarks. Our latest Q2 2026 Baker’s Dozen Portfolio launched on 4/17 as a 15-month portfolio with a mid-cap bias and a diverse group of 13 stocks across eight business sectors. It remains in primary market until Friday 7/17, and then the new Q3 2026 Baker’s Dozen launches on Monday 7/20. And, as a reminder, our Earnings Quality Rank (EQR) is licensed as a quality prescreen to the actively managed, low-beta First Trust Long-Short ETF (FTLS), which now has over $2.4 billion in AUM.
Sabrient employs a variety of fundamental financial factors in our quantitative models and portfolio selection process. Sabrient Scorecards for Stocks and ETFs are investor tools that provide access to several of our proprietary models for idea generation and portfolio monitoring. To learn more, I invite you to visit https://MoonRocksToPowerStocks.com where you can download founder David Brown’s latest book (an Amazon international bestseller) and 2 bonus reports (on investing in the Future of Energy and Space Exploration)—all in PDF format—and start subscribing to the Scorecards, which make David’s process easy for idea generation and portfolio monitoring. They include our Top 30 stocks each week for 4 distinct investing strategies—Growth, Value, Dividend, and Small Cap. To go straight to the Scorecard subscription, go to: https://www.moonrockstopowerstocks.com/sabrient-scorecard
Here is a link to this post in printable PDF format. As always, I’d love to hear from you! Please feel free to email me your thoughts on this article or if you’d like me to speak on any of these topics at your event! Read on….

 by Scott Martindale