
by Scott Martindale
CEO, Sabrient Systems LLC
Overview
Bullish conviction was severely tested in November for the first time since the April “Liberation Day” selloff. All the naysayers quickly piled on with warnings of an AI bubble and financial returns on immense capex not being realized for many years, if ever. To make matters worse, they warned of sluggish global liquidity growth in the face of rising debt and an impending “debt maturity wall,” i.e., enormous government and corporate refinancing that could overwhelm capital markets, surge borrowing rates, tighten lending standards, crowd out smaller businesses, and thereby constrain economic growth. But alas, the fear didn’t last long, as the old “bad news is good news” narrative was resurrected to predict increasingly dovish Fed monetary policy would save the day. Indeed, it appears that the S&P 500 still has a shot at finishing 2025 with its third straight year of 20%+ returns (which would be only the second time in history, after the five straight years of the 1995-99 dotcom/Y2K run). And yet the K-shaped economy (i.e., investor/creditor class vs. working/debtor class) is leaving too many citizens behind, particularly young and working-class people.
Remember the famous quote from the fearsome heavyweight champion boxer Mike Tyson, “Everyone has a plan until they get hit in the face”? Well, Steve Forbes had a similar quote for the stock market, “Everyone is a disciplined, long-term investor…until the market goes down.” Indeed, the AI-driven bull run seemed uninterruptable for over six months, with the S&P 500’s 50-day moving average providing reliable support all along the way…at least until 11/17 when for the first time in 138 days (since 4/30) the index closed below its 50-day moving average and triggered a panicky selloff. And then even after another incredible earnings report on 11/19 from market leader NVIDIA (NVDA) that sent the market surging higher on 11/20, by mid-day it came crashing back down on news suggesting maybe the jobs market really wasn’t so bad, which led to worries that the Fed might not cut this month after all, and the market finished the day with a big, ugly, red bearish-engulfing candle. As they say, the more overbought, the worse the correction.
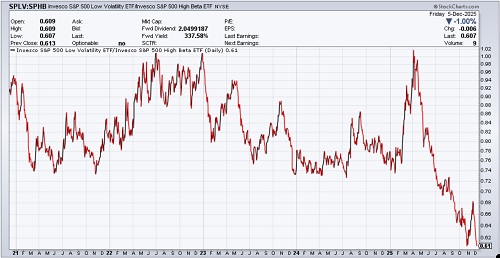
But thankfully, that big, bad, bearish-engulfing candle turned out to be a double-bottom (with the 10/10 low). The S&P 500 found support at its 100-day moving average and then embarked on a rally that has almost entirely retraced its fall from October’s all-time high. It has largely been a speculative “junk rally,” led by the “meme” stocks—like the Roundhill Meme Stock ETF (MEME) and the iShares Micro-cap ETF (IWC), followed by the lower-quality small-cap iShares Russell 2000 (IWM), in which about 40% are unprofitable, then the higher-quality small-cap SPDR S&P 600 (SPSM), in which all are required to be profitable for index entry, and with the mid and large caps trailing behind. Defensives have lagged since April, as illustrated in the chart below showing the ratio of the S&P 500 Low Volatility (SPLV) divided by the S&P 500 High Beta (SPHB), which after a brief jump during the November pullback has returned to its extreme low.
Interestingly, the stock market briefly added a new member of the $1 trillion market cap club during the broad market correction, with drugmaker Lilly & Co. (LLY) enjoying a huge November surge (along with much of the Healthcare sector overall, in a mean reversion catch-up), largely driven by sales in its weight-loss drug Zepbound. So, as LLY pulled back, the trillion-dollar club today is back to 10 members—the original MAG-7 (NVDA, AAPL, GOOGL, MSFT, AMZN, META, TSLA) plus Broadcom (AVGO), Taiwan Semi (TSM), and Berkshire Hathaway (BRK.B).
Short-term technicals on the broad market indexes are overbought once again but still well supported within a bullish uptrend. Nevertheless, for the S&P 500 to hit the 20% return mark for the year will require a bullish catalyst. Most likely it will be the highly anticipated Fed rate cut this week, and importantly, some soothingly dovish words from chairman Jay Powell on additional easing measures plus guidance on the “dot plot” of future rate cuts. However, he can’t be overly dovish as to bring out the “bond vigilantes” in protest, spiking longer-term yields, which would not be favorable for stocks. Market maven Jim Bianco said in an interview on The Money Path that he thinks the tell will be in the number of FOMC member dissents on the expected rate cut, with several dissenters mollifying the bond vigilantes and no dissent angering them. So, Powell walks a tightrope on this, and messaging matters.
Regardless, the liquidity cycle is turning back up, with the Fed already halting its balance sheet reduction (quantitative tightening or QT) as of 12/1, and with more rate cuts in the offing, plus perhaps relaxed capital requirements for banks (like the enhanced supplementary leverage ratio or eSLR) and some form of "QE-lite" to gradually re-expand its balance sheet without antagonizing the bond market. All of this should result in rising M2 money supply. In addition, China has introduced fiscal stimulus and monetary tactics like repurchase operations (“repo”) and a lowered bank reserve requirement ratio (RRR). Furthermore, supply chain pressures are muted, fiscal expansion is underway with lower tax rates and less red tape from the One Big Beautiful Bill Act (OBBBA), and money market funds (aka cash on the sidelines) exceed $8 trillion (the highest ever).
In fact, the Atlanta Fed’s GDPNow is projecting real GDP growth of 3.5% growth in Q3, and forecasters think Q1 2026 might see US growth above 4% given the imminent fiscal impulse (including massive tax refunds in Q1) that should boost the struggling consumer. So, aggregate demand would be expected to rise, likely above the rate of aggregate supply since demand can shift much faster than supply can adjust to match. This would lift asset prices initially, which could be inflationary. As such, some market commentators believe the fed funds neutral rate should match the current rate of nominal GDP growth of 5-6%.
I’m not one of those people. I think any short-term inflationary pressures will be fleeting and offset by the secular disinflationary pressures I often describe: Global Supply Chain Pressure Index (GSCPI) continues to hover at or below the zero line (i.e., its historical average), the benefits of globalization (including comparative advantage) persist despite some strategic onshoring and supply chain diversification, there is a deflationary impulse from China as its dumps cheap goods on the world market in the face of weak domestic demand, and productivity continues to increase through automation and disruptive innovation (including Gen AI).
So, my long-held view remains that a terminal/neutral rate near 3.0% seems right, and the latest fed funds futures suggest 66% odds we get there next year—and that likelihood should increase with the appointment of a new Fed chairman in May (most likely economist Kevin Hassett). Bond yields have normalized with the 10-year Treasury under 4.2%. The flatter yield curve is a market signal to the Fed that it should cut on the short end. The economy needs lower interest rates, including a 30-year mortgage closer to 5%, in tandem with business-friendly fiscal policy and a weaker dollar to: a) sustain rising global liquidity, b) relieve indebted consumers and businesses, c) support US and global economies, and d) avert a global credit crisis. And once that neutral rate is achieved, the Fed can go back into the shadows where it was always intended to be and let fiscal, trade, and tax policies from Congress and the President dominate the news cycle. No more sitting on pins-and-needles at every FOMC meeting or Fed governor speaking engagement.
The return of the “bad news is good news” outlook has fed funds futures solidified at 89% odds of a December cut on 12/10. It also has pushed stocks to within spitting distance of new all-time highs. But notably, bitcoin and other cryptocurrencies corrected much more sharply than stocks, mostly due to deleveraging, and have not yet bounced back like stocks have. Nevertheless, blockchain, tokenization, and stablecoin implementation continue to progress, so I’m not concerned about my crypto allocation—in fact, bitcoin might have just put in a bottom at its 100-week moving average.
Yes, uncertainty persists around trade deals, wars, rising debt, civil strife, stock valuations, a hesitant Fed, and potential government shutdown redux in late January. But investors are positioning for tax and interest rate cuts, deregulation, tame inflation, strong margins & earnings, improving revenue growth, re-privatization, re-industrialization, fast-tracking of power generation infrastructure, robust capex and share buybacks, rising liquidity, a potential “peace dividend,” and a continued flow of foreign capital into the US. Importantly, DataTrek pointed out that Q3 corporate revenue increased by a multi-year record of +8.4%, which is critical for future earnings power—as earnings growth via sales growth is better than cost cutting (higher quality earnings beats). Also, they point out that the percentage of after-tax operating earnings that paid for dividends and stock buybacks has fallen from 96% in 2018 to 81% today, which suggests the difference is being reinvested in business growth—and supports today’s elevated valuations.
In my full commentary below, I talk in greater depth about the K-shaped economy, electricity prices, earnings, debt, inflation, jobs, and Fed policy, as well as the difficulty in “turning the economic ship”—from overreliance on vast, stifling government spending to a robust, unleashed private sector—in the face of political obstructionism, a hostile media, and the impatience of voters in feeling the benefits of the newly passed fiscal stimulus package and the Fed’s monetary stimulus on affordability and mortgage rates, pushing many of them (especially young people and the lower-income/non-asset-holding working class) to shortsightedly embrace the “free stuff” promises of socialist candidates.
I close my commentary by revealing Sabrient’s latest fundamental-based SectorCast quantitative rankings of the ten U.S. business sectors, current positioning of our sector rotation model, and several top-ranked ETF ideas. Top-ranked sectors in Sabrient’s SectorCast model include Technology, Healthcare, and Financials. In addition, Basic Materials, Industrials, and Energy also seem poised to eventually benefit from fiscal and monetary stimulus, domestic capex tailwinds, a burgeoning commodity Supercycle, rising demand for natural gas for power generation, and more-disciplined capital spending programs.
History shows that rising GDP growth, stable inflation, and falling interest rates tend to favor small caps. And because small cap indexes are more heavily allocated to Industrials, Basic Materials, and Financials, enhanced infrastructure spending and a revved-up economy could disproportionately benefit them. Indeed, rather than a continuation of the FOMO/YOLO momentum rally on the backs of a narrow group of AI leaders (and some speculative coattail riders), I expect the euphoria will be more tempered next year such that we get a healthy broadening and wider participation across caps and sectors and with a greater focus on quality and profitability. There are plenty of neglected high-quality names worthy of investment dollars. So, rather than the passive cap-weighted indexes, investors may be better served by active stock selection that seeks to identify under-the-radar, undervalued, high-quality gems primed for explosive growth. This is what Sabrient seeks to do in our various portfolios, all of which provide exposure to Value, Quality, Growth, and Size factors and to both secular and cyclical growth trends.
Concerningly, only 22% of active fund managers are outperforming their passive benchmark this year, largely due to the narrow market leadership from the AI-leading Big Tech titans. However, Sabrient has been performing well. We are best known for our 13-stock “Baker’s Dozen” growth portfolio franchise, which is issued quarterly as a 15-month unit investment trust (UIT) by First Trust Portfolios, and each is designed to offer the potential for outsized gains. For example, the Q1 2024 Baker’s Dozen terminated on 4/21/25 with a gross return of +45.7% vs. +8.2% for S&P 500, and the Q3 2024 portfolio terminated on 10/20/25 up +41.7% vs. +24.1% for S&P 500.
In addition, last year’s 33-stock Forward Looking Value 12 terminated on 11/10/25 up +19.9% vs. +12.7% for the S&P 500 Value Index. Also, small caps tend to benefit most from lower rates and deregulation, and high dividend payers become more appealing as bond alternatives as interest rates fall, so Sabrient’s quarterly Small Cap Growth and Sabrient Dividend (growth & income strategy) also might be timely as beneficiaries of a broadening market.
The Baker’s Dozen growth portfolio and three offshoot strategies for value, dividend, and small cap all leverage Sabrient’s process-driven, growth-at-a-reasonable-price methodology, which was developed by founder David Brown. All four strategies are described in his latest book, Moon Rocks to Power Stocks: Proven Stock Picking Method Revealed by NASA Scientist Turned Portfolio Manager (catch the low-price promotion this week only!). To learn more about both the book and the companion subscription product we offer (which does most of the stock evaluation work for you), please visit: https://DavidBrownInvestingBook.com
Click HERE to find this post in printable PDF format, as well as my latest Baker’s Dozen presentation slide deck and my 3-part series on “The Future of Energy, the Lifeblood of an Economy.” As always, I’d love to hear from you! Please feel free to email me your thoughts on this article or if you’d like me to speak on any of these topics at your event! Read on….

 What does the market want, anyway? I know that's the name of this newsletter, but it's not an easy question to answer in recent months, and especially in the last couple of weeks.