 by Scott Martindale
President & CEO, Sabrient Systems LLC
The S&P 500 rose 20.8% during the first three quarters of 2024, which is its best start since 1997 and the best for any presidential election year in history. Moreover, for perspective, the ratio of US stock market capitalization to the global stock market has risen from 30% in 2009 (following the GFC) to almost 50% today. This has happened despite escalation in multiple wars, numerous catastrophic weather events ravaging the country, a highly contentious election tearing apart friends and families, strapped consumers (after 25%+ cumulative inflation over the past few years), falling consumer confidence, and jobs and GDP growth over-reliant on government deficit spending, with national debt approaching $35.7 trillion and rising $2 trillion/year (as debt carrying costs alone cost over $1 trillion/year). Even over the past several days when oil prices spiked above $75/bbl (on sudden escalation in the Middle East conflict) and bond yields surged (with the 10-year reaching 4.05%), the major indexes continue to hold near their highs.
As investor Howard Lindzon (of StockTwits fame) said the other day, “There is a fear trade happening (e.g., gold and bitcoin) while there is growth trade happening. It’s really mind-boggling.” Indeed, many of the most prominent investors are wary, including the likes of Warren Buffett, Jamie Dimon, and Jeff Bezos, and corporate insider buying has slowed.
I’m not an economist. I started my career as a structural engineer with Chevron Corporation, then earned an MBA in night school and moved into the business side of the company before venturing into the world of investment research. But as a long-time student of the economy and capital markets, combined with my critical-thinking nature and engineering training, I’ve developed a healthy skepticism of numbers presented to me, even from supposedly objective sources like the government. They have to pass the “smell test.”
Of course, the Fed has been basing its monetary policy primarily on metrics calculated by federal agencies regarding inflation, jobs, and GDP. But headline YoY numbers can be illusory—particularly when they are propped up by massive government deficit spending. So, I like to look beyond the headline numbers. For inflation, my skepticism of official numbers (with the long lag times of key components, like shelter cost, and distorted metrics like “owner’s equivalent rent,” which is highly subjective and based on surveys of homeowners) is why I seek alternative metrics like: 1) the annualized rolling 3-month average of month-over-month price changes (which better reflects current trends), 2) a European method (quietly published by the BLS since 2006) called the Harmonized Index of Consumer Prices (HICP), and 3) the real-time, blockchain-based Truflation, which is published daily.
My skepticism was further elevated when I saw the jobs, retail sales, and ISM Services metrics all suddenly perk up in September—right before the election after a lengthy period of decline and contrary to several negative developments like a record divergence between rising consumer credit card debt and falling personal savings and The Conference Board’s Consumer Confidence dropping to the bottom of its 2-year range and showing increasing pessimism about labor market conditions.
On the other hand, it is notable that Truflation also has risen quickly over the past couple of weeks to nearly 2.0% YoY, so could this be corroborating the apparent rise in consumer demand? Could it be that the Fed’s dovish pivot and 50-bps rate cut has suddenly emboldened consumers to start spending again and businesses to ramp up hiring? Or are my suspicions correct such that we are in store for more downward revisions on some these rosy metrics post-election? After all, the last set of major revisions in early September showed not just an over-reliance on government jobs and government-supported jobs (through targeted spending bills), but the August household survey showed 66,000 fewer employed than in August 2023, 609,000 more “”part-time for economic reasons,” and 531,000 more “part time for noneconomic reasons,” which implies 1.2 million fewer full-time jobs in August 2024 versus August 2023.
Then along came the big 254,000 jobs gain in the September report that made investors so giddy last week, and the household survey showed 314,000 more employed workers than in September of last year. However, digging into the numbers, there are 555,000 more “”part-time for economic reasons” and 389,000 more “part time for noneconomic reasons,” which suggests 630 million fewer full-time jobs in September 2024 versus September 2023, so it’s no surprise that the average weekly hours worked also fell. Furthermore, government spending (and the growing regulatory state) continues to account for much of the hiring as government jobs have soared by 785,000 (seasonally adjusted) over this 12-month timeframe, which was the largest month-over-month (MoM) gain on record. Also, workers holding multiple jobs hit an all-time high. And notably, native-born workers have lost 1.62 million net jobs since their peak employment in July 2023 while foreign-born workers have gained 1.69 million over the same period.
Hmmm. I continue to see the GDP and jobs growth numbers as something of a mirage in that they have been propped up by government deficit spending (which our leaders euphemistically call “investment”). As you recall, leading into the September FOMC announcement I had been pounding the table on the need for a 50-bps rate cut, which we indeed got. Many observers, and at least one Fed governor, believe it was a mistake to go so big, but as I discussed in my post last month, recessionary pressures were mounting despite the impressive headline numbers, and the pain felt by our trading partners from high US interest rates and a strong dollar essentially required some agreement among the major central banks, particularly Japan and China, to weaken the dollar and thus allow an expansion in global liquidity without inciting capital flight to the US. And the PBOC soon did exactly that—slashing its reserve requirement ratio (RRR), cutting its benchmark interest rate, and loosening scores of rules regarding mortgages and the property market—which has restrengthened the dollar after its summer decline.
Of course, cutting taxes and regulation is the best way to unleash the private sector, but it's often argued that a tax cut without a corresponding reduction in spending only serves to increase the budget deficit and add to the federal debt. In fact, I saw a Harris campaign commercial with an average guy named “Buddy” lamenting that it’s “not cool” with him that Trump would give “billionaires” a tax break because they should “pay their fair share.” But Buddy and Harris both need to know what DataTrek Research has observed—i.e., since 1960, regardless of individual and corporate tax rates, federal receipts have averaged 17% of GDP. This means that raising taxes stunts GDP growth while cutting taxes boosts GDP growth by leaving more money in the pockets of consumers, business owners, and corporations to spend and invest with the wisdom of a free and diverse marketplace (Adam Smith’s “invisible hand”). In other words, the path to rising tax revenues is through strong economic growth—and the best return on capital comes from the private sector, which has proven itself much more adept at determining the most efficient allocation of capital rather than Big Government’s top-down picking of winners and losers, like a politburo.
Nevertheless, given the Fed’s dovish pivot (and despite the “heavy hand” of our federal government), I continue to expect higher prices by year end and into 2025. Bond credit spreads remain tight (i.e., no fear of recession), and although the CBOE Volatility Index (VIX) is back above the 20 “fear threshold,” it is far from panic levels. So, I believe any “October surprise” that leads to a pre-election selloff—other than a cataclysmic “Black Swan” event—would likely be a welcome buying opportunity, in my view. But besides adding or maintaining exposure to the dominant MAG-7 titans—which provide defensive qualities (due to their disruptive innovation and wide moats) as well as long-term appreciation potential—I think other stocks may offer greater upside as the economic cycle continues its growth run and market rotation/broadening resumes.
So, my suggestions are to buy high-quality businesses at reasonable prices on any pullback, hold inflation hedges like gold and bitcoin, and be prepared to exploit any credit-related panic—both as stocks sell off (such as by buying out-of-the-money put options while VIX is low) and before they rebound (when share prices are low). Regardless, I continue to recommend high-quality, fundamentally strong stocks across all market caps that display consistent, reliable, and accelerating sales and earnings growth, positive revisions to Wall Street analysts’ consensus estimates, rising profit margins and free cash flow, solid earnings quality, and low debt burden. These are the factors Sabrient employs in selecting the growth-oriented Baker’s Dozen (our “Top 13” stocks), the value-oriented Forward Looking Value, the growth & income-oriented Dividend portfolio, and Small Cap Growth, which is an alpha-seeking alternative to a passive position in the Russell 2000.
We also use many of those factors in our SectorCast ETF ranking model. And notably, our Earnings Quality Rank (EQR) is a key factor in each of these models, and it is also licensed to the actively managed, absolute-return-oriented First Trust Long-Short ETF (FTLS).
Each of our key alpha factors and their usage within Sabrient’s Growth, Value, Dividend, and Small Cap investing strategies (which underly those aforementioned portfolios) is discussed in detail in Sabrient founder David Brown’s new book, How to Build High Performance Stock Portfolios, which is now available for pre-order on Amazon at a special pre-order price.
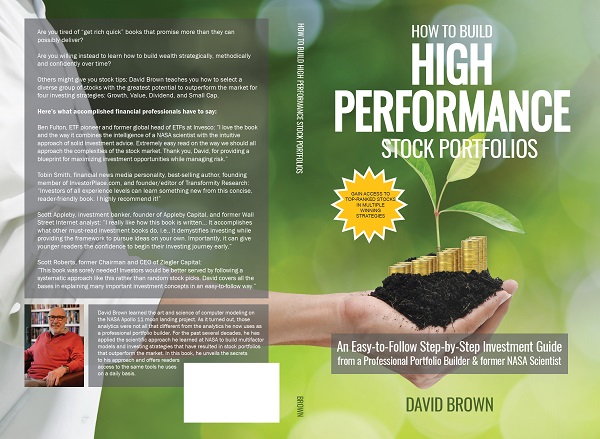
And in conjunction with David’s new book, we are also offering a subscription to our next-generation Sabrient Scorecard for Stocks, which is a downloadable spreadsheet displaying our Top 30 highest-ranked stock picks for each of those 4 investing strategies. And as a bonus, we also provide our Scorecard for ETFs that scores and ranks roughly 1,400 US-listed equity ETFs. Both Scorecards are posted weekly in Excel format and allow you to see how your stocks and ETFs rank in our system…or for identifying the top-ranked stocks and ETFs (or for weighted combinations of our alpha factors). You can learn more about both the book and the next-gen Scorecards (and download a free sample scorecard) at http://DavidBrownInvestingBook.com.
In today’s post, I discuss in greater detail the current trend in inflation, Fed monetary policy, stock valuations, technological trends, and what might lie ahead for the stock market. I also discuss Sabrient’s latest fundamental-based SectorCast quantitative rankings of the ten U.S. business sectors, current positioning of our sector rotation model, and several top-ranked ETF ideas. And be sure to check out my Final Thoughts section with a few off-topic comments on the imminent election and escalating Middle East conflict.
Click here to continue reading my full commentary online or to sign up for email delivery of this monthly market letter. Also, here is a link to this post in printable PDF format. I invite you to share it as appropriate (to the extent your compliance allows).

 by Ian Striplin
 by Rachel Annis
 by Bradley Cipriano, CPA