Scott Martindale


  by Scott Martindale
  CEO, Sabrient Systems LLC


Quick portfolio update: Sabrient’s Q3 2026 Baker’s Dozen quarterly portfolio launched on 7/20 with a diverse group of 13 stocks across market caps and business sectors, including both prominent and under-the-radar names. Also, the new Sabrient Dividend 57 quarterly portfolio just launched on 8/4 as a growth & income strategy, with a diverse group of 48 high-quality stocks across market caps and sectors and a current yield of 3.8%. Additionally, our annual Forward Looking Value 14 portfolio will launch on 8/26 with a diverse group of high-quality, value-oriented stocks having good growth potential across market caps and sectors.

Overview

There has been outsized investor focus on inflation and the Fed’s response to it—something that new chairman Kevin Warsh is trying to diminish. He has stated, "…market participants are learning to play the ball, not the referee." Warsh has suggested a preference fulfilling the mandate of price stability through a combination of lower policy rates, continued balance sheet reduction, and structural reform of the official inflation metrics (which rely on many lagged, imputed, and low-relevance components). Some observers and several FOMC members say we must have rate hikes to control the inflationary spiral, while others say we need rate cuts to boost the struggling lower leg of our K-shaped economy (lower-income and working-class consumers, small businesses, and housing) and the alarmingly low personal savings rate (2.7% versus a long-term average of 8.3%) that has been supporting personal consumption. Count me in the latter group, as I explain in my full commentary below.

But that’s not stopping the bond vigilantes from boycotting the massive issuance of debt and thus pushing up longer-term rates at an alarming pace, which negatively impacts mortgage rates, corporate borrowing costs, and the discount rate on stock valuations. Uncertainty leads to higher term premiums. It might be not only a protest against rising federal debt but also anticipation of the Fed shrinking its balance sheet (aka QT), which pulls cash (bank reserves) out of the financial system while increasing the supply of bonds in the market (leading to higher yields)—even though the Fed has already reduced its balance sheet by $2.4 trillion (from $9 trillion in 2022) to remove about half its pandemic-era QE accumulation.

As a result, 10-year Treasury yields made another new 18-month high at 4.74% at the end of July, and the 30-year reached its highest yield since 2007 of 5.27%, entirely due to rising real rates not inflation expectations (which remain modest). Although yields pulled back last week on hopeful Iran news, plunging crude oil prices, and weak jobs reports, providing hope of a less restrictive Fed. So, although longer-term yields may well rise further—with the 10-year potentially challenging 5% for the first time in three years—I see this as a buying opportunity for fixed income, such as with iShares 20+ Year Treasury ETF (TLT) with a current yield of 4.75%, particularly if inflation has seen its peak and is pulling back, as I suspect it is.

The federal deficit is now roughly $2 trillion out of a $7 trillion total budget (that’s nearly 30% of the total budget!), which must be financed through Treasury issuance. And roughly half that deficit is interest on debt payments (now exceeding $1 trillion/yr and growing fast), which rises as debt increases, requiring new issuances and debt rollovers—both at higher interest rates than before as the Treasury Dept. has focused on the short end of the yield curve, thus lowering the weighted average maturity of federal debt.

It’s a death spiral rapidly overwhelming the budget, which (as I have discussed at length in many prior posts) must be addressed with a 3-prong approach of: 1) growing away the debt through robust GDP growth given that tax receipts historically average 17% of GDP no matter the tax rates, 2) cutting away the debt through reduced spending growth below the rate of GDP growth and rooting out waste and fraud, and 3) inflating away the debt through elevated inflation rates that reduce the dollar value of the debt.

Meanwhile, the giant hyperscalers are not only spending most or all of the massive cash flows but are also flooding the corporate bond market with as much as $1 trillion for AI infrastructure buildout. So, perhaps part of Warsh’s plan is to let the market do the dirty work of suppressing economic activity by raising longer-term rates—leading to higher mortgage rates, corporate borrowing costs, and the discount rate on stocks valuations—hopefully not to the point of causing a recession.

For now, there is no sign of recession as the Atlanta Federal Reserve’s purely model-driven GDPNow forecast shows an estimate for Q3 real GDP growth of a robust +5.8% as of 8/6 (although the more nuanced consensus of “Blue Chip” economists is only 2.0%). You might recall the forecast showing strong numbers for Q2 with a high of +4.3% in late May before falling to a low of +1.2% in early July, with the final BEA report coming in at just +1.5%. Nonetheless, there was plenty of good in the report, as non-government private spending (consumers and private fixed investment) grew +3.9%.

And although this private spending was offset by 1) falling net exports (as imports surged +11.5%, driven by AI-related components), which alone reduced the final number by 1.01 percentage points (pps), and 2) private inventory drawdowns, which reduced it by 0.67 pps, both of these metrics in fact reflect robust underlying domestic demand, consumer spending, corporate capex, and overall economic activity. Indeed, when high imports and low inventories suppress GDP, it typically suggests impending economic acceleration and revved-up domestic manufacturing, which would boost GDP metrics in subsequent quarters—which the Atlanta Fed’s GDPNow forecast seems to be reflecting.

In my full commentary below, I discuss:

1. The selloff in the AI trade and the restoration of Apple’s prominence
2. Hyperscaler capex, free cash flow, and power demand
3. Solid GDP growth but mixed messages on jobs and housing
4. Trends in inflation, supply chain pressures, and productivity
5. The bond vigilantes, rising federal debt, China’s woes, and Fed policy
6. My final comments section pushing back on the overwrought AI backlash/alarmism
7. Sabrient’s sector rankings, positioning of our sector rotation model, and some top-ranked ETF ideas

With all the turmoil in the AI trade, which was overdue after such a meteoric rise, market leadership continues to broaden and rotate. The fact that the market rotated rather than sell everything and go to cash is encouraging and suggestive of continued bullish conviction. Russell 2000 companies’ earnings growth forecasts for CY2026 have climbed to 38% from about 23% at the beginning of the year—in spite of rising interest rates that tend to have outsized impact on the floating-rate debt typically carried by smaller firms. And the equal-weight S&P 500 ETF (RSP) is approaching $100 billion in AUM, with performance led by many of the “S&P 493” rather than the MAG7.

Chamath Palihapitiya, entrepreneur and All-In Podcast team member, recently quipped, “Fundraising requires narrative, and ‘we are building God’ is a better pitch than ‘we wrote some very clever linear algebra, pirated the internet, and threw a bunch of compute at it.’”  Perhaps that’s what investors reduced it to as they abandoned the AI trade—at least for the moment. And perhaps it is true that our economy has been overly reliant upon AI-led expansion with yet-to-be-proven ROI, especially datacenters.

Indeed, the dollar value of datacenter construction plus computers and communications equipment are up 23% YoY, with the hyperscalers’ capex [in order of dollar commitments: Amazon (AMZN), Microsoft (MSFT), Alphabet (GOOGL), Meta (META), Oracle (ORCL), and now SpaceX (SPCX)] projected to be in the range of $700-800 billion for CY2026 (40% higher than CY2025)—leading to reduced shareholder-friendly buybacks but surging global semiconductor sales. According to the Semiconductor Industry Association, chip sales worldwide were up +123% YoY in the month of June, totaling over $400 billion during Q2, and are expected to exceed $1.5 trillion for CY2026.

That’s a lot of investment to recover. But as Tech executive and investor Nat Friedman opined, “Pessimists sound smart. Optimists make money.” Indeed, longer term, I believe the broad potential ROI of AI—in reshaping our economy and society through massive productivity gains, solving complex scientific and technological challenges, and fundamentally transforming the workplace and daily life—is stronger and materializing faster than anticipated even at the beginning of the year.

The use cases and compute demand for AI have barely begun to manifest, with a future encompassing autonomous transportation, factory automation, humanoid robots, personal assistants for hundreds of millions of individual users, and AI assistance on everything from drones for law enforcement, to surgery and drug discovery, to optimized asset maintenance, smart grid energy, and fraud monitoring—not to mention the associated power demand for it all.

So, am I concerned about whether the massive AI capex by the hyperscalers on infrastructure (like datacenters) and power generation will see attractive ROI anytime soon? I am not. In fact, I bought into the July “tech wreck,” including some names in memory and storage as well as the MAG7 ETF (MAGS), and I bought into the “SaaSpocalypse” in February and again in April via the iShares Tech-Software ETF (IGV). In its earnings report the other day, Palantir (PLTR) described commercial demand as “otherworldly,” and the stock surged 30%. In my view, for anyone who felt they had missed the boat on the AI surge and didn’t want to chase it—this was the pullback you were waiting for.

Of course, there is no guarantee that the market won’t turn tail once again, given the unresolved conflict with Iran and its terrorist proxies and the real potential for reescalation. And besides Iran, a plethora of uncertainties persist with oil prices, shipping and supply chains, trade deals and tariffs, Ukraine, China, Japanese yen, federal debt, civil strife, midterm elections and the unnerving rise of DSA candidates, inflation, jobs, and monetary policy from a revamped Fed. Did I miss anything?

But fundamental tailwinds still outweigh headwinds, in my view, given AI optimism, robust capex, deregulation, lower taxes, re-privatization, re-industrialization (onshoring of manufacturing), diversification of supply chains (not deglobalization), rising productivity/margins/earnings, low credit spreads, and resumed disinflationary trends. Deregulation is focused heavily on encouraging domestic fossil fuel production, less burdensome financial oversight, and less onerous climate rules, mostly to the advantage of Energy, Financials, and Industrials sectors.

Forward P/E multiples have receded largely due to a rising discount rate as bond yields surge. And yet stocks keep going up on the back of incredible earnings growth and fast-rising forward estimates. According to First Trust, “Analyst estimates have increased as the year has unfolded, with Large Cap, Mid Cap, and Small Cap Index EPS estimated to reach a record $354.46, $219.63, and $107.53, respectively, in 2026 (as of 8/3/26) [according to Bloomberg]. For comparison, analyst estimates were much lower at the start of the year, with the same indices estimated to see calendar year 2026 earnings of $310.84, $202.91, and $96.06 (as of 12/31/25).”

Indeed, the S&P 500 is on pace for blended earnings growth in Q2 of 47% versus a forecast of 23% just a few weeks ago. However, if you strip out Amazon (AMZN) and Alphabet (GOOGL), whose incredible earnings reports were largely driven by non-operating gains on investments in Anthropic and SpaceX, the blended S&P 500’s blended EPS growth falls to around 29%, which is still quite impressive.

Overall, given the market broadening beyond the Big Tech titans, and assuming the Fed does not become more hawkish, I continue to see opportunities in active stock selection, as well as in cyclicals, value stocks, small caps, and bond-alternative dividend payers. Indeed, Sabrient’s Baker’s Dozen, Forward Looking Value, Small Cap Growth, and Dividend portfolios have been largely outperforming their benchmarks—some by substantial margins. And as a reminder, our Earnings Quality Rank (EQR) is licensed as a quality prescreen to the actively managed, low-beta First Trust Long-Short ETF (FTLS), which now has nearly $2.5 billion in AUM.

By the way, in my July post, I wrote a long Final Comments section on the alarming rise of socialism, which I would encourage you to read if you haven’t already. Although I acknowledge the disparate impacts of the K-shaped economy, the socialists’ harping on fairness and wealth inequality is largely a red herring as living standards, real incomes, consumption, and life expectancies have generally risen across demographics nationally. It certainly doesn’t warrant dismantling the capitalist system that has created so much innovation, value, wealth, comfort, and good for the world.

The exception to broadly rising living standards seems to lie in many of our deep-blue cities and states. So today, let me also add a comment on the “affordability” issue that has become the main talking point of the Left against the Trump Administration. The reality is that the bluest cities and states tend to have the worst affordability, as reinforced by US News & World Report’s latest 2026 rankings of states that put California dead last in its specific “Affordability” metric, followed by other deep-blue states, namely New Jersey, Hawaii, New York, Washington, Massachusetts, Maryland, and Colorado. It also put California dead last for the broader “Opportunity” category, which comprises the subcategories of Economic Opportunity, Affordability, and Equality across demographic groups.

So, don’t be gaslighted by deceptive electioneering. The answer is not to double down on the same misguided and counterproductive policies—like onerous zoning restrictions and permitting processes, punitive taxation, high energy prices, mandated worker benefits, rent control, sanctuary policies, and permissiveness on crime and homelessness—that have degraded quality of life for everyone while inviting fraud and corruption. Rather, voters should pivot back to embracing free markets, meritocracy, property rights, and the rule of law that built our great country. Such principles have proven much more adept at solving problems than dogmatic bureaucrats, virtually none of whom have any private-sector leadership experience. Affordability is a genuine problem, particularly in several high-cost blue states, and policymakers in these locales shouldn't assume that further expanding redistribution or intervention policies will solve the problems that were likely created by these policies in the first place.

Here is a link to this full post in printable PDF format. As always, I’d love to hear from you! Please feel free to email me your thoughts on this article or if you’d like me to speak on any of these topics at your event!  Read on….

Scott Martindale


  by Scott Martindale
  CEO, Sabrient Systems LLC

 Overview

Well, the FOMC followed the script and cut the fed funds rate (FFR) by 25 bps (from 4.25-4.50% range down to 4.00-4.25%) in an 18-1 vote. It was the first rate cut since December of last year—even though the rate needs to be 100 bps lower, in my view, as I have been advocating for quite some time, given the prior overreliance on government spending and hiring giving way to the growing impact of elevated rates on private sector growth and hiring, particularly within rate-sensitive industries. No more government largesse means the Fed must get busy with rate cuts. Market breadth was already improving in anticipation of the Fed’s dovish turn, with market segments like small caps, value stocks, banks, and transports perking up.

Although this was a relatively tepid move by the FOMC rather than the full-throated declaration of a new easing cycle that is needed, Fed chair Jerome Powell still believes monetary policy has officially shifted from "modestly restrictive" (his words at the July meeting) to "more neutral” today and characterized the latest rate cut as a "risk management" decision in light of slowing economic activity and jobs growth on the one hand, offset by sticky inflation on the other, which I discuss in greater depth in today’s post.

Of course, slashing FFR even 50 bps would give a panicky signal to the market, so newly appointed Fed Governor Stephen Miran was the lone dissenter, favoring 50 bps. Instead, they will proceed with gradual cuts on a steady path to eventually arrive at its long-term goal of a terminal FFR around 3.00% (2% inflation plus 1% neutral rate, aka “r-star”). The CME futures market now reflects 86% odds of two more 25-bp cuts this year (75 bps total for the year, bringing FFR down to 3.50-3.75%) and 78% odds of another two cuts next year (down to 3.00-3.25%)—as well as 50% odds of three cuts next year, despite the Fed’s own dot plot of two 25-bp cuts this year and just one in 2026. In my view, this will lead to more consumer spending, business borrowing for investment/capex, earnings growth, and stock buying (including retail, institutional, and share buybacks).

In response, the major indexes surged to new highs yet again. Any attempt at a pullback has been nothing more than an overbought technical correction/consolidation, as enthusiasm grows around the promise of AI revolutionizing our lives, workplace, and society at large, leading to rising productivity and prosperity. However, while we await the fully ripened fruits of these rapidly advancing technologies, stock gains have been driven more by multiple expansion in anticipation of great things to come, as well as a weaker dollar and surprisingly strong earnings growth—albeit driven more by cost-cutting and productivity growth than revenue growth, with net margins closing in on their 2021 peak of 13%.

Thus, lofty stock valuations and tight corporate bond spreads suggest an expectation that profitability and ROIC will remain strong for the foreseeable future despite the many storm clouds (such as geopolitical threats, ongoing hot wars, tariffs and unresolved trade negotiations, struggling global trading partners, sticky inflation metrics, weak jobs growth, social strife, and now a federal government shutdown). In fact, rather than investor fear manifesting in falling stock prices and rising market volatility, it instead seems to be reflected in the price of gold and silver, which have been surging.

Back in June, Mike Wilson of Morgan Stanley asserted, “we identified 4%-4.5% [on the 10-year yield] as the sweet spot for equity multiples, provided that growth and earnings stay on track.” Similarly, Goldman Sachs saw 4.5% acting as a ceiling for stock valuations. Wilson identified four factors that he believes would sustain market strength: 1) a trade deal with China (which China desperately needs sorted out), 2) stabilizing earnings revisions, 3) a more dovish Fed (i.e., rate cuts), and 4) the 10-year yield below 4% (without being driven by recessionary data). Indeed, all four have shown good progress.

From the 4/7 lows, retail investors flipped from tariff panic to FOMO/YOLO, and the rest of the investor world has jumped onboard. Speculative “meme” stocks have been hot, and AQR’s Quality-minus-Junk factor (aka “quality margin”) has been shrinking. Moreover, small caps have been surging, as evidenced by the Russell 2000 Small-cap Index (IWM) setting new all-time high last week (for the first time since 2021), which is a historically bullish signal, and the Russell Microcap Index (IWC) has done even better. Similarly, value stocks also have perked up, with the Invesco S&P 500 Pure Value ETF (RPV) also reaching a new high, and the transports, like the iShares Transportation ETF (IYT), seems bent on challenging its highs from last November.

The broad market was long overdue for a healthy broadening to bolster bullish conviction, and indeed it appears the ducks finally lined up to support it. This broadening bodes well for further upside as capital merely rotates rather than leave the market entirely. The Carson Group has observed that for every time since 1980 that the Fed cut rates while the market was within 2% of an all-time high (21 instances), stocks continued to rise over the ensuing 12 months. As Eric Peters of One River Asset Management opined, “There is no appetite for austerity within either party, so their preference is for inflation-resistant assets, which [suggests]…stocks, gold, bitcoin.”

Overall, there is no magic here, the setup is bullish for stocks, with improving market breadth (i.e., wider participation), as we enter Q4. But that’s not to say we won’t get a pullback in the near term. Chart technicals show a relative strength index (RSI) that has been in overbought territory for a historically long time, but I think any significant pullback would be a buyable event. So, following two solidly bullish years, I think this year also will finish strongly, with a potential third-straight 20%+ year (total return, assuming dividends reinvested) in the crosshairs. But the cautionary tale is that, while not unprecedented, a third straight 20%+ year has only happened once before in the past 100 years, during 1995-99, i.e., when it ran for five straight years during the dot-com boom (followed of course by the dot-com bust). Also, while I expect longer-duration yields (and by extension, mortgage rates) to eventually recede, be careful about jumping too aggressively into them, as elevated yields might remain sticky until federal debt and inflationary pressures have shown that they are indeed moderating, as I expect they will by early next year.

Although corporate insider buying has been weak, share buybacks have already set an annual record and are on track to hit $1.1 trillion by year end. Also, investor appetite for IPOs has returned in force, with 259 IPOs on US exchanges through Q3 2025, which is up 75% versus the same point in 2024, reflecting an abundance of both investor optimism and liquidity. And Electronic Arts (EA) is officially going private in the largest leveraged buyout (LBO) in history, at $55 billion.

Furthermore, the Atlanta Fed’s GDPNow Q3 forecast has risen to 3.8% (as of 10/1), interest rates are coming down across the curve, the US economy is holding up, corporate earnings momentum remains strong, the CBOE Volatility Index (VIX) remains low, the Global Supply Chain Pressure Index (GSCPI) remains at or below the zero line (i.e., its historical average), global liquidity and M2 growth is modest/supportive, new tax rates and deregulation from the One Big Beautiful Bill Act (OBBBA) are supportive and stimulative, exciting new technologies are accelerating, strategic reshoring and supply chain redundancies are underway (but not total deglobalization), and secular disinflationary trends and productivity growth have resumed. The only thing missing is a fed fund rate (FFR) at the neutral rate—which is around 3.0%, in my view.

However, as I discuss in my full post below, cautionary signals abound, so investors should be tactically vigilant in this environment of rising valuation multiples, overbought technicals, sluggish corporate revenue growth (with strong earnings growth based on margin expansion from productivity growth and cost-cutting), rising bankruptcies and delinquencies, and falling Leading Economic Indicators by focusing on high-quality companies and diversification (across sectors and asset classes) while holding hedges (like protective put options or inverse ETFs).

Top-ranked sectors in Sabrient’s model include Technology, Financials, Industrials, which all seem poised to benefit from stimulus and capex tailwinds. With the 10-2 and 30-2 Treasury yield spreads currently at 56 bps (4.10-3.54%) and 117 bps (4.71-3.54%) respectively—the highest since early 2022—the steepening yield curve should be favorable for regional banks, which borrow short and lend long (so a higher spread leads to higher profits). Also top-ranked in our model is Healthcare based mostly on valuation, and it indeed might be a sleeper opportunity, as (according to DataTrek Research) “US large cap Healthcare has lagged the S&P 500 by more than 4 standard deviations, a level of underperformance we’ve never seen in a major sector.” And while Energy sits at the bottom of our Outlook rankings, the sector also has earned consideration based on firmer oil prices and disciplined capital plans.

The Sabrient team focuses on fundamental quality—starting with a robust quantitative growth-at-a-reasonable-price (GARP) model followed by a detailed fundamental analysis and selection process—in selecting our Baker’s Dozen, Forward Looking Value, Dividend, and Small Cap Growth portfolios, which are packaged and distributed as UITs by First Trust Portfolios. By the way, the new Small Cap Growth (SCG 48) portfolio launches on Friday 10/3, so 10/2 is the final day to get into SCG 47, which is off to a good start, led by SSR Mining (SSRM) and Mercury Systems (MRCY) among its 44 holdings. The Q3 2025 Baker’s Dozen has also started off well, led by Sterling Infrastructure (STRL) and Valero Energy (VLO) among its 13 concentrated positions, as has our annual Forward Looking Value (FLV 13) portfolio. In fact, most of our 20 live portfolios are doing well versus their relevant benchmarks. Again, value and small caps seem like good ideas for a broadening market.

Notably, our proprietary Earnings Quality Rank (EQR) is a key factor used in our internal models, and it is also licensed to the actively managed First Trust Long-Short ETF (FTLS) as a quality prescreen. In fact, you can find our EQR score along with 8 other proprietary factor scores for roughly 4,000 US-listed stocks in our next-generation Sabrient Scorecards, which are powerful digital tools that rank stocks and ETFs using our proprietary factors. You can learn more about them by visiting: http://HighPerformanceStockPortfolios.com.

In today’s post, I discuss Fed policy, the modest inflationary pressures, the weak private sector jobs market, solid-but-fragile economic growth outlook, lofty stock valuations, and the case for value and small caps given emerging monetary and fiscal support. I also reveal Sabrient’s latest fundamental-based SectorCast quantitative rankings of the ten U.S. business sectors, current positioning of our sector rotation model, and several top-ranked ETF ideas. Click HERE to find this post in printable PDF format, as well as my latest presentation slide deck and my 3-part series on “The Future of Energy, the Lifeblood of an Economy.”

As always, please email me your thoughts on this article, and feel free to contact me about speaking on any of these topics at your event!  Read on….
Scott Martindale

  
  by Scott Martindale
  CEO, Sabrient Systems LLC
  
 Overview

As we close out H1 2025, markets seem eager to press higher on optimism about imminent fiscal stimulus and monetary policy support during H2—plus perhaps a “peace dividend” thrown in. Of course, investors at home and abroad know that President Trump will pull out all stops to demonstrate meaningful successes in raising organic economic growth and jobs creation, fostering an affordable and reliable energy supply for an electricity-hungry future, and leveraging trade negotiations to open up overseas markets while shrinking the debt/GDP and deficit/GDP ratios over the next 12 months. Otherwise, he risks a catastrophic loss in the mid-term congressional elections—which means his political opponents will be impeding him every step of the way in an effort to make that loss happen.

I had been expecting elevated volatility during H1 as the economy faced a gauntlet of challenges before surging to new highs in H2, but sanguine retail investors (with a healthy dose of FOMO) have been too eager to wait it out. Instead, they bought the April dip and never looked back, seemingly confident that my optimistic scenario would play out. And then the momentum-driven algos jumped in, followed by the institutional money. The Invesco S&P 500 High Beta ETF (SPHB) is up nearly 50% since the “Liberation Day” selloff, reflecting major risk-on behavior. Foreign capital is returning as well after a brief period of rebalancing, hedging, and “tariff paralysis.”

But, with lingering macro uncertainties and valuations seemingly “priced for perfection,” caution is warranted. Inflation and jobs metrics have been softening, in spite of what the headline numbers and MSM might suggest, as I discuss in greater depth in today’s post. The current inflation trend, as illustrated by the rolling 3-month annualized month-over-month (MoM) metrics rather than looking back 12 months to last year’s price index, shows Personal Consumption Expenditures (PCE) and Consumer Price Index (CPI) falling to just +1.08% and +1.01%, respectively. And regarding jobs growth, if you look under the hood of last week’s reports, private sector hiring has been quite weak, with the headline numbers bolstered by government hiring (at the state and local level, while federal jobs shrink) and government-supported sectors, like healthcare and education.

Of course, some of this reluctance to hire can be chalked up to the lack of clarity around trade deals, tariffs, inflation, the One Big Beautiful Bill Act (OBBBA), and Fed policy, but much of this is clearing up. For example, now that the OBBBA has been signed into law, we know the new rules on tax rates, subsidies, and incentives. Moreover, the trade deals are gradually coming to fruition. However, the FOMC might continue to lay low in “watch and wait” mode to see how the economy and inflation respond rather than cut rates, which leaves Fed policy intentions murky.

I discuss both inflation and jobs in greater depth in my full commentary below, and I again make the case that the FOMC should have a terminal/neutral fed funds rate 100 bps lower than today’s 4.33% effective rate. Bond yields have normalized with the 10-year Treasury now around 4.40%, which is back to its levels last November to flatten the yield curve, and the 2-year is around 3.90%. Both rates are signaling to the FOMC they should cut, and in fact the Fed’s own long-run estimate for the fed funds rate is 3.0%. The market needs lower interest rates in tandem with business-friendly fiscal policy, including a 5.0% 30-year mortgage rate and a weaker dollar, to support US and global economies, to allow other central banks to inject liquidity, to avert global recession and credit crisis, and to relieve indebted consumers and businesses.

As Real Investment Advice has opined, “…if interest rates drop by just 1%, this could reduce [federal] spending by $500 billion annually, helping to ease fiscal pressures, [and] the coming strategic investments, workforce development, and sustainable energy policies could improve economic outcomes while resolving deficit concerns.” I agree.

So, I believe the Fed remains behind the curve as it worries about tariffs and phantom inflation—which the FOMC sees as a lurking boogeyman, like frightened children lying wide-eyed awake in their beds at night, expecting it to pounce at any moment. But as I continually pound the table on, tariffs are actually disinflationary (in the absence of a commensurate and offsetting increase in income). And more broadly, I believe inflation has resumed its 40-year (1980-2020) secular downtrend, as I discuss in my market commentary below.

Famed investor, co-founder of PIMCO, and “Bond King” Bill Gross argues that the growing federal deficit, elevated bond supply, and a weak dollar likely will keep inflation above 2.5% and create headwinds for bonds. However, while we both like US equities (even at today’s valuations, which I discuss in greater detail below), I see the outlook for bonds differently. Now that we have some clarity on the OBBBA and the debt ceiling, foreign investors and US consumers and businesses know much more about the rules they will be playing under.

Capital tends to flow to where it is most welcome and earns its highest returns, so I think the recent tide of foreign capital flight leaving the US will reverse, helping the dollar find a bottom and perhaps strengthen a bit, which based on historical correlations would suggest higher bond prices (lower yields, despite elevated issuance in the near term) and perhaps lower gold prices. However, without the de facto boost to global liquidity of a weakening dollar, the Fed will have to step up and provide that liquidity boost, such as by lowering interest rates and implementing “stealth QE” (such as through reduced bank reserve requirements) to encourage lending and boost velocity of money (M2V), which has recently stagnated.

Most any foreign investor will tell you there is no other place in the world to invest capital for the innovation and return on shareholder capital than the US, given our entrepreneurial culture, technological leadership in disruptive innovation, strong management and focus shareholder value, low interest-rate exposure, global scalability, wide protective moats, and our reliable and consistently strong earnings growth, free cash flow, margins, and return ratios, particularly among the dominant, cash flush. So, I continue to like US equities over international equities for the longer term (other than a simple mean-reversion trade).

Hindered by its quasi-socialist policies, Europe doesn’t come close to the US in producing game-changing technologies, opportunities, and prosperity for itself and the world at large. In my view, it lacks our level of freedom, openness, dynamism, and incentive structures. And as for China’s unique “capitalism with Chinese characteristics,” although its authoritarian rule, homogenous society, and obedient culture helps ensure broad unity and focus on common goals, its system is still far inferior when it comes to freedom of thought, entrepreneurship, and innovation, in my view. Despite America’s inequalities and inadequacies, there is no better country on earth for tolerance and opportunity for economic prosperity, and we continue to grow ever more diverse and inclusive—without government programs forcing it to be so.

Moreover, it’s not just the Technology sector that is appealing to investors. As BlackRock wrote in their Q2 2025 Equity Market Outlook, “Commentators will often cite the prevalence of a large number of Tech companies in the U.S. as the driver of U.S. equity dominance. But our analysis points to wider breadth in U.S. quality. Current return on tangible invested capital (ROTIC), a proxy for a company’s ability to allocate capital for optimal profitability, is significantly higher in the U.S. than elsewhere in the world, suggesting quality exists not in pockets but across sectors.”

Indeed, rather than investing in the passive cap-weighted indexes dominated by Big Tech, investors may be better served by active stock selection that seeks to identify under-the-radar, undervalued, high-quality gems. This is what Sabrient seeks to do in our various portfolios, all of which provide exposure to Value, Quality, Growth, and Size factors and to both secular and cyclical growth trends. When I say, “high-quality company,” I mean one that displays a history of consistent, reliable, resilient, durable, and accelerating sales, earnings, and free cash flow growth, rising profit margins, a history of meeting/beating estimates, high capital efficiency and ROI, solid earnings quality, a strong balance sheet, low debt burden, competitive advantage, and a reasonable valuation compared to its peers and its own history.

These are the factors Sabrient employs in selecting our Baker’s Dozen, Forward Looking Value, Dividend, and Small Cap Growth portfolios, which are packaged and distributed as UITs by First Trust Portfolios. (By the way, the new Q3 Baker’s Dozen and Small Cap Growth portfolios are launching late next week, so these are the final several days to get into the Q2 portfolios launched in April—both of which are performing well versus their benchmarks so far.)

We also use many of those factors in our SectorCast ETF ranking model, and notably, our proprietary Earnings Quality Rank (EQR) is a key factor used in each of our portfolios, and it is also licensed to the actively managed First Trust Long-Short ETF (FTLS) as a quality prescreen. In fact, we have launched our next-generation Sabrient Scorecards, which are powerful digital tools that rank stocks and ETFs using our proprietary factors. You can learn more about them by visiting:
http://HighPerformanceStockPortfolios.com.

In my full commentary below, I discuss in greater depth the trends in inflation, jobs, GDP, and stock valuations, as well as Sabrient’s latest fundamental-based SectorCast quantitative rankings of the ten U.S. business sectors, current positioning of our sector rotation model, and several top-ranked ETF ideas. Click HERE for a link to this post in printable PDF format.

By the way, my in-depth discussion of energy and electrical power generation (that I keep teasing) will be released soon. As always, please email me your thoughts on this article, and feel free to contact me about speaking on any of these topics at your event!  Read on….

Scott Martindale

 
  by Scott Martindale
  CEO, Sabrient Systems LLC

  Overview

So much for the adage, “Sell in May and go away.” May was the best month for the stock market since November 2023 and the best month of May for the stock market in 35 years, with the S&P 500 up +6.1% and Nasdaq 100 up +9.3%. Moreover, the S&P 500 has risen more than 1,000 points (20%) from its 4/8 low and is back into positive territory YTD (and challenging the 6,000 level). History says when stocks rally so strongly off a low, the 12-month returns tend to be quite good. Even better news is that the rally has been broad-based, with the equal-weight versions of the indexes performing in line with the cap-weights, and with the advance/decline lines hitting all-time highs. An as Warren Pies of 3Fourteen Research observed on X.com, “…the S&P 500 has retraced 84% of its peak-to-trough decline. The [market] has never retraced this much of a bear market and subsequently revisited the lows. The technical evidence points, overwhelmingly, to the beginning of another leg to the bull market and new ATHs.” We certainly aren’t seeing the H1 volatility I expected, with the CBOE Volatility Index (VIX) back down to February levels. So, is this the all-clear signal for stocks? Well, let’s explore this a bit.

As Josh Brown of Ritholtz Wealth Management reminds us, “Stocks [tend to] bottom in price a full 9 months before earnings do… By the time earnings are reaching their cycle low, stocks have already been rallying for three quarters of a year in advance of that low. This is why you don’t wait to get invested or attempt to sit out the economic or earnings downturns.” Typically, the growth rates for GDP, corporate earnings, wages, and stock prices should not stray too far apart since they are all closely linked to a strong economy. And as of 6/9, the Atlanta Fed’s GDPNow model indicates an eye-popping +3.8% growth is in store for Q2 (albeit largely due to a collapse in imports following the negative Q1 print from front-running of imports, ahead of the tariffs).

And with the last administration’s last-minute surge in deficit spending wearing off, the new administration is doing quite well in bringing down inflation, starting with oil prices. Indeed, April CPI came in at +2.33% YoY and the rolling 3-month annualized CPI (a better measure of the current trend) is +1.56%. Looking ahead, the Cleveland Fed’s Inflation NowCasting model forecasts May CPI of +2.40% YoY and an annualized Q2 CPI of +1.70%, while the real-time, blockchain-based Truflation metric is +1.90% (as of 6/9). After all, disruptive innovation like AI is deflationary by increasing productivity, China’s economic woes are deflationary (cheaper goods), and tariffs are deflationary (in the absence of commensurate rise in income), so the rising GDP forecast and falling CPI numbers reflect the exact oppositive of the “stagflation” scare the MSM keeps trumpeting. I discuss inflation in greater length in today’s post below.

It all sounds quite encouraging, right? Well, not so fast. For starters, the charts look severely overbought with ominous negative divergences that could retrace a lot of gains. Moreover, with ISM manufacturing and services indexes both in contraction, with so much lingering uncertainty around trade negotiations, with President Trump’s “one big, beautiful bill” (aka OBBB) wending a treacherous path through congress, and with his ambitious drive to reverse the course and negative outcomes of decades of hyper-globalization, entitlement creep, and climate/cultural activism facing fierce resistance both at home and abroad, the coast is hardly clear.

Witness the rise in bond term premiums even as the Fed contemplates cutting its benchmark rate as foreign central banks and bond vigilantes slash demand for Treasuries (or even sell them short) due to expectations of unbridled federal debt and Treasury issuance. According to Mike Wilson of Morgan Stanley: “we identified 4%-4.5% [10-year yield] as the sweet spot for equity multiples, provided that growth and earnings stay on track.” Similarly, Goldman Sachs sees 4.5% acting as a ceiling for stock valuations—and that is precisely where the rate closed on Friday 6/6. Wilson identified four factors that he believes would sustain market strength: 1) a trade deal with China, 2) stabilizing earnings revisions, 3) a more dovish Fed (i.e., rate cuts), and 4) the 10-year yield below 4% (without being driven by recessionary data)—but there has been observable progress only in the first two.

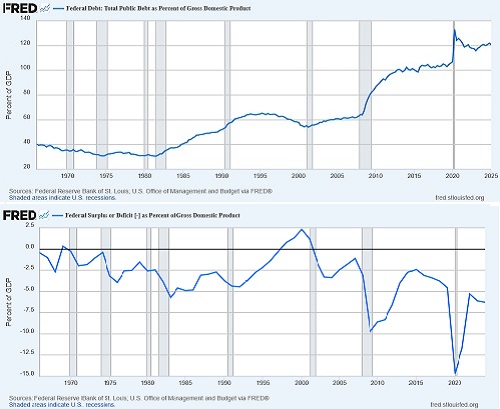
Regarding our debt & deficit death spiral, I will argue in my full commentary below that despite all the uproar, the OBBB might not need to institute harsh austerity with further cuts to entitlements (which, along with interest on the debt, amount to 73% of spending) that would mostly hurt the middle/working classes. The bill rightly repeals low-ROI tax credits and spending for boondoggles from prior bills, most notably low-transformity/low-reliability wind and solar energy projects that require government subsidies to be economically viable. But beyond that, the focus should be on lowering the debt/GDP ratio through fiscal and monetary policies that foster robust organic economic growth (the denominator) led by an unleashed private sector fueled by tax rate cuts and incentives for capital investment, deregulation, disruptive innovation, and high-transformity/high-reliability natural gas and next-generation nuclear technology. Real Investment Advice agrees, arguing that market pundits might be “too focused on the deficit amount…rather than our ability to pay for it, i.e., economic growth.”  The charts below show the debt-to-GDP ratio, which is about 120% today, alongside the federal deficit-to-GDP ratio, which is about 6.6% today. (Note that US Treasury Secretary Scott Bessent’s target of 3% deficit-to-GDP was last seen in 2016.)

Federal debt/GDP and deficit/GDP charts

Of course, nothing is all bad or all good. But Trump is shining a bright light on the devastating fallout on our national security, strategic supply chains, and middle/working classes. Changing the pace and direction of globalization, including deglobalizing some supply chains, reshoring strategic manufacturing, and focusing on low-cost energy solutions for a power-hungry world cannot occur without significant disruption. Within the US, we can have different states provide different types of industries and services depending upon their comparative advantages like natural resources, labor costs, demographics, geography, etc.—after all, we are all part of one country. But on a global scale, with some key trading partners that might be better considered rivals, or even enemies in some cases, we can’t entrust our national security to the goodwill and mutual benefit of international trade. Indeed, China has a history of not fulfilling its commitments in prior trade agreements, like reducing state subsidies overproduction (“dumping”), and IP theft, moving some manufacturing into the US, and increasing imports of US goods.

I have talked often about the 3-pronged approach of addressing our federal debt by: 1) inflating it away with slightly elevated inflation around 2.4% to erode the value of dollars owed and increase nominal GDP to reduce the debt-to-GDP ratio, 2) cutting it away with modest reductions or at least freezes on spending and entitlements, and 3) growing it away by fostering robust organic growth from a vibrant private sector with pro-cyclical fiscal and monetary policies that ultimately grows tax receipts on higher income and GDP (even at lower tax rates) and reduces the debt-to-GDP ratio. But of these three, the big “clean-up hitter” must be #3—robust growth. In fact, a key reason that the OBBB does not propose more austerity measures (i.e., spending cuts beyond waste, fraud, and the “peace dividend”) is to ensure that GDP grows faster than the debt and deficit. We can only live with slightly elevated inflation, and it is difficult to cut much spending given the dominance of mandatory spending (entitlements and interest payments) over discretionary spending. So, the primary driver must be robust private sector organic growth—and by extension an embrace of disruptive innovation and a productivity growth boom that boosts real GDP growth, keeps a lid on inflation, widens profit margins—leading to rising wages tax remittances.

As a case in point, I highly recommend a recent episode of the All-In Podcast in which the panel of four Tech billionaires (of various political persuasions) speak with Miami Mayor Francis Suarez. In 2017, Suarez took over leadership of a city that was in distress, near bankruptcy, and a murder capital of the country, and he resurrected it with three core principles for success: “keep taxes low, keep people safe, lean into innovation”—whereas he laments that most other big-city mayors prefer to do the opposite, i.e., raise taxes, tolerate crime, create suffocating regulations, and reject the offers and entreaties of billionaire entrepreneurs like Jeff Bezos (Amazon) and Elon Musk (Tesla) as overly disruptive or politically incorrect.

May inflation metrics will come out this week, and then the June FOMC meeting convenes 6/17-18. So far, the FOMC has been quite happy to just sit on its hands (while the ECB just cut for an 8th time) in the face of tariff paralysis; falling oil prices, unit labor costs, and New Tenant Rents; declining inflation and savings rates; rising delinquencies; and slowing jobs growth; instead preferring to be reactive to sudden distress rather than proactive in preventing such distress. Inflation metrics continue to pull back after being propped up by elevated energy prices, long-lag shelter costs, and the prior administration’s profligate federal deficit spending that overshadowed—and indeed created—sluggish growth in the private sector. Economist Michael Howell of CrossBorder Capital persuasively asserts that monetary policy “must prioritize liquidity over inflation concerns, so the Fed’s current hands-off, higher-for-longer, reactionary approach risks causing a liquidity crunch.”

So, I believe it’s going to be hard for Fed Chair Jay Powell to justify continuing to “wait & watch.” As of 6/9, CME Group fed funds futures show zero odds of a 25-bp rate cut this month, but increases to 17% at the July meeting, and 64% odds of at least 50 bps by year-end. I have been insisting for some time that the FFR needs to be 100 bps lower, as the US economy's headline GDP and jobs numbers were long artificially propped up by excessive, inefficient, and often unproductive federal deficit spending, while the hamstrung private sector has seen sluggish growth, and 30-year mortgage rates need to be closer to 5% to allow the housing market to function properly. But regardless of the FOMC decision this month, I expect the rate-cutting cycle to restart soon and signed trade deals to emerge with our 18 key trading partners, calming domestic and foreign investors.

I still expect new highs in stocks by year end. For now, traders might wait for a pullback and bounce from support levels, or perhaps an upside breakout beyond the 6,000 level on the S&P 500. But my suggestion to investors remains this: Don’t chase the highflyers and instead focus on high-quality businesses at reasonable prices, expect elevated volatility given the uncertainty of the new administration’s policies and impact, and be prepared to exploit any market pullbacks by accumulating those high-quality stocks in anticipation of gains by year end and beyond, fueled by the massive and relentless capital investment in blockchain and AI applications, infrastructure, and energy, leading to rising productivity, increased productive capacity (or “duplicative excess capacity,” in the words of Secretary Bessent, which would be disinflationary), and economic expansion, as I explore in greater depth in my full post below.

Rather than investing in the passive cap-weighted indexes dominated by Big Tech, investors may be better served by active stock selection that seeks to identify under-the-radar, undervalued, high-quality gems. This is what Sabrient seeks to do in our various portfolios, all of which provide exposure to Value, Quality, Growth, and Size factors and to both secular and cyclical growth trends. When I say, “high-quality company,” I mean one that is fundamentally strong, displaying a history of consistent, reliable, and accelerating sales and earnings growth, a history of meeting/beating estimates, high capital efficiency, rising profit margins and free cash flow, solid earnings quality, low debt burden, and a reasonable valuation compared to its peers and its own history. These are the factors Sabrient employs in selecting our Baker’s Dozen, Forward Looking Value, Dividend, and Small Cap Growth portfolios (which are packaged and distributed as UITs by First Trust Portfolios). We also use many of those factors in our SectorCast ETF ranking model, and notably, our proprietary Earnings Quality Rank (EQR) is a key factor used in each of our portfolios, and it is also licensed to the actively managed First Trust Long-Short ETF (FTLS) as a quality prescreen.

Sabrient founder David Brown describes these and other factors as well as his portfolio construction process in his latest book. He also describes his path from NASA scientist in the Apollo moon landing program to creating quant models for ranking stocks and building stock portfolios. And as a companion product to the book, we have launched our next-generation Sabrient Scorecards for Stocks and ETFs, which are powerful digital tools that rank stocks and ETFs using our proprietary factors. You can learn more about both the book and scorecards by visiting: http://HighPerformanceStockPortfolios.com.

Keep in mind, stock market tops rarely happen when investors are cautious, as they continue to be today. So, I continue to believe in staying invested in stocks but also in gold, gold royalty companies, Bitcoin (as an alternative store of value), and perhaps Ethereum (for its expanding use case). These not only serve as hedges against dollar debasement but as core holdings within a strategically diversified portfolio. Bitcoin’s climb back to new highs in May has been much more methodical and disciplined than its previous history of maniacal FOMO momentum surges that were always destined to retrace. This is what comes from maturity and broader institutional acceptance, characterized by “stickier” holders and strategic allocations. Notably, iShares Bitcoin Trust ETF (IBIT) had its largest-ever monthly inflow during May.

I highly encourage you to read my full commentary below. I discuss in greater depth the economic metrics, the truth about the OBBB, deglobalization, trade wars, affordable energy, economic growth, jobs, inflation, and global liquidity. I also discuss Sabrient’s latest fundamental-based SectorCast quantitative rankings of the ten U.S. business sectors, current positioning of our sector rotation model, and several top-ranked ETF ideas. Click HERE for a link to this post in printable PDF format.

By the way, rather than including my in-depth discussion of energy and electrical power generation in this post, I will be releasing it in a special report a little later this month, so please watch for it. As always, please let me know your thoughts on this article, and feel free to contact me about speaking on any of these topics at your event!  Read on….