Scott Martindale


  by Scott Martindale
  CEO, Sabrient Systems LLC


Quick note: Sabrient’s annual Forward Looking Value 14 portfolio just launched last week on 8/26 with a diverse mix of 31 stocks across 9 business sectors and a 50/50 Large/SMID-cap mix. Think of it as a less-concentrated and more value-oriented version of Baker’s Dozen. Last year’s FLV 13 terminates 11/17 and is up +38.4% vs. +19.4% for S&P 500 Value (SPYV) and +20.2% for S&P 500 (SPY) as of 9/2. I personally like the UIT structure as a diversifier for a client’s equity portfolio because they are unmanaged—while most other products are managed to some extent, even quarterly rebalanced rules-based indexes—and most active managers tend to underperform their benchmarks. Also, value stocks tend not to be as volatile, so value or dividend portfolios tend to fit well with the unmanaged, buy-and-hold-for-15-months structure.

Overview:

The US economy is changing faster than the traditional macro indicators can explain it. On the one hand, Q2 GDP (just +1.5%) and jobs growth look sluggish, inflation is sticky, debt and bond yields are surging, and the bifurcated “K-shaped” economy is causing poor consumer sentiment and public dissatisfaction—to the point that socialism(!) is gaining traction. The top 10% by net worth own 87% of stocks and 68% of total net worth, while the bottom 50% own just 1% of stocks but carry 52% of consumer debt. Consumer debt is rising while the personal savings rate remains low to support spending. Real (inflation-adjusted) consumer spending was essentially flat in July, while the personal savings rate finally edged up slightly to 3.0% in July after a steady decline from 6.4% in January 2024 to as low as 2.6% in June 2026.

On the other hand, the official Q2 GDP reading was held down by high AI-related imports and inventory drawdowns, which actually reflect robust economic activity. Private domestic demand (considered a truer signal of underlying economic health) was quite strong in Q2 at +4.2% annualized rate, consumer spending was up +3.4%, business investment excluding housing was up +8.5%. Indeed, the Atlanta Fed’s GDPNow now forecasts Q3 GDP at 4.7% (as of 9/3). Corporate profits, productivity, margins, cash flow, and capex are massive. Jobless claims in our “low-hire, low-fire” labor market are near their lowest level in decades, which Fed chairman Kevin Warsh calls "an empirically robust real-time indicator” constrained only by flattening labor supply (a lack of willing workers).

Perhaps the low personal savings rate is to be expected as Baby Boomers retire and draw down their wealth, and household debt as a percentage of disposable personal income has stopped rising in Q1-Q2. Stocks are near all-time highs even though interest rates have become punitive (compared to what the broad economy had become accustomed to), and market breadth is improving.

While these data points might seem like contradictions, they may in fact be a predictable reflection of a structural transition toward a more capital-intensive, AI-driven, productivity-led economy.

Regarding inflation and Fed policy, Warsh stated in his Jackson Hole speech, “Certain sectors—like housing and agriculture—are showing strains. But, on balance, I would be hard pressed to describe broad financial conditions as restrictive…. We must be confident that underlying inflation is moving to our objective, clearly and at sufficient speed. Otherwise, we have work to do.” But you likely heard it paraphrased as simply, “Inflation is running too hot…financial conditions are not restrictive…we have work to do,” which is clearly more hawkish than his actual statement and seemingly a fait accompli that rate hikes are imminent. Fed funds futures now imply 2+ rate hikes over the next 12 months, with 50% odds of a 25-bp hike at the upcoming FOMC meeting this month.
 
However, I humbly disagree. I think Warsh’s actual statement cleverly balanced between sounding sufficiently hawkish to appease the “bond vigilantes” while leaving himself an opening to avoid hiking rates. Most of the non-supply-shock components of inflation are relatively subdued, and by some key metrics, underlying inflation is indeed moving toward the 2% objective—for example, Warsh’s preferred Trimmed Mean PCE has held steady at +2.3% in June/July, and the real-time, blockchain-based Truflation CPI is also +2.3% (as of 9/3). Meanwhile, all is not well in this K-shaped economy. The labor market is stagnant, the lower/working class consumer and wage earner is struggling, and monetary policy is clearly restrictive in the most rate-sensitive industries and demographics.

We can’t continue to rely solely on massive AI capex and retiring Baby-Boomer spending (neither of which are particularly rate sensitive) to power our economy while watching the lower leg of the K languish. All it takes is for one hyperscaler to announce a significant reduction in capex and we’ll likely see economic growth fall—along with the stock market.

So, I continue to believe a rate cut is appropriate—certainly not a hike (as fed funds futures and Polymarket confidently predict). A hike would only further hinder those struggling cash-poor segments (many of whom are warming up to the socialist “free stuff” rhetoric) while doing little to restrain the cash-rich AI trade or resolve the event-driven supply shock. I feel alone in the woods on this, but I see the neutral rate at 3.0-3.25%. Unfortunately, such an action apparently would be quite unpopular in the bond market and thus is unlikely to happen anytime soon, thus keeping the economy bifurcated. However, in speeches this week, Fed governor Christopher Waller and NY Fed president John Williams pumped the brakes on the tightening narrative (“Give disinflation a chance”).

Kevin Warsh has suggested in the past a preference for fulfilling his mandate of price stability through a combination of: 1) a lower fed funds rate, 2) continued balance sheet reduction to constrain money supply growth (including a revised Treasury-Fed relationship that gives the Treasury more say over balance-sheet decisions), and 3) structural reform of how inflation is measured (replacing the lagged and imputed components). This approach would ensure that liquidity is cheaper to access, preventing credit markets from locking up without flooding the entire financial system with inflationary liquidity. Less Fed demand for bonds might steepen the yield curve somewhat and keep 30-year mortgage rates elevated, but a lower fed funds rate reduces rates on short-term construction loans and adjustable mortgages.

According to global liquidity expert Michael Howell of CrossBorder Capital, the “Fed does not need to cut Fed funds to loosen US monetary conditions. It can hold the policy rate steady while Treasury bill issuance, reserve management and bank balance-sheet expansion deliver the liquidity impulse. This is the essence of ‘Treasury QE’: fiscal expansion financed at the short end, supported by enough reserve liquidity to keep funding markets orderly.”

By the way, regarding the sudden tariff flare-up with Canada, our neighbor’s retaliation could have targeted industrial inputs but instead it’s notable that they only apply to food and consumer products in an (admittedly) targeted effort to pressure Republican candidates in competitive US midterm election races in swing states like Pennsylvania, Michigan, and Wisconsin, and red states like Ohio, Indiana, and Kentucky.

In my full commentary below, I discuss:

1. Broadening continues as small caps, value, and the S&P 493 carry the baton
2. High earnings vs. high yields and the impact on valuations
3. The NVIDIA juggernaut and AI Phase II: proving the economy-wide ROI
4. Materials and power constraints on the AI buildout
5. K-shaped economy, inflation, and the Fed’s policy dilemma
6. Runaway Federal debt and the need to grow our way out of it
7. Crude oil inventory drawdown and oil company windfall profits
8. My Final Comments essay: Is AI opposition a nuclear power redux?
9. Sabrient’s sector rankings, positioning of our sector rotation model, and some top-ranked ETF ideas

According to Morgan Stanley, AI’s diffusion across the global economy is a $40 trillion opportunity that will rely on affordable compute. Indeed, there is so much demand for compute, some say it is becoming a new asset class—like stocks, bonds, commodities, real estate, private credit, crypto, collectibles, royalties, cash-flowing private businesses, or carbon credits. Pending regulatory review, CME Group and Silicon Data have announced plans to launch futures contracts on compute by tracking daily and hourly on-demand GPU rental cost indexes for NVIDIA's H100 and next-gen Blackwell B200 chips. This allows a company reliant on AI to lock in a future price and ensure delivery from a new datacenter that takes 2-3 years to build.

Some are worried about falling token prices hurting the projected ROI on capex. But at the Google I/O 2026 Conference, CEO Sundar Pichai said that AI is using 3.2 quadrillion tokens per month, which is up 7x YoY. Indeed, rapidly falling inference costs can create demand that didn’t exist at previous prices. This is largely due to Jevons Paradox, which says efficiency gains lower production cost, which gets passed on to customers, thus driving up demand, which increases total resource usage over time—i.e., demand for a product or resource rises as price falls (aka demand elasticity). So, if the hyperscaler can produce and sell compute tokens cheaper, usage surges, and the hyperscaler makes more money overall. It seems this trend can only be disrupted by misguided (or deliberately subversive) politicians hell-bent on obstructing this broad, multi-layered, truly all-in, capital-investment cycle, as I discuss further in my Final Comments essay below.

This is just one of the many reasons I expect to see, through the end of this decade and likely beyond, smaller government and less low-ROI government spending in favor of more high-ROI capital allocation from an unleashed private sector as the primary engine of organic economic growth through fiscal support like favorable tax policy, deregulation, and other supply-side incentives for reshoring/onshoring to increase productive capacity.

As such, I still think the S&P 500 could reach 8,000 by year end. However, I also think a further market pullback this month is likely, perhaps to test support at the 50-day moving average, and as a reminder, September is the only month since 1975 in which the S&P 500 has averaged a net loss (-0.8%). But assuming continued healthy market broadening beyond the Big Tech titans, and praying the Fed does not start tightening, I continue to see opportunities in active stock selection, equal-weight indexes, value stocks, cyclical sectors, small caps, and bond-alternative dividend payers. I also continue to believe the Healthcare sector, which finally came alive this year, offers tremendous growth opportunities as it leverages AI. Sector earnings for Healthcare Select SPDR (XLV) are projected to rise by 22% YoY in 2027, which is second only to Technology.

Sabrient’s quant-based, actively selected (“quantamental”) Baker’s Dozen, Forward Looking Value, Dividend, and Small Cap Growth portfolios have been largely outperforming their benchmarks—several by substantial margins. And as a reminder, our Earnings Quality Rank (EQR) is licensed as a quality prescreen to the actively managed, low-beta First Trust Long-Short ETF (FTLS), which now has more than $2.5 billion in AUM.

Here is a link to this full post in printable PDF format. As always, I’d love to hear from you! Please feel free to email me your thoughts on this article or if you’d like me to speak on any of these topics at your event.  Read on….

Scott Martindale

 
  by Scott Martindale
  CEO, Sabrient Systems LLC


Quick note 1: Sabrient’s new Dividend 56 Portfolio just launched on 5/6 as a 24-month portfolio holding 46 dividend-paying stocks across a range of market caps and sectors. It employs a Growth & Income strategy, offering a bond-like current dividend yield of 3.36% while seeking capital appreciation potential. Notably, the next-to-terminate Dividend 48 ends on 5/22 and currently shows a gross total return of +55% vs. +26% for S&P 500 High Dividend ETF (SPYD) and +44% for S&P 500 (SPY), as of 5/15.

Quick note 2: Sabrient employs a variety of fundamental financial factors in our quantitative models and portfolio selection process. Sabrient Scorecards for Stocks and ETFs are investor tools that provide access to several of our proprietary models for idea generation and portfolio monitoring. I invite you as well to visit https://MoonRocksToPowerStocks.com to immediately download founder David Brown’s latest book (an Amazon international bestseller) and 2 bonus reports (on investing in the Future of Energy and Space Exploration)—all in PDF format.

Overview

The market has been in parabolic mode—and it’s all about earnings, pricing power, and ROI (current and forward) rather than multiple expansion (or hope and prayers). As Bespoke Investment Group observed last week, following a 70% gain just since 3/31 the PHLX Semiconductor Index (SOX) was trading 36% above its 50-day moving average for only the third time in the past 30 years, with the other two occurring during the dot-com bubble. Moreover, the Nasdaq 100 (QQQ) was trading 15% above its 50-day moving average for the first time since 2009 (coming out of the GFC). However, today’s enthusiasm differs from prior speculative technology cycles in several ways. For instance, revenue growth tied to AI infrastructure has been tangible and substantial, particularly with datacenter businesses that fulfill the insatiable compute demand by housing high-density servers, GPUs, and networking equipment that act as the infrastructure backbone for cloud computing and AI training workloads. In other words, the rally is not being driven solely by narrative momentum like the dot-com boom—it is also driven by accelerating revenue generation and real cash flow and earnings.

Indeed, Q1 corporate earnings season has been particularly strong, beating even the most optimistic forecasts and providing big increases in forward guidance. Approximately 84% of S&P 500 companies have exceeded analyst profit expectations, representing the highest beat rate since 2021, according to FactSet. Large-cap companies, especially within Technology and Communications Services, continue to demonstrate operating leverage and strong margin resilience despite elevated interest rates and lingering inflationary pressures. According to DataTrek, “US Big Tech (ex-Nvidia) generated $183.4 bn in cash flow in Q1 2026 and spent $183.7 bn on CapEx and strategic investments….” We are entering a productivity boom, which is driving an historic earnings boom. Forward estimates are growing faster than they did in the mid-90s or late dot-com bubble years—and without having economic recovery comps to artificially boost them.

FactSet data shows that for Q1, with 89% of companies having reported, the S&P 500 in aggregate is showing a YoY earnings growth rate of +27.7% (the highest since +32.0% in Q4 2021). The sectors seeing the biggest increases are Information Technology (+50.7%); Communication Services (+48.8%); and Materials (+43.2%), while Healthcare trails with a negative growth rate of -3.1% (the only one negative). As for revenue growth, the aggregate is +11.4% YoY (the highest since +13.9% in Q2 2022), led by InfoTech at +29.2% and Comm Services at +15.0%. Moreover, analysts have increased their S&P 500 earnings estimate for CY2026 to $333.25—implying a P/E of 22.2x based on the closing price on 5/15. Thus the CY2026 EPS forecast suggests +21.3% YoY growth over CY2025 (vs. +17.1% expected as of 3/31, before the latest reports and guidance came out), and Tech is now indicating +38.7% YoY EPS growth (vs. +23.4% expected on 3/31).

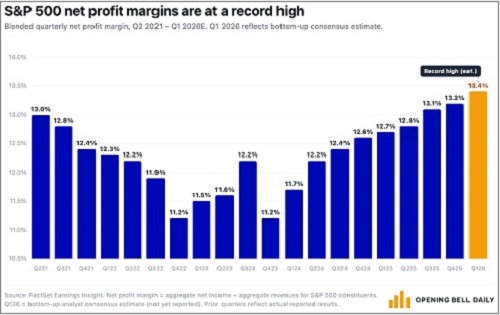
Furthermore, according to FactSet, Q1 2026 net profit margin for the S&P 500 (aggregated bottom-up) is tracking toward a record high (since data began publication in 2009) of 13.9% vs. the 5-year average of 12.3%, as illustrated in the chart below from Phil Rosen of Open Bell Daily. Notably, 6 of the 11 sectors are tracking above their 5-year average. And looking ahead, net margin is expected to climb to 14.6% by Q3. According to DataTrek Research, ““Earnings growth drives the narrative around price/earnings ratios, but it is trends in structural profitability that actually change investors' perceptions of underlying value…. Index valuations are increasing as a result, a natural if underappreciated outcome related to these improvements…and supports the argument for a ‘recession proof’ US economy.”

Net profit margins history chart

The Buffett Indicator (total US stock market cap divided by GDP) has reached 230% of GDP, far beyond even the 2000 dot-com bubble. And yet because of extraordinary earnings reports and optimistic forward guidance, P/E multiples are actually falling. For example, the next-12-months forward P/E for the Technology Select Sector SPDR (XLK) is 27.6x, down from its peak above 31 last October. Meanwhile, the S&P 500 trades at only 22.0x, down from 23.5x in October.

As for inflation and interest rates, I continue to believe the Fed is missing the mark and should be more accommodative. Incoming Fed chair Kevin Warsh will confront an FOMC that largely believes monetary policy should be tighter, with higher fed funds rate in the face of rising inflation readings. However, as I explain in my full commentary below, the latest inflationary surge is an event-driven supply shock—i.e., supply chain disruptions in the Strait of Hormuz and the resulting oil price spike (illustrated by the surging Global Supply Chain Pressure Index)—rather than structural (i.e., an overheated economy and excess consumer demand), many interest-rate-sensitive segments of the economy are still struggling. I believe that the fed funds rate should be 3.0% and that the 10-year Treasury note yield will eventually retreat back down to around 4.0%.

In my full commentary below, I discuss stock patterns and valuations, the AI-driven earnings boom, the 4-layer AI “stack” and its major players, GDP, productivity, inflation, liquidity, and Fed policy. And in my Final Comments section I discuss why the Iran oil supply shock is a reason to better diversify oil supply routes and pursue nuclear energy—not give license to ramp up solar, wind, and batteries. Then I close with my usual update on Sabrient’s sector rankings, positioning of our sector rotation model, and some top-ranked ETF ideas.

Despite narrow market breadth, Big Tech remains a must-own for its amazing growth and safe haven sentiment among investors. Still, 2026 should continue to be a good year for active stock selection, small caps, and bond-alternative dividend payers (particularly since the dividend yield on the S&P 500 is down to just 1.03%). Indeed, Sabrient’s Baker’s Dozen, Forward Looking Value, Small Cap Growth, and Dividend portfolios have been largely outperforming their benchmarks. Each is packaged and distributed as a unit investment trust (UIT) by First Trust Portfolios (https://ftportfolios.com).

By the way, our new Q2 2026 Baker’s Dozen Portfolio just launched on 4/17 as a 15-month portfolio with a mid-cap bias and a diverse group of 13 stocks across 8 business sectors (InfoTech, Financials, Industrials, Healthcare, Consumer, Comm Services, Energy, and Materials). Notably, last year’s Q1 2025 Baker’s Dozen terminated on 4/20 with a gross total return of +46.7% (vs. +20.3% for SPY), and the next-to-terminate Q2 2025 portfolio is up +56% vs +42% for SPY (as of 5/15). And, as a reminder, our Earnings Quality Rank (EQR) is licensed to the actively managed, low-beta First Trust Long-Short ETF (FTLS) as a quality prescreen. It has over $2.3 billion in AUM.

Sabrient’s models and selection process seek high-quality companies with strong growth trends and expectations. Specifically, it identifies stocks that are fundamentally strong with a history of consistent, reliable, resilient, durable, and accelerating sales and earnings growth, positive revisions to Wall Street analysts’ consensus estimates, a history of meeting/beating estimates, rising profit margins and free cash flow, high capital efficiency (e.g., ROI), solid earnings quality and conservative accounting practices, a strong balance sheet, low debt burden, competitive advantage, a wide moat, and a reasonable valuation compared to its peers and its own history.

These are the factors Sabrient employs in our quantitative models and “quantamental” portfolio selection process. You can learn how to access several of our proprietary models for idea generation and portfolio monitoring through Sabrient Scorecards, as well as download Sabrient founder David Brown’s latest book (an Amazon international bestseller), by visiting this link: Moon Rocks to Power Stocks

Here is a link to this post in printable PDF format, where you also can find my latest Baker’s Dozen presentation slide deck. As always, I’d love to hear from you! Please feel free to email me your thoughts on this article or if you’d like me to speak on any of these topics at your event!  Read on….

Scott Martindale


  by Scott Martindale
  CEO, Sabrient Systems LLC


Quick note 1: Sabrient’s new Q2 2026 Baker’s Dozen Portfolio just launched last Friday 4/17 as a 15-month portfolio with a mid-cap bias and a diverse group of 13 stocks across 8 business sectors, including several under-the-radar names. Notably, last year’s Q1 2025 Baker’s Dozen just terminated on 4/20 with a gross total return of +46.7% (vs. +20.3% for SPY).

Quick note 2: I invite you to visit https://MoonRocksToPowerStocks.com to learn more about Sabrient founder and former NASA engineer David Brown’s new book (an Amazon international bestseller) that details the fundamental factors underlying Sabrient’s models. Immediately download the book and 2 bonus reports (on investing in the Future of Energy and Space Exploration), plus a detailed report on the new Q2 2026 Sabrient Baker’s Dozen (all in PDF format) and learn how to access Sabrient Scorecards, an investor tool that provides access to our proprietary scores to make the stock evaluation process easy for idea generation and portfolio monitoring.

Overview

It didn’t take long for stocks to surge back to new all-time highs. Despite some commentators asserting that $100/bbl oil is here to stay given the damage wrought on energy infrastructure and supply chains, investors were unphased. The S&P 500 quickly reclaimed both its 50- and 200-day moving averages simultaneously (before the dreaded “death cross” could occur) in an historic run, and then continued to surge to new highs in response to Iran resolution optimism, earnings season confidence, resurgent zeal for the Tech/AI/blockchain Supercycle, falling bond yields, and a weaker US dollar, as safe haven capital rotated back into risk assets. Just a few weeks ago, I wrote in my 3/31 post that the S&P 500 had closed below its 200-day moving average for eight straight sessions and was struggling to hold support at the 300-day moving average, but that the selling seemed near exhaustion and ready for at least a bounce to fill gaps in the chart. Well, it got a lot more than a bounce.

Big Tech led the April surge. Bloomberg pointed out that over half of the S&P 500’s gain can be attributed to these seven companies—NVIDIA, Amazon, Microsoft, Broadcom, Alphabet, Meta Platforms, and Apple, which gained a combined $4 trillion in market cap. The rally commenced on 3/31 even as oil prices were still rising (to nearly $120/bbl on 4/7). This divergence is similar to what it did in 1990, which marked a low for equities at the time. But then on 4/8, crude oil fell suddenly and sharply, ultimately falling to near $80/bbl last Friday on ceasefires and news of that a peace agreement might be nigh along with a reopening of the Strait of Hormuz. (However, investors must keep in mind that we are still dealing with a fanatical, apocalyptic theocracy that is neither rational nor trustworthy…and indeed we can’t be sure if there is a true central governing body with whom to make a lasting deal.)

According to Bespoke Investment Group (BIG), since 1928, this is the first time the S&P 500 has reached a new all-time high within 11 days of a 5-10% pullback. In the midst of this historic rally, DataTrek noted, “Will the S&P 500 need to retest its March 30th lows, or was that a classic ‘V bottom’? History shows stocks don’t need to retest if investors are sure that policy has changed enough to address the causes of prior declines. We believe that is the case now and remain positive on global/US stocks.” Indeed, last week for the first time ever, the S&P 500 closed above 7,000 and Nasdaq above 24,000, while the Dow is eyeing 50,000 once again—and this bull market is now approaching 1,300 calendar days since its last 20% peak-to-trough correction (which ended on 10/11/2022).

Furthermore, the CBOE Volatility (VIX) Index is solidly back below 20 (the “fear threshold”), and the 10-year Treasury yield has pulled back to 4.25%. Notably, credit spreads are subdued, with high-yield plummeting from a peak of 3.46 pps on 3/30 to just 2.83 today. The credit market is highly sophisticated and historically a better predictor of economic distress than equities, so the current tightening in spreads suggests that despite high oil price and lingering uncertainty about direction, institutional fixed income investors are not pricing in rising default risk.

However, the market is surely not off to the races from here, in my view. The charts are extremely overbought, there has been narrow Tech leadership during this recent surge, and traders have taken on additional leverage. So, stock will likely pause to at least consolidate gains and more likely pull back to test bullish conviction at key support levels.

Nevertheless, I think the overall outlook for 2026 remains bright. Yes, the ongoing Iran conflict has created vast uncertainties and severe impacts on energy and supply chains—and by extension, inflation. But don’t forget, as we entered Q1 earnings season, corporate earnings expectations continued to be revised higher—now expected to be around 13% YoY for the S&P 500 in Q1 and 17% for full-year 2026—fueled by massive capex in AI, blockchain, energy, and re-industrialization/reshoring of factories and power infrastructure, leading to rising productivity, increased productive capacity, a resumption in disinflationary trends, and economic expansion.

In addition, the One Big Beautifull Bill Act (OBBA) has fully kicked in with its tax reform, deregulation, pro-energy policies, and broad support for the private sector to retake its rightful place as the primary engine of growth (with more efficient capital allocation and ROI than government). Federal government staffing is shrinking, helping to contract the budget deficit, along with tariff revenue, fraud identification/reduction (especially in big-ticket line items like Medicare/Medicaid). And don’t forget the enthusiasm for this year’s IPO market, with names like SpaceX/xAI, OpenAI (ChatGPT), and Anthropic (Claude) expected to soon go public. In February, Anthropic closed a $30 billion funding round at a $380 billion valuation, backed by Alphabet, Amazon, Microsoft, and NVIDIA. SpaceX seems to be targeting a June listing at a valuation of at least $1.75 trillion. No doubt, the US continues to be the world’s leading economic growth engine.

As the WSJ noted last week, “Oil prices have retreated. Wall Street banks just posted blockbuster earnings. And CEOs are touting the strength of the US economy. That combination has stocks back on the brink of records and some investors thinking a strong earnings season could power them even higher.” And as Barclays sees it, “There is a wall of worry—but it’s worth climbing.”

Regardless, the Iran conflict and seesaw of shipping blockades has laid bare the risks to the global economy of overreliance on supplies of critical energy and petrochemical supplies from a volatile part of the world and a very narrow waterway/chokepoint that has been long at the mercy of a terrorist regime. Facing down this systemic threat had to happen before Iran’s military capabilities—supported by China and Russia—reached the point of no return, in which the fallout of confrontation could be catastrophic. But also, the need for more diversified petroleum and petrochemical supply chains is no longer a mere discussion point.

Looking ahead, the Atlanta Fed GDPNow forecasts only +1.3% for Q1 2026, but it can change quickly with new data points. The jobs market remains in a lackluster “no hire, no fire” mode, with falling job openings, fewer opportunities for new college grads, and wage growth that has not kept up with price increases, as real (inflation-adjusted) hourly earnings declined -0.6% in March and have risen only +0.3% over the past year. As the Fed put it in their Beige Book, labor demand is “stable, with low turnover, minimal layoffs, and hiring mostly for replacement.” So, jobs growth is slowing and wage growth is decelerating. Overall, I continue to believe the overall economic picture suggests room for another Fed rate cut—but certainly not a rate hike, as some inflation hawks still suggest—and I still think today’s fed funds rate should be 3.0%.

The topics covered in today’s post are eclectic. I discuss stock patterns and valuations, the economy, inflation, debt, liquidity, and Fed policy, and in my Final Comments section I touch on more esoteric topics like lessons learned from the Iran conflict, supply chains, reverse lightering of oil tankers…and even some passages from Catechism. Then I close with my usual update on Sabrient’s sector rankings, positioning of our sector rotation model, and some top-ranked ETF ideas.

I expect stock market performance to be more dependent upon robust earnings growth and ROI—rather than AI hope-driven multiple expansion. Regardless, rather than the broad passive indexes (which are dominated by growth stocks, Big Tech, and the AI hyperscalers), I think 2026 should continue to be a good year for active stock selection, small caps, and bond-alternative dividend payers—which bodes well for Sabrient’s Baker’s Dozen, Forward Looking Value, Small Cap Growth, and Dividend portfolios, which are packaged and distributed as unit investment trusts (UITs) by First Trust Portfolios.

By the way, our new Q2 2026 Baker’s Dozen Portfolio just launched last Friday 4/17 as a 15-month portfolio with a mid-cap bias and a diverse group of 13 stocks across 8 business sectors (InfoTech, Financials, Industrials, Healthcare, Consumer, Comm Services, Energy, and Materials), including familiar names like Taiwan Semi (TSM) and Cheniere Energy (LNG), but also under-the-radar names like machinery maker Allison Transmission (ALSN) and engineering & construction firm Dycom Industries (DY). Notably, last year’s Q1 2025 Baker’s Dozen just terminated on 4/20 with a gross total return of +46.7% (vs. +20.3% for SPY), led by infrastructure engineering & construction firm Comfort Systems USA (FIX), oil & gas equipment and services firm TechnipFMC (FTI), and chipmaker Advanced Micro Devices (AMD).

Also, small caps and high-dividend payers tend to benefit from market rotation—which should resume as the war comes to a (hopefully swift) resolution, so Sabrient’s quarterly Small Cap Growth and Dividend portfolios might be timely investments. And, as a reminder, our Earnings Quality Rank (EQR) is licensed to the actively managed, low-beta First Trust Long-Short ETF (FTLS) as a quality prescreen (Note: FTLS never lost support at its 200-day moving average during the March selloff).

I have been encouraging investors throughout this global turmoil to exploit market pullbacks by accumulating high-quality stocks as they rebound. By “high quality,” I mean fundamentally strong, displaying a history of consistent, reliable, resilient, durable, and accelerating sales and earnings growth, positive revisions to Wall Street analysts’ consensus estimates, a history of meeting/beating estimates, rising profit margins and free cash flow, high capital efficiency (e.g., ROI), solid earnings quality and conservative accounting practices, a strong balance sheet, low debt burden, competitive advantage, a wide moat, and a reasonable valuation compared to its peers and its own history.

These are the factors Sabrient employs in our quantitative models and “quantamental” portfolio selection process. You can learn how to access several of our proprietary models for idea generation and portfolio monitoring through Sabrient Scorecards, as well as download Sabrient founder David Brown’s latest book (an Amazon international bestseller), by visiting this link: Moon Rocks to Power Stocks

Here is a link to this post in printable PDF format, where you also can find my latest Baker’s Dozen presentation slide deck. As always, I’d love to hear from you! Please feel free to email me your thoughts on this article or if you’d like me to speak on any of these topics at your event!  Read on….
Scott Martindale  by Scott Martindale
  President & CEO, Sabrient Systems LLC

Falling inflation, weak manufacturing activity, cautious consumer sentiment, and sluggish GDP and jobs growth have conspired to elicit a dovish tone from the Federal Reserve and the likely start of a rate cut cycle to avert recession and more jobs losses. I continue to pound the table that the Fed is behind the curve and should have begun to cut at the July meeting.

Why? Well, here are my key reasons:

1. Although official inflation metrics still reflect lingering “stickiness” in consumer prices, my research suggests that real-time inflation is already well below the Fed’s 2% target, as I discuss in detail in today’s post.

2. Last week’s BLS jobs report shows 66,000 fewer employed workers in August 2024 versus 12 months ago after massive downward revisions to prior reports. And if you dig deeper into the August household survey it gets worse, indicating a whopping 1.2 million fewer full-time jobs (yikes!), partially offset by a big growth in part-time jobs.

3. The mirage of modest GDP and jobs growth has been temporarily propped up by unhealthy and inefficient government deficit spending (euphemistically called “investment”) rather than true and sustainable organic growth from a vibrant private sector that is adept at efficient capital allocation. Thus, despite government efforts to “buy” growth, recessionary signals are growing at home and abroad.

4. The burden caused by elevated real interest rates on surging debt across government, business, consumers at home and emerging markets abroad, and the impact of tight monetary policy and a relatively strong dollar on our trading partners must be confronted.

So, a 50-bps cut at the September FOMC meeting next week seems warranted—even if it spooks the markets. As Chicago Fed president Austan Goolsbee said, “You only want to stay this restrictive for as long as you have to, and this doesn’t look like an overheating economy to me.”

A terminal fed funds neutral rate of 3.0-3.5% seems appropriate, in my view, which is roughly 200 bps below the current range of 5.25-5.50%). Fortunately, today’s lofty rate means the Fed has plenty of potential rate cuts in its holster to support the economy while remaining relatively restrictive in its inflation fight. And as long as the trend in global liquidity is upward (which it is once again), then it seems the risk of a major market crash is low.

Regarding the stock market, as the Magnificent Seven (MAG-7) mega-cap Tech stocks continue to flounder, markets have displayed some resilience since the cap-weighted S&P 500 and Nasdaq 100 both topped in mid-July, with investors finding opportunities in neglected market segments like financials, healthcare, industrials, and defensive/higher-dividend sectors utilities, real estate, telecom, and staples—as well as gold (as both a store of value and protection from disaster). However, economic weakness, “toppy” charts, and seasonality (especially in this highly consequential election year) all suggest more volatility and downside ahead into October.

Of course, August was tumultuous, starting with the worst one-day selloff since the March 2020 pandemic lockdown followed by a moon-shot recovery back to the highs for the S&P 500 (SPY) and S&P 400 MidCap (MDY), while the Dow Jones Industrials (DIA) surged to a new high. However, the Nasdaq 100 (QQQ) and Russell 2000 SmallCap (IWM) only partially retraced their losses. And as I said in my August post, despite the historic spike in the CBOE Volatility Index (VIX), it didn’t seem like the selloff was sufficient to shake out all the weak investors and form a solid foundation for a bullish rise into year end. I said that I expected more downside in stocks and testing of support before a tradeable bottom was formed, especially given uncertainty in what the FOMC will do on 9/18 and what the elections have in store.

In addition, September is historically the worst month for stocks, and October has had its fair share of selloffs (particularly in presidential election years). And although the extraordinary spike in fear and “blood in the streets” in early August was fleeting, the quick bounce was not convincing. The monthly charts remain quite extended (“overbought”) and are starting to roll over after August’s bearish “hanging man” candlestick—much like last summer. In fact, as I discussed in my post last month, the daily price pattern for the S&P 500 in 2024 seems to be following 2023 to a T, which suggests the weakness (like last year) could last into October before streaking higher into year end. Anxiety around a highly consequential election on 11/5 (with counting of mail-in ballots likely to last several days beyond that once again) will surely create volatility.

Many commentators believe the Fed is making a policy mistake, but it goes both ways. Some believe the Fed is turning dovish too quickly because inflation is sticky, the jobs market is fine, and GDP is holding up well, so it risks reigniting inflation. Others (like me) think the FOMC is reacting too slowly because the economy, jobs growth, and inflation are weaker than the mirage they seem, masked by inordinate government deficit spending, misleading headline metrics, and political narratives. As Fed Chair Jerome Powell said at the July meeting, “The downside risks to the employment mandate are now real,” and yet the FOMC still chose to hold off on a rate cut. Now it finds itself having to commence an easing cycle with the unwanted urgency of staving off recession rather than a more comfortable “normalization” objective within a sound economy.

Indeed, now that we are past Labor Day, it appears the “adults” are back in the trading room. As I discuss in detail in today’s post, economic metrics seem to be unraveling fast, stocks are selling off, and bonds are getting bought—with the 2-10 yield curve now “un-inverted” (10-year yield exceeds the 2-year). So, let’s get moving on rate normalization. After all, adjusting the interest rate doesn’t flip a switch on economic growth and jobs creation. It takes time for lower rates and rising liquidity to percolate and reverse downward trends, just as it took several months for higher rates and stagnant liquidity to noticeably suppress inflation. Fed funds futures today put the odds of a 50-bps cut at about 27%.

Nevertheless, stock prices are always forward-looking and speculative with respect to expectations of economic growth, corporate earnings, and interest rates, so prices will begin to recover before the data shows a broad economic recovery is underway. I continue to foresee higher prices by year end and into 2025. Moreover, I see current market weakness setting up a buying opportunity, perhaps in October. But rather than rushing back into the MAG-7 stocks exclusively, I think other stocks offer greater upside. I would suggest targeting high-quality, fundamentally strong stocks across all market caps that display consistent, reliable, and accelerating sales and earnings growth, positive revisions to Wall Street analysts’ consensus estimates, rising profit margins and free cash flow, solid earnings quality, and low debt burden. These are the factors Sabrient employs in selecting the growth-oriented Baker’s Dozen (our “Top 13” stocks), the value-oriented Forward Looking Value, the growth & income-oriented Dividend portfolio, and Small Cap Growth, which is an alpha-seeking alternative to a passive position in the Russell 2000.

We also use many of those factors in our SectorCast ETF ranking model. And notably, our Earnings Quality Rank (EQR) is a key factor in each of these models, and it is also licensed to the actively managed, absolute-return-oriented First Trust Long-Short ETF (FTLS) as an initial screen. Each of our alpha factors and their usage within Sabrient’s Growth, Value, Dividend, and Small Cap investing strategies is discussed in detail in Sabrient founder David Brown’s new book, How to Build High Performance Stock Portfolios, which will be published shortly.

In today’s post, I discuss in greater detail the current trend in inflation, Fed monetary policy, and what might lie ahead for the stock market as we close out a tumultuous Q3. I also discuss Sabrient’s latest fundamental-based SectorCast quantitative rankings of the ten U.S. business sectors, current positioning of our sector rotation model, and several top-ranked ETF ideas. And be sure to check out my Final Thoughts section with some political comments—here’s a teaser: Democrats have held the presidency for 12 of the past 16 years since we emerged from the Financial Crisis, so all these problems with the economy, inflation, immigration, and global conflict they promise to “fix” are theirs to own.

Click here to continue reading my full commentary online or to sign up for email delivery of this monthly market letter. And here is a link to it in printable PDF format. I invite you to share it as appropriate (to the extent your compliance allows).

Scott Martindale  by Scott Martindale
  President & CEO, Sabrient Systems LLC

The year began with the market showing resilience in the face of the Fed’s rate hikes, balance sheet contraction, hawkish rhetoric, and willingness to inflict further economic pain, including a recession and rising unemployment (if that’s what it takes). Of course, we also had a treacherous geopolitical landscape of escalating aggression by Russia in Ukraine, by China (regarding both Ukraine and Taiwan), and North Korea (persistent rocket launches and saber-rattling). But really, the direction for stocks came down to the trend in inflation and the Fed’s response—and the latest readings on CPI and especially PPI are quite encouraging. But alas, it now appears it isn’t quite that simple, as we have a burgeoning banking crisis to throw another monkey wrench into the mix. As Roseanne Roseannadanna used to say in the early Saturday Night Live sketches, "It just goes to show you, it's always something—if it ain't one thing, it's another."

I warned in my January post that 1H 2023 would be volatile as investors searched for clarity amid a fog of macro uncertainties. And I often opine that the Fed can’t rapidly raise rates on a heavily leveraged economy—which was incentivized by ZIRP and massive money supply growth to speculate for higher returns—without fallout (aka “breaking something”). Besides impacts like exporting inflation and societal turmoil to our trading partners, the rapid pace of rate hikes has quickly lowered the value of bank reserves (as bond prices fell). Last week this in turn led to massive portfolio losses and a federal takeover for SVB Financial (SIVB) which caters to California’s start-up and technology community, as it was pushed into selling reserves to meet an onslaught of customer withdrawals. The normally stable 2-year T-Note spiked, crashing its yield by over 100 bps in just a few days. Other regional banks have required rescue or support as well, including stalwarts like Signature Bank (SBNY) and First Republic (FRC)…and then scandal-prone European behemoth Credit Suisse (CS) revealed “material weaknesses” in its accounting…and Moody’s cut its outlook on US banks from stable to negative. So, something indeed broke in the financial system.

Fortunately, inflation fears were somewhat assuaged this week, as all reports showed trends that the Fed (and investors) hoped to see. February CPI registered 6.0%, which is the lowest reading since September 2021. Despite the historical observation that a CPI above 5% has never come back down to a desirable level without the fed funds rate exceeding CPI, we already have seen CPI fall substantially from 9.1% last June without fed funds even cracking the 5% handle, much less 6%—and CPI is a lagging indicator. So, given the 12 encouraging signs I describe in my full post below, I believe the writing is on the wall, so to speak, for a continued inflation downtrend.

So, the question is, will the Fed feel it must follow-through on its hawkish inflation-busting jawboning at the FOMC meeting next week to force the economy into recession? Or will recovering supply chains (including manufacturing, transportation, logistics, energy, labor) and disinflationary secular trends continue to provide the restraint on wage and price inflation that the Fed seeks without having to double-down on its intervention/manipulation?

My expectation is the latter—and it’s not just due to the sudden banking crisis magnifying fragility in our economy. Nothing goes in a straight line for long, and inflation is no different, i.e., the path is volatile, but disinflationary trends remain intact. I talk more about this in my full post below. Regardless, given the anemic GDP growth forecast (well below inflation) and the historical 90% correlation between economic growth and aggregate corporate profits, the passive broad-market mega-cap-dominated indexes that have been so hard for active managers to beat in the past may well continue to see volatility.

Nevertheless, many individual companies—particularly within the stronger sectors—could still do well. Thus, investors may be better served by pursuing equal-weight and strategic-beta ETFs as well as active strategies that can exploit the performance dispersion among individual stocks—which should be favorable for Sabrient’s portfolios, including the newest Q1 2023 Baker’s Dozen, Small Cap Growth 37, and Dividend 43 (offering both capital appreciation potential and a current yield of 5.2%), all of which combine value, quality, and growth factors while providing exposure to both longer-term secular growth trends and shorter-term cyclical growth opportunities.

Quick plug for Sabrient’s newest product, a stock and ETF screening and scoring tool called SmartSheets, which comprise two simple downloadable spreadsheets that provide access to 9 of our proprietary quant scores. Prior to the sudden fall of SIVB, on a scale of 0-100 with 100 the “best,” our rankings showed SIVB carried a low score in our proprietary Earnings Quality Rank of 35, a GARP (growth at a reasonable price) score of 37, and a BEAR score (relative performance in weak market conditions) of 13. Also worth mentioning, Lantheus Holdings (LNTH) was consistently ranked our #1 GARP stock for the first several months of the year before it knocked its earnings report out of the park on 2/23 and shot up over +20% in one day. (Note: you can find our full Baker’s Dozen performance details here.) Feel free to download the latest weekly sheets using the link above—free of charge for now—and please send us your feedback!

Here is a link to a printable version of this post. In this periodic update, I provide a comprehensive market commentary, offer my technical analysis of the S&P 500 chart, review Sabrient’s latest fundamentals based SectorCast quant rankings of the ten U.S. business sectors, and serve up some actionable ETF trading ideas. To summarize, our SectorCast rankings reflect a slightly bullish-to-neutral bias, the technical picture looks short-term oversold, and our sector rotation model has taken a defensive posture. Technology has taken over the top position in our sector rankings. Read on…