Scott Martindale


  by Scott Martindale
  CEO, Sabrient Systems LLC


Quick portfolio update: Sabrient’s Q3 2026 Baker’s Dozen quarterly portfolio launched on 7/20 with a diverse group of 13 stocks across market caps and business sectors, including both prominent and under-the-radar names. Also, the new Sabrient Dividend 57 quarterly portfolio just launched on 8/4 as a growth & income strategy, with a diverse group of 48 high-quality stocks across market caps and sectors and a current yield of 3.8%. Additionally, our annual Forward Looking Value 14 portfolio will launch on 8/26 with a diverse group of high-quality, value-oriented stocks having good growth potential across market caps and sectors.

Overview

There has been outsized investor focus on inflation and the Fed’s response to it—something that new chairman Kevin Warsh is trying to diminish. He has stated, "…market participants are learning to play the ball, not the referee." Warsh has suggested a preference fulfilling the mandate of price stability through a combination of lower policy rates, continued balance sheet reduction, and structural reform of the official inflation metrics (which rely on many lagged, imputed, and low-relevance components). Some observers and several FOMC members say we must have rate hikes to control the inflationary spiral, while others say we need rate cuts to boost the struggling lower leg of our K-shaped economy (lower-income and working-class consumers, small businesses, and housing) and the alarmingly low personal savings rate (2.7% versus a long-term average of 8.3%) that has been supporting personal consumption. Count me in the latter group, as I explain in my full commentary below.

But that’s not stopping the bond vigilantes from boycotting the massive issuance of debt and thus pushing up longer-term rates at an alarming pace, which negatively impacts mortgage rates, corporate borrowing costs, and the discount rate on stock valuations. Uncertainty leads to higher term premiums. It might be not only a protest against rising federal debt but also anticipation of the Fed shrinking its balance sheet (aka QT), which pulls cash (bank reserves) out of the financial system while increasing the supply of bonds in the market (leading to higher yields)—even though the Fed has already reduced its balance sheet by $2.4 trillion (from $9 trillion in 2022) to remove about half its pandemic-era QE accumulation.

As a result, 10-year Treasury yields made another new 18-month high at 4.74% at the end of July, and the 30-year reached its highest yield since 2007 of 5.27%, entirely due to rising real rates not inflation expectations (which remain modest). Although yields pulled back last week on hopeful Iran news, plunging crude oil prices, and weak jobs reports, providing hope of a less restrictive Fed. So, although longer-term yields may well rise further—with the 10-year potentially challenging 5% for the first time in three years—I see this as a buying opportunity for fixed income, such as with iShares 20+ Year Treasury ETF (TLT) with a current yield of 4.75%, particularly if inflation has seen its peak and is pulling back, as I suspect it is.

The federal deficit is now roughly $2 trillion out of a $7 trillion total budget (that’s nearly 30% of the total budget!), which must be financed through Treasury issuance. And roughly half that deficit is interest on debt payments (now exceeding $1 trillion/yr and growing fast), which rises as debt increases, requiring new issuances and debt rollovers—both at higher interest rates than before as the Treasury Dept. has focused on the short end of the yield curve, thus lowering the weighted average maturity of federal debt.

It’s a death spiral rapidly overwhelming the budget, which (as I have discussed at length in many prior posts) must be addressed with a 3-prong approach of: 1) growing away the debt through robust GDP growth given that tax receipts historically average 17% of GDP no matter the tax rates, 2) cutting away the debt through reduced spending growth below the rate of GDP growth and rooting out waste and fraud, and 3) inflating away the debt through elevated inflation rates that reduce the dollar value of the debt.

Meanwhile, the giant hyperscalers are not only spending most or all of the massive cash flows but are also flooding the corporate bond market with as much as $1 trillion for AI infrastructure buildout. So, perhaps part of Warsh’s plan is to let the market do the dirty work of suppressing economic activity by raising longer-term rates—leading to higher mortgage rates, corporate borrowing costs, and the discount rate on stocks valuations—hopefully not to the point of causing a recession.

For now, there is no sign of recession as the Atlanta Federal Reserve’s purely model-driven GDPNow forecast shows an estimate for Q3 real GDP growth of a robust +5.8% as of 8/6 (although the more nuanced consensus of “Blue Chip” economists is only 2.0%). You might recall the forecast showing strong numbers for Q2 with a high of +4.3% in late May before falling to a low of +1.2% in early July, with the final BEA report coming in at just +1.5%. Nonetheless, there was plenty of good in the report, as non-government private spending (consumers and private fixed investment) grew +3.9%.

And although this private spending was offset by 1) falling net exports (as imports surged +11.5%, driven by AI-related components), which alone reduced the final number by 1.01 percentage points (pps), and 2) private inventory drawdowns, which reduced it by 0.67 pps, both of these metrics in fact reflect robust underlying domestic demand, consumer spending, corporate capex, and overall economic activity. Indeed, when high imports and low inventories suppress GDP, it typically suggests impending economic acceleration and revved-up domestic manufacturing, which would boost GDP metrics in subsequent quarters—which the Atlanta Fed’s GDPNow forecast seems to be reflecting.

In my full commentary below, I discuss:

1. The selloff in the AI trade and the restoration of Apple’s prominence
2. Hyperscaler capex, free cash flow, and power demand
3. Solid GDP growth but mixed messages on jobs and housing
4. Trends in inflation, supply chain pressures, and productivity
5. The bond vigilantes, rising federal debt, China’s woes, and Fed policy
6. My final comments section pushing back on the overwrought AI backlash/alarmism
7. Sabrient’s sector rankings, positioning of our sector rotation model, and some top-ranked ETF ideas

With all the turmoil in the AI trade, which was overdue after such a meteoric rise, market leadership continues to broaden and rotate. The fact that the market rotated rather than sell everything and go to cash is encouraging and suggestive of continued bullish conviction. Russell 2000 companies’ earnings growth forecasts for CY2026 have climbed to 38% from about 23% at the beginning of the year—in spite of rising interest rates that tend to have outsized impact on the floating-rate debt typically carried by smaller firms. And the equal-weight S&P 500 ETF (RSP) is approaching $100 billion in AUM, with performance led by many of the “S&P 493” rather than the MAG7.

Chamath Palihapitiya, entrepreneur and All-In Podcast team member, recently quipped, “Fundraising requires narrative, and ‘we are building God’ is a better pitch than ‘we wrote some very clever linear algebra, pirated the internet, and threw a bunch of compute at it.’”  Perhaps that’s what investors reduced it to as they abandoned the AI trade—at least for the moment. And perhaps it is true that our economy has been overly reliant upon AI-led expansion with yet-to-be-proven ROI, especially datacenters.

Indeed, the dollar value of datacenter construction plus computers and communications equipment are up 23% YoY, with the hyperscalers’ capex [in order of dollar commitments: Amazon (AMZN), Microsoft (MSFT), Alphabet (GOOGL), Meta (META), Oracle (ORCL), and now SpaceX (SPCX)] projected to be in the range of $700-800 billion for CY2026 (40% higher than CY2025)—leading to reduced shareholder-friendly buybacks but surging global semiconductor sales. According to the Semiconductor Industry Association, chip sales worldwide were up +123% YoY in the month of June, totaling over $400 billion during Q2, and are expected to exceed $1.5 trillion for CY2026.

That’s a lot of investment to recover. But as Tech executive and investor Nat Friedman opined, “Pessimists sound smart. Optimists make money.” Indeed, longer term, I believe the broad potential ROI of AI—in reshaping our economy and society through massive productivity gains, solving complex scientific and technological challenges, and fundamentally transforming the workplace and daily life—is stronger and materializing faster than anticipated even at the beginning of the year.

The use cases and compute demand for AI have barely begun to manifest, with a future encompassing autonomous transportation, factory automation, humanoid robots, personal assistants for hundreds of millions of individual users, and AI assistance on everything from drones for law enforcement, to surgery and drug discovery, to optimized asset maintenance, smart grid energy, and fraud monitoring—not to mention the associated power demand for it all.

So, am I concerned about whether the massive AI capex by the hyperscalers on infrastructure (like datacenters) and power generation will see attractive ROI anytime soon? I am not. In fact, I bought into the July “tech wreck,” including some names in memory and storage as well as the MAG7 ETF (MAGS), and I bought into the “SaaSpocalypse” in February and again in April via the iShares Tech-Software ETF (IGV). In its earnings report the other day, Palantir (PLTR) described commercial demand as “otherworldly,” and the stock surged 30%. In my view, for anyone who felt they had missed the boat on the AI surge and didn’t want to chase it—this was the pullback you were waiting for.

Of course, there is no guarantee that the market won’t turn tail once again, given the unresolved conflict with Iran and its terrorist proxies and the real potential for reescalation. And besides Iran, a plethora of uncertainties persist with oil prices, shipping and supply chains, trade deals and tariffs, Ukraine, China, Japanese yen, federal debt, civil strife, midterm elections and the unnerving rise of DSA candidates, inflation, jobs, and monetary policy from a revamped Fed. Did I miss anything?

But fundamental tailwinds still outweigh headwinds, in my view, given AI optimism, robust capex, deregulation, lower taxes, re-privatization, re-industrialization (onshoring of manufacturing), diversification of supply chains (not deglobalization), rising productivity/margins/earnings, low credit spreads, and resumed disinflationary trends. Deregulation is focused heavily on encouraging domestic fossil fuel production, less burdensome financial oversight, and less onerous climate rules, mostly to the advantage of Energy, Financials, and Industrials sectors.

Forward P/E multiples have receded largely due to a rising discount rate as bond yields surge. And yet stocks keep going up on the back of incredible earnings growth and fast-rising forward estimates. According to First Trust, “Analyst estimates have increased as the year has unfolded, with Large Cap, Mid Cap, and Small Cap Index EPS estimated to reach a record $354.46, $219.63, and $107.53, respectively, in 2026 (as of 8/3/26) [according to Bloomberg]. For comparison, analyst estimates were much lower at the start of the year, with the same indices estimated to see calendar year 2026 earnings of $310.84, $202.91, and $96.06 (as of 12/31/25).”

Indeed, the S&P 500 is on pace for blended earnings growth in Q2 of 47% versus a forecast of 23% just a few weeks ago. However, if you strip out Amazon (AMZN) and Alphabet (GOOGL), whose incredible earnings reports were largely driven by non-operating gains on investments in Anthropic and SpaceX, the blended S&P 500’s blended EPS growth falls to around 29%, which is still quite impressive.

Overall, given the market broadening beyond the Big Tech titans, and assuming the Fed does not become more hawkish, I continue to see opportunities in active stock selection, as well as in cyclicals, value stocks, small caps, and bond-alternative dividend payers. Indeed, Sabrient’s Baker’s Dozen, Forward Looking Value, Small Cap Growth, and Dividend portfolios have been largely outperforming their benchmarks—some by substantial margins. And as a reminder, our Earnings Quality Rank (EQR) is licensed as a quality prescreen to the actively managed, low-beta First Trust Long-Short ETF (FTLS), which now has nearly $2.5 billion in AUM.

By the way, in my July post, I wrote a long Final Comments section on the alarming rise of socialism, which I would encourage you to read if you haven’t already. Although I acknowledge the disparate impacts of the K-shaped economy, the socialists’ harping on fairness and wealth inequality is largely a red herring as living standards, real incomes, consumption, and life expectancies have generally risen across demographics nationally. It certainly doesn’t warrant dismantling the capitalist system that has created so much innovation, value, wealth, comfort, and good for the world.

The exception to broadly rising living standards seems to lie in many of our deep-blue cities and states. So today, let me also add a comment on the “affordability” issue that has become the main talking point of the Left against the Trump Administration. The reality is that the bluest cities and states tend to have the worst affordability, as reinforced by US News & World Report’s latest 2026 rankings of states that put California dead last in its specific “Affordability” metric, followed by other deep-blue states, namely New Jersey, Hawaii, New York, Washington, Massachusetts, Maryland, and Colorado. It also put California dead last for the broader “Opportunity” category, which comprises the subcategories of Economic Opportunity, Affordability, and Equality across demographic groups.

So, don’t be gaslighted by deceptive electioneering. The answer is not to double down on the same misguided and counterproductive policies—like onerous zoning restrictions and permitting processes, punitive taxation, high energy prices, mandated worker benefits, rent control, sanctuary policies, and permissiveness on crime and homelessness—that have degraded quality of life for everyone while inviting fraud and corruption. Rather, voters should pivot back to embracing free markets, meritocracy, property rights, and the rule of law that built our great country. Such principles have proven much more adept at solving problems than dogmatic bureaucrats, virtually none of whom have any private-sector leadership experience. Affordability is a genuine problem, particularly in several high-cost blue states, and policymakers in these locales shouldn't assume that further expanding redistribution or intervention policies will solve the problems that were likely created by these policies in the first place.

Here is a link to this full post in printable PDF format. As always, I’d love to hear from you! Please feel free to email me your thoughts on this article or if you’d like me to speak on any of these topics at your event!  Read on….

Scott Martindale


  by Scott Martindale
  CEO, Sabrient Systems LLC


Quick note: Sabrient’s new Q3 2026 Baker’s Dozen Portfolio will launch on Monday 7/20 as a 15-month portfolio with a mid-cap bias and a diverse group of 13 stocks across 8 business sectors, including several under-the-radar names. Notably, the next-to-terminate Q2 2025 Baker’s Dozen shows a gross total return of +54.7% from its inception date of 4/17/25 through 7/10/26, vs. +45.6% for SPY. Until 7/17, the Q2 2026 portfolio remains in primary market for new investment. Its top performers so far are Seagate Technologies (STX), Roku (ROKU), and AbbVie (ABBV).

Overview

During Q2 2026, the S&P 500 and Nasdaq Composite indexes posted their best quarter since the pandemic recovery in 2020, rising +14.9% and +21.4%, respectively, driven by AI-related chip stocks, as the resilient bull market powers on. And encouragingly, market breadth expanded nicely as the Russell 2000 small cap index was up +21.4% (following a flat +0.9% Q1), giving it its best H1 since 1991 (+22.6%) as investors sought to broaden their exposure into growing companies poised to benefit from the One Big Beautiful Bill Act’s (OBBBA) tax policies, deregulation, and incentives.

After ChatGPT arrived in November 2022, the market was all about AI-dominant Big Tech, creating hyperscale, and spending unprecedented capex (consuming all the hyperscalers’ massive cash flow, plus some new debt) that drove a 150% gain in the Nasdaq over the ensuing 3.5+ years (annualizing around 30%/yr). But so far this year, the “S&P 493” have vastly outperformed the MAG7 (which peaked on 5/14 and then sold off 15% by 6/26 before bouncing), and investors have invited small caps—and other “trickle down” industries benefiting from massive AI capex—to join the party, despite the event-driven oil price shock, inflation spike, and rising Treasury yields. But Treasury yields are likely being driven more by the hawkish Fed talk than from concerns about structural inflation, and although the coast isn’t entirely clear of macro hurdles, it would be highly unusual for this broadening advance to spell the end of the bull market.

In my full commentary below, I discuss:

1. The trend in consumer sentiment vs. stock prices
2. AI capex and power demand
3. Fundamental tailwinds and the impact on China
4. The “SaaSpocalyse” and what happens next
5. Global liquidity concerns
6. Status and outlook for GDP, inflation, jobs, and productivity
7. My final comments section on stanching the insidious rise of socialism in this country
8. Sabrient’s sector rankings, positioning of our sector rotation model, and some top-ranked ETF ideas

Investor preferences even within Big Tech are definitely rotating. Suddenly, Apple (AAPL) has caught up with Alphabet (GOOGL) as the top performing MAG7 stocks YTD. Apple is expanding its relationship with Broadcom (AVGO) in a $30 billion chipmaking deal to produce more than 15 billion chips in the US, including expansion of Broadcom’s Fort Collins, CO facility. There are now 13 stocks in the $1 trillion market cap club—the MAG7 plus tech sector comrades Taiwan Semi (TSM), Broadcom (AVGO), SpaceX (SPCX), and Micron (MU), along with financial Berkshire Hathaway (BRK-B) and healthcare name Lilly & Co (LLY).

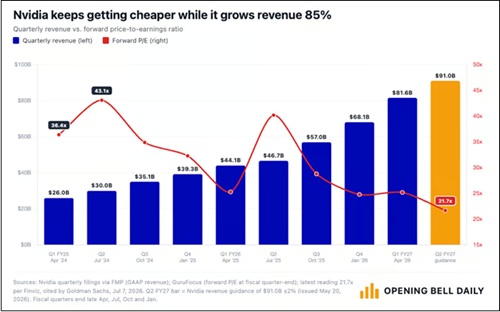
Meanwhile, previous investor darling NVIDIA (NVDA) is now trading at its lowest multiple since 2019. Despite posting an 85% YoY increase in revenue, hitting a whopping $81.6 billion last quarter, share price has been flat such that its forward P/E at around 22x is on par with the broad S&P 500’s composite forward P/E. Compare that to its 5-year average of 72x. The chart below is from Phil Rosen of Opening Bell Daily.

NVIDIA growth trend

After pulling back nearly 20% from its all-time high on 5/14, NVIDIA has recovered some ground and is up about +13% YTD, but rival Advanced Micro (AMD) is up +160% and Intel (INTC) is up +200% over the same timeframe, with forward P/Es around 75x and 125x, respectively. More broadly, according to Morgan Stanley, the P/E premium for the MAG7 versus the other S&P 493 has compressed from above 30% to roughly 10%. I suppose investors don’t see how it can continue to achieve such amazing growth and huge margins, which are attracting more competition in the space. Regardless, analysts continue to raise estimates, and NVIDIA should remain a growth juggernaut for the foreseeable future—particularly with hyperscaler capex (much of which buys NVIDIA products) projected to reach $1 trillion in 2027.

Incredibly, although NVIDIA lost around $1 trillion in market cap during its May-June correction, it is now back above $5 trillion in market cap and is the world’s largest company—on par with Germany’s entire nominal GDP, which is the third-largest economy in the world behind the US and China. NVIDIA represents about 8.5% of the S&P 500 index market cap, and it is larger than: 1) the entire Russell 2000 small cap index ($3.5 trillion), 2) 6 of the world’s top 10 stock exchanges (including UK, France, Italy, India, and Spain); 3) 6 of the 11 sectors of the S&P 500 individually; and 4) the combined market cap of the S&P 500’s Materials, Real Estate, and Utilities sectors.

Broadening beyond the market’s biggest stocks is well in motion. Both the Russell 2000 small cap index (+20% YTD) and the Dow Jones Transportation Average (+18% YTD) have had their best start to a year since 1991. Financials, Healthcare, and Industrials all displayed outperformance versus the broad S&P 500 during June. Corporate profitability has been solid across industries, reflecting resilient demand, disciplined cost management, technological innovation, and sustainable productivity gains—not to mention the trillions of dollars in capex for the gradual onshoring/reshoring of manufacturing, much of it already underway. Net corporate income now accounts for 12.4% of GDP.

As I write about regularly, the outlook for inflation continues to improve, particularly given the many underlying global disinflationary trends. This week brings the June CPI/PPI numbers, which I expect will be lower—although the resumption this month in hostilities in Iran and the resultant jump in oil and gasoline prices might signal some inflationary pressures for the July metrics and cause investors (and the Fed) to hold off on any celebration. Notably, seven OPEC+ countries (Saudi Arabia, Russia, Iraq, Kuwait, Kazakhstan, Algeria, and Oman) agreed to increase oil production by a combined 188,000 barrels per day starting in August. But beyond that announcement, supply chains have rapidly diversified in response to the Strait of Hormuz bottleneck—and what the International Energy Agency (IEA) has called “the largest supply disruption in history”—such that it is no longer strangling the global economy, as I discussed in my April post. Indeed, this was long overdue as Iran has not been a reliable observer of the “right of transit passage” in narrow international straits under the UN Convention on the Law of the Sea (UNCLOS) in 47 years.

In my full commentary below, I discuss the divergence between poor consumer sentiment versus strong advisor sentiment and a rising stock market, as well as the shift in focus from both the federal government and institutional investors into hard assets and infrastructure. Moreover, through the end of this decade and likely beyond, I expect to see smaller government and less low-ROI government spending in favor of more high-ROI capital allocation from an unleashed private sector as the primary engine of organic economic growth through fiscal support like favorable tax policy, deregulation, and other supply-side incentives for reshoring/onshoring to increase productive capacity.

This should lead to strong real GDP growth, a peace dividend, rising productivity and a resumption in other disinflationary trends that bring back inflation under 2.5%, and a new “hands-off” Federal Reserve under new chairman Kevin Warsh that aims for less market intervention and does not fear that robust economic growth (aka “overheated” or “above trend”) fuels inflation. Instead, Warsh believes as I do that inflation in general is driven by excessive monetary expansion and deficit spending (including massive spending bills, “helicopter money,” and QE), rather than by a strong and productive private economy.

As such, I still think the S&P 500 might hit 8,000 by year end, although I also think gold, silver, copper, and bitcoin remain long-term accumulation plays, even though they might see further near-term headwinds (e.g., war, a hawkish Fed, and a strong dollar). Given the market broadening beyond the Big Tech titans, and assuming the Fed does not become overly hawkish, we continue to see opportunities in active stock selection, small caps, and bond-alternative dividend payers.

Indeed, Sabrient’s Baker’s Dozen, Forward Looking Value, Small Cap Growth, and Dividend portfolios have been largely outperforming their benchmarks. Our latest Q2 2026 Baker’s Dozen Portfolio launched on 4/17 as a 15-month portfolio with a mid-cap bias and a diverse group of 13 stocks across eight business sectors. It remains in primary market until Friday 7/17, and then the new Q3 2026 Baker’s Dozen launches on Monday 7/20. And, as a reminder, our Earnings Quality Rank (EQR) is licensed as a quality prescreen to the actively managed, low-beta First Trust Long-Short ETF (FTLS), which now has over $2.4 billion in AUM.

Sabrient employs a variety of fundamental financial factors in our quantitative models and portfolio selection process. Sabrient Scorecards for Stocks and ETFs are investor tools that provide access to several of our proprietary models for idea generation and portfolio monitoring. To learn more, I invite you to visit https://MoonRocksToPowerStocks.com where you can download founder David Brown’s latest book (an Amazon international bestseller) and 2 bonus reports (on investing in the Future of Energy and Space Exploration)—all in PDF format—and start subscribing to the Scorecards, which make David’s process easy for idea generation and portfolio monitoring. They include our Top 30 stocks each week for 4 distinct investing strategies—Growth, Value, Dividend, and Small Cap. To go straight to the Scorecard subscription, go to: https://www.moonrockstopowerstocks.com/sabrient-scorecard

Here is a link to this post in printable PDF format. As always, I’d love to hear from you! Please feel free to email me your thoughts on this article or if you’d like me to speak on any of these topics at your event!  Read on….

Scott Martindale


  by Scott Martindale
  CEO, Sabrient Systems LLC


Quick note 1: Sabrient’s new Q2 2026 Baker’s Dozen Portfolio just launched last Friday 4/17 as a 15-month portfolio with a mid-cap bias and a diverse group of 13 stocks across 8 business sectors, including several under-the-radar names. Notably, last year’s Q1 2025 Baker’s Dozen just terminated on 4/20 with a gross total return of +46.7% (vs. +20.3% for SPY).

Quick note 2: I invite you to visit https://MoonRocksToPowerStocks.com to learn more about Sabrient founder and former NASA engineer David Brown’s new book (an Amazon international bestseller) that details the fundamental factors underlying Sabrient’s models. Immediately download the book and 2 bonus reports (on investing in the Future of Energy and Space Exploration), plus a detailed report on the new Q2 2026 Sabrient Baker’s Dozen (all in PDF format) and learn how to access Sabrient Scorecards, an investor tool that provides access to our proprietary scores to make the stock evaluation process easy for idea generation and portfolio monitoring.

Overview

It didn’t take long for stocks to surge back to new all-time highs. Despite some commentators asserting that $100/bbl oil is here to stay given the damage wrought on energy infrastructure and supply chains, investors were unphased. The S&P 500 quickly reclaimed both its 50- and 200-day moving averages simultaneously (before the dreaded “death cross” could occur) in an historic run, and then continued to surge to new highs in response to Iran resolution optimism, earnings season confidence, resurgent zeal for the Tech/AI/blockchain Supercycle, falling bond yields, and a weaker US dollar, as safe haven capital rotated back into risk assets. Just a few weeks ago, I wrote in my 3/31 post that the S&P 500 had closed below its 200-day moving average for eight straight sessions and was struggling to hold support at the 300-day moving average, but that the selling seemed near exhaustion and ready for at least a bounce to fill gaps in the chart. Well, it got a lot more than a bounce.

Big Tech led the April surge. Bloomberg pointed out that over half of the S&P 500’s gain can be attributed to these seven companies—NVIDIA, Amazon, Microsoft, Broadcom, Alphabet, Meta Platforms, and Apple, which gained a combined $4 trillion in market cap. The rally commenced on 3/31 even as oil prices were still rising (to nearly $120/bbl on 4/7). This divergence is similar to what it did in 1990, which marked a low for equities at the time. But then on 4/8, crude oil fell suddenly and sharply, ultimately falling to near $80/bbl last Friday on ceasefires and news of that a peace agreement might be nigh along with a reopening of the Strait of Hormuz. (However, investors must keep in mind that we are still dealing with a fanatical, apocalyptic theocracy that is neither rational nor trustworthy…and indeed we can’t be sure if there is a true central governing body with whom to make a lasting deal.)

According to Bespoke Investment Group (BIG), since 1928, this is the first time the S&P 500 has reached a new all-time high within 11 days of a 5-10% pullback. In the midst of this historic rally, DataTrek noted, “Will the S&P 500 need to retest its March 30th lows, or was that a classic ‘V bottom’? History shows stocks don’t need to retest if investors are sure that policy has changed enough to address the causes of prior declines. We believe that is the case now and remain positive on global/US stocks.” Indeed, last week for the first time ever, the S&P 500 closed above 7,000 and Nasdaq above 24,000, while the Dow is eyeing 50,000 once again—and this bull market is now approaching 1,300 calendar days since its last 20% peak-to-trough correction (which ended on 10/11/2022).

Furthermore, the CBOE Volatility (VIX) Index is solidly back below 20 (the “fear threshold”), and the 10-year Treasury yield has pulled back to 4.25%. Notably, credit spreads are subdued, with high-yield plummeting from a peak of 3.46 pps on 3/30 to just 2.83 today. The credit market is highly sophisticated and historically a better predictor of economic distress than equities, so the current tightening in spreads suggests that despite high oil price and lingering uncertainty about direction, institutional fixed income investors are not pricing in rising default risk.

However, the market is surely not off to the races from here, in my view. The charts are extremely overbought, there has been narrow Tech leadership during this recent surge, and traders have taken on additional leverage. So, stock will likely pause to at least consolidate gains and more likely pull back to test bullish conviction at key support levels.

Nevertheless, I think the overall outlook for 2026 remains bright. Yes, the ongoing Iran conflict has created vast uncertainties and severe impacts on energy and supply chains—and by extension, inflation. But don’t forget, as we entered Q1 earnings season, corporate earnings expectations continued to be revised higher—now expected to be around 13% YoY for the S&P 500 in Q1 and 17% for full-year 2026—fueled by massive capex in AI, blockchain, energy, and re-industrialization/reshoring of factories and power infrastructure, leading to rising productivity, increased productive capacity, a resumption in disinflationary trends, and economic expansion.

In addition, the One Big Beautifull Bill Act (OBBA) has fully kicked in with its tax reform, deregulation, pro-energy policies, and broad support for the private sector to retake its rightful place as the primary engine of growth (with more efficient capital allocation and ROI than government). Federal government staffing is shrinking, helping to contract the budget deficit, along with tariff revenue, fraud identification/reduction (especially in big-ticket line items like Medicare/Medicaid). And don’t forget the enthusiasm for this year’s IPO market, with names like SpaceX/xAI, OpenAI (ChatGPT), and Anthropic (Claude) expected to soon go public. In February, Anthropic closed a $30 billion funding round at a $380 billion valuation, backed by Alphabet, Amazon, Microsoft, and NVIDIA. SpaceX seems to be targeting a June listing at a valuation of at least $1.75 trillion. No doubt, the US continues to be the world’s leading economic growth engine.

As the WSJ noted last week, “Oil prices have retreated. Wall Street banks just posted blockbuster earnings. And CEOs are touting the strength of the US economy. That combination has stocks back on the brink of records and some investors thinking a strong earnings season could power them even higher.” And as Barclays sees it, “There is a wall of worry—but it’s worth climbing.”

Regardless, the Iran conflict and seesaw of shipping blockades has laid bare the risks to the global economy of overreliance on supplies of critical energy and petrochemical supplies from a volatile part of the world and a very narrow waterway/chokepoint that has been long at the mercy of a terrorist regime. Facing down this systemic threat had to happen before Iran’s military capabilities—supported by China and Russia—reached the point of no return, in which the fallout of confrontation could be catastrophic. But also, the need for more diversified petroleum and petrochemical supply chains is no longer a mere discussion point.

Looking ahead, the Atlanta Fed GDPNow forecasts only +1.3% for Q1 2026, but it can change quickly with new data points. The jobs market remains in a lackluster “no hire, no fire” mode, with falling job openings, fewer opportunities for new college grads, and wage growth that has not kept up with price increases, as real (inflation-adjusted) hourly earnings declined -0.6% in March and have risen only +0.3% over the past year. As the Fed put it in their Beige Book, labor demand is “stable, with low turnover, minimal layoffs, and hiring mostly for replacement.” So, jobs growth is slowing and wage growth is decelerating. Overall, I continue to believe the overall economic picture suggests room for another Fed rate cut—but certainly not a rate hike, as some inflation hawks still suggest—and I still think today’s fed funds rate should be 3.0%.

The topics covered in today’s post are eclectic. I discuss stock patterns and valuations, the economy, inflation, debt, liquidity, and Fed policy, and in my Final Comments section I touch on more esoteric topics like lessons learned from the Iran conflict, supply chains, reverse lightering of oil tankers…and even some passages from Catechism. Then I close with my usual update on Sabrient’s sector rankings, positioning of our sector rotation model, and some top-ranked ETF ideas.

I expect stock market performance to be more dependent upon robust earnings growth and ROI—rather than AI hope-driven multiple expansion. Regardless, rather than the broad passive indexes (which are dominated by growth stocks, Big Tech, and the AI hyperscalers), I think 2026 should continue to be a good year for active stock selection, small caps, and bond-alternative dividend payers—which bodes well for Sabrient’s Baker’s Dozen, Forward Looking Value, Small Cap Growth, and Dividend portfolios, which are packaged and distributed as unit investment trusts (UITs) by First Trust Portfolios.

By the way, our new Q2 2026 Baker’s Dozen Portfolio just launched last Friday 4/17 as a 15-month portfolio with a mid-cap bias and a diverse group of 13 stocks across 8 business sectors (InfoTech, Financials, Industrials, Healthcare, Consumer, Comm Services, Energy, and Materials), including familiar names like Taiwan Semi (TSM) and Cheniere Energy (LNG), but also under-the-radar names like machinery maker Allison Transmission (ALSN) and engineering & construction firm Dycom Industries (DY). Notably, last year’s Q1 2025 Baker’s Dozen just terminated on 4/20 with a gross total return of +46.7% (vs. +20.3% for SPY), led by infrastructure engineering & construction firm Comfort Systems USA (FIX), oil & gas equipment and services firm TechnipFMC (FTI), and chipmaker Advanced Micro Devices (AMD).

Also, small caps and high-dividend payers tend to benefit from market rotation—which should resume as the war comes to a (hopefully swift) resolution, so Sabrient’s quarterly Small Cap Growth and Dividend portfolios might be timely investments. And, as a reminder, our Earnings Quality Rank (EQR) is licensed to the actively managed, low-beta First Trust Long-Short ETF (FTLS) as a quality prescreen (Note: FTLS never lost support at its 200-day moving average during the March selloff).

I have been encouraging investors throughout this global turmoil to exploit market pullbacks by accumulating high-quality stocks as they rebound. By “high quality,” I mean fundamentally strong, displaying a history of consistent, reliable, resilient, durable, and accelerating sales and earnings growth, positive revisions to Wall Street analysts’ consensus estimates, a history of meeting/beating estimates, rising profit margins and free cash flow, high capital efficiency (e.g., ROI), solid earnings quality and conservative accounting practices, a strong balance sheet, low debt burden, competitive advantage, a wide moat, and a reasonable valuation compared to its peers and its own history.

These are the factors Sabrient employs in our quantitative models and “quantamental” portfolio selection process. You can learn how to access several of our proprietary models for idea generation and portfolio monitoring through Sabrient Scorecards, as well as download Sabrient founder David Brown’s latest book (an Amazon international bestseller), by visiting this link: Moon Rocks to Power Stocks

Here is a link to this post in printable PDF format, where you also can find my latest Baker’s Dozen presentation slide deck. As always, I’d love to hear from you! Please feel free to email me your thoughts on this article or if you’d like me to speak on any of these topics at your event!  Read on….

Scott Martindale 
  by Scott Martindale
  President & CEO, Sabrient Systems LLC

 Overview

 Market indexes regained all of their losses since the president’s “Liberation Day” tariff announcement one month ago, culminating in an historic +10% 9-day rally for the S&P 500 (and +18% from its 4/7 intraday low) that sent it back above its 20-day and 50-day moving averages to test resistance at its 200-day. But was this just a short-covering relief rally as bearish commentators assert? I said in my April post that the $10 trillion that left the stock market was not the “capital destruction” they claimed, like a wildfire burning down homes, but rather a rotation into the safety of bonds and cash that could quickly rotate back. Sure enough, when retail investors swooped in to scoop up the suddenly fair valuations of the capitulation selloff, leveraged algo momentum traders quickly joined in. But while I think the longer term holds promise, the chart became short-term overbought (and is pulling back this week), and macro conditions are still treacherous, keeping investors jittery and headline-driven. So, the market remains fragile even as we wind down a solid Q1 earnings reporting season, with the FOMC policy announcement on tap this week.

Nevertheless, in my view, positive signs are emerging to suggest: 1) the trade war (particularly with China) and the hot war in Ukraine will both find their way to a resolution, 2) the fiscal legislation (“one big, beautiful bill”) with new tax cuts working its way through congress will soon be passed, 3) the size and scope of federal government that has crowded out the private sector is shrinking and making way for re-privatization and de-regulation of the economy to unleash organic private sector growth, 4) corporate earnings and capex commitments remain strong, and 5) the Federal Reserve will ensure liquidity growth and restart its rate-cutting cycle like other central banks—and liquidity leads pricing in risk asset markets, gold, and cryptocurrencies. So, I think the noise will quiet and the clouds will clear, making way for a renewed focus on corporate earnings and global liquidity to power forward the economy and stocks. And don’t forget—the market loves to climb a wall of worry, which means it discounts the future and typically turns well in advance of the economic and sentiment metrics.

Of course, the biggest news that juiced the stock market is the apparent offramp forming for the trade stalemate between the US and China. Publicly, China has been saber-rattling as a Trumpian bargaining tactic, in my view, and to stoke the flames of political division in our country with midterms on the docket next year—something the CCP doesn’t have to worry much about. Indeed, it has been loath to give an inch even though its economy was already struggling with deflation, a long-running property crisis, sluggish consumer demand, overcapacity, and weak business and consumer confidence well before the recent tariff escalation. Its services PMI just hit a 7-month low, its manufacturing PMI has officially fallen into contraction at 49.0, and its new export orders component plunged to the lowest reading since the pandemic at 44.7. And although China insists the US “unilaterally” started the trade war, the truth is we are finally pushing back after years of turning a blind eye to their tariffs, IP theft, forced technology transfers, hacking, state subsidies, dumping of goods, fentanyl trafficking, and currency manipulation.

In my view, the US is in far better position to weather a brief trade war than mercantilist China. As Treasury Secretary Scott Bessent succinctly articulated, “China’s business model is predicated on selling cheap, subsidized goods to the US, and if there is a sudden stop in that, they will have a sudden stop in their economy. So, they will negotiate.” Both governments know that an escalating trade war with big tariffs and a tight US Federal Reserve is especially bad for China. The dollar/yuan exchange rate is crucially important to China, and the dollar today is nearly as strong it has been against the yuan since yuan’s devaluation during the Global Financial Crisis. With its massive dollar-denominated debt, a weaker dollar relieves China’s financial strain by boosting global liquidity to the benefit of both countries. So, despite its theatrical saber-rattling, China needs a trade deal that ensures a weaker dollar to shore up the yuan and reduce capital flight.

Indeed, we are now hearing from China that “the door is open” to trade talks, and its security czar is evaluating ways to address the use of Chinese precursor chemicals by Mexican cartels to produce fentanyl for distribution in the US. Moreover, although the Port of Los Angeles announced that volumes will fall be 1/3 as several major American retailers are halting all shipments from China, in reality, American businesses as usual are finding a way to succeed (and skirt the most onerous tariffs) by rerouting supply chains through 3rd party countries like Vietnam and Mexico (“trans-shipping”) and delivering to bonded warehouses to delay the official receipt of goods. Also offsetting the tariffs is the 10% drop in the dollar index.

Looking ahead, although volatility likely will remain elevated for the next few months, unless something crazy comes out of left field, I think the market has seen its lows, and the path of least resistance is higher. American consumers, corporations, and entrepreneurs are optimistic by nature and are always pushing boundaries and seeking a path forward, rather than sitting on their hands waiting for government to tell them what to do. And of course, President Trump is not one to sit on his hands for one minute in his effort to “fix” our unsustainable “death spiral” of inflation, debt, deficit spending, offshoring, and hyper-financialization.

But then we have the FOMC, whose members have been quite happy to sit on their hands in the face of tariff turmoil, falling inflation, and slowing GDP and jobs growth. Among the 19 FOMC participants (the 7 Board of Governors and 12 Reserve Bank regional presidents, which includes both the 12 voting members and the 7 non-voting members who serve as voting members on a rotating basis), they almost unanimously (18 of 19) agreed at their March meeting that growth and employment risks are skewed to the downside while inflation risks are skewed to the upside. Overall, the Fed has taken a dovish stance but will be reactive to sudden distress in growth and jobs rather than proactive in preventing such distress.

Although Fed Chair Powell often talks about tariffs as being inflationary, in fact tariffs are deflationary like all forms of taxation—i.e., without a commensurate increase in income or credit, they necessitate a rethinking and reallocation of one’s existing disposable income. Furthermore, Powell & Co. seem to be ignoring the deflationary signals of falling oil prices, slowing household consumption, declining savings rates, and rising delinquencies. Inflation metrics are pulling back after being propped up by elevated energy prices and long-lag components (like shelter costs) and the prior administration’s profligate federal deficit spending that overshadowed—and indeed created—sluggish growth in the private sector. I talk more about inflation metrics and expectations for next week’s CPI and PPI releases in my full commentary below.

To be fair, government spending (to the tune of nearly 6.5% of GDP) exacerbated the inflation and private sector malaise it created by making it difficult for the Powell & Co. to justify helping out the private sector with lower interest rates, thus crowding out the efficient capital allocation and high return on investment of the private sector with the inefficient capital allocation of bloated government boondoggles. Economist Michael Howell of CrossBorder Capital reminds us that “public debt is expanding faster than private debt, fueled by welfare commitments and rising interest burdens, ensuring persistent liquidity growth.” Importantly, Howell persuasively asserts that, “monetary policy must prioritize liquidity over inflation” concerns, so the Fed’s current hands-off, higher-for-longer, reactionary approach risks causing a liquidity crunch. In his view, “The modern financial system is a fragile, collateral-driven mechanism, and one that requires constant intervention [through proactive management] to avoid collapse.”

As Andrew Lees of MacroStrategy Partners has pointed out, “Economies naturally self-order productively when not constrained by excessive regulation and over-bearing government intervention. The current "financialized" economic system as it is, is dependent on debt and unproductive use of capital (Wall Street vs Main Street).” The private sector has proven to be much better at the efficient and highly productive allocation of capital to maximize ROI. So, as Secretary Bessent has described, the Trump administration seeks to reduce the budget deficit to 3% of GDP and increase real GDP growth to 3%, which would lead to the same kind of small-government/strong-private-sector economy that has turned around a foundering Argentina under President Milei.

The May FOMC meeting convenes this week, so we shall see. CME Group fed funds futures show only 3% odds of a 25-bp rate cut, but increases to 32% at the June meeting, and 78% odds of at least 75 bps (3 cuts) by year-end. In my view, they should be readying for 50 bps in rate cuts by July and a target neutral rate of around 3.25-3.50% by early 2026. Certainly the 2-year Treasury yield (the shortest term that is substantially market driven) at 3.80% (as of 5/6) is signaling to the Fed that rates should be much lower than the current 4.25-4.50% fed funds rate. According to a recent post by AlpineMacro, “…the current 10-2 year spread in the bond market is not sustainable, particularly if the economy slows sharply. Ultimately, the long end of the curve will gravitate to the short end, particularly when investors realize that tariff-induced price increases are temporary.” Notably, projections on bond issuance from Secretary Bessent suggest a gradual return to an 80/20 split between T-bonds & notes (80%) versus T-bills (20%) going forward as opposed to the nearly 100% allocation to T-bills (< 1 year) under his predecessor Janet Yellen.

I have been insisting for some time that the FFR needs to be 100 bps lower, as the US economy's headline GDP and jobs numbers were long artificially propped up by excessive, inefficient, and often unproductive federal deficit spending, while the hamstrung private sector has seen sluggish growth. Moreover, today’s DOGE-led spending cuts, trade war uncertainty, and with budget reconciliation and fiscal legislation still in progress have removed much of that artificial stimulus. But regardless of the May FOMC decision, I expect the rate-cutting cycle to restart in June and signed trade deals with our 18 key trading partners beginning this month.

But for the near term, until those things come to fruition, I continue to expect stocks will remain volatile (with VIX above the 20 “fear threshold” but below the 30 “panic threshold”). CNN's Fear & Greed Index just jumped from "Fear” to “Greed” on the dial but remains volatile. The American Association of Individual Investors' ("AAII") Investor Sentiment Survey has shown more than 50% bearish (vs. historical average of 31%) for 10 consecutive weeks, which is the longest streak since 1990. Capital flows reflect a sharp drop in foreign capital flight into US bonds and equities over the past two months in something of a “buyers’ strike,” adding pressure to the US dollar. And last week saw a negative Q1 GDP print, somewhat offset by an upside beat from the jobs report and rising labor force participation.

There are certainly plenty of high-profile bears. One market technician I respect a lot, A.J. Monte of Sticky Trades, still believes stocks will eventually retest their pandemic lows (!). He warned of the dreaded “death cross” when the 50-day moving average crossed down through the 200-day moving average on 4/12. And then we have Christoper Wood of Jefferies, who believes that US stocks saw a permanent (!) peak last December (at lofty valuations) and will never (!) see those levels again—much like Japan’s market peak in 1989. Instead of US stocks, Wood thinks investors should buy Europe, China, Japan, and India. Others have pronounced that the US brand is permanently damaged and that we have witnessed the end of “American exceptionalism.” Heavy sigh.

Call me overly patriotic with rose-colored glasses, but my view is a little different. Capital tends to flow to where it is most welcome and earns its highest returns, so the recent falling tide of foreign capital flight leaving the US will surely return once visibility clears and the dollar firms up. Most any foreign investor will tell you there is no other place in the world to invest capital for the innovation and expected return than the US given our entrepreneurial culture, technological leadership in disruptive innovation, strong focus on building shareholder value, low interest-rate exposure, global scalability, wide protective moats, and our reliable and consistently strong earnings growth, free cash flow, margins, and return ratios, particularly among the dominant, cash flush, Big Tech titans, which continue to use their piles of cash to seed AI startups and other disruptive technologies. Notably, the US boasts more than 50% of the world’s privately owned late-stage start-ups valued at over $1 billion (aka “unicorns”) and leads in R&D spending and patent applications.

Moreover, it’s not just the Technology sector that is appealing to investors. As BlackRock wrote in their Q2 2025 Equity Market Outlook, “Commentators will often cite the prevalence of a large number of Tech companies in the U.S. as the driver of U.S. equity dominance. But our analysis points to wider breadth in U.S. quality. Current return on tangible invested capital (ROTIC), a proxy for a company’s ability to allocate capital for optimal profitability, is significantly higher in the U.S. than elsewhere in the world, suggesting quality exists not in pockets but across sectors.”

As Kevin O’Leary has opined, “Our number one export is the American dream. Everyone wants to come to America and start a business and become personally free." And this will not change just because our president seeks to incentivize the private sector to strategically reshore manufacturing with the ultimate goals of reviving the middle class, narrowing the wealth gap, reducing the trade deficit, ensuring reliable supply chains, and reinforcing national security. Moreover, Trump’s federal cost-cutting, tariff regime, and America-First rhetoric does not aim for absolute deglobalization, fiscal austerity, mercantilism, and isolationism as the MSM would have you believe, but rather to simply rebalance a system that had become completely out of balance—and indeed was falling into that aforementioned death spiral of rising inflation, debt, deficit spending, offshoring, and hyper-financialization. The rebalancing involves re-privatization and de-regulation rather than relying on massive government spending—and what I call “smart austerity” to eliminate waste, fraud, abuse, corruption and unaccountability, plus a “peace dividend” from ending the war in Ukraine.

So, I continue to believe the macro uncertainty and jittery market will ultimately give way to a melt-up, sending the market to back near its highs of Q1 by year-end or early-2026, driven by rising global liquidity, a weaker US dollar, reduced wasteful/reckless government spending and regulatory red tape, lower interest and tax rates, massive corporate capex, and the “animal spirits” of a rejuvenated private sector and housing market.

The early April selloff brought down some of the loftiest valuations among the popular mega-cap stocks, with the forward P/E on the S&P 500 falling to 18.5x on 4/8 versus 22.7x at its February peak and today’s 20.6x (as of 5/5). In fact, many of the prominent names in the Technology and Communication Services sectors saw their valuations retreat such that they are scoring well in Sabrient’s growth models (as shown in our next-gen Sabrient Scorecards subscription product)—including large caps like Taiwan Semiconductor (TSM), Broadcom (AVGO), and Spotify (SPOT) that are in the new Q2 2025 Sabrient Baker’s Dozen portfolio, and small caps like Freshworks (FRSH), QuinStreet (QNST), and RingCentral (RNG) that are in our new Sabrient Small Cap Growth 46 portfolio. These portfolios along with Sabrient Dividend 51 (a growth & income strategy yielding 4.05% as of 5/5) are packaged and distributed quarterly to the financial advisor community as unit investment trusts through First Trust Portfolios.

Indeed, rather than the passive cap-weighted indexes dominated by Big Tech, investors may be better served by active stock selection that seeks to identify under-the-radar and undervalued gems primed for explosive growth—many of whom could coattail on the Big Tech names and provide greater returns. This is what Sabrient seeks to do in our various portfolios, all of which provide exposure to Value, Quality, Growth, and Size factors and to both secular and cyclical growth trends.

As a reminder, the “Size” factor refers to market cap and the Fama French study that showed small caps historically tend to outperform over time. Although that has not been the case for the small cap indexes (like Russell 2000) for most of the past 20 years, I still think the small cap universe is where to find the most explosive growth opportunities, even if the broad passive indexes can't keep up. So, insightful active selection is important for small cap investing—which is easier to do given the relative lack of analyst coverage and institutional ownership of small caps.

For each of our portfolios, we seek high-quality, fundamentally strong companies displaying a history of consistent, reliable, and accelerating sales and earnings growth, rising profit margins and free cash flow, solid earnings quality, low debt burden, and a reasonable valuation. Notably, our proprietary Earnings Quality Rank (EQR) is a key factor in each of our growth, value, dividend, and small cap models, and it is also licensed to the actively managed First Trust Long-Short ETF (FTLS).

Sabrient founder David Brown describes these and other factors as well as his portfolio construction process in his latest book. David describes his path from NASA engineer in the Apollo moon landing program to creating quant models for ranking stocks and building stock portfolios. And as a companion product to the book, we have launched next-gen versions of Sabrient Scorecards for Stocks and ETFs. You can learn more about both the book and scorecards by visiting: http://DavidBrownInvestingBook.com.

In my full commentary below, I discuss earnings, gold, tariffs, inflation, global liquidity, the power of free market capitalism, and the imminent “bullish triumvirate” of tariff resolution, tax cuts, and deregulation. I also discuss Sabrient’s latest fundamental-based SectorCast quantitative rankings of the ten U.S. business sectors, current positioning of our sector rotation model, and several top-ranked ETF ideas. Our model likes Technology, Healthcare, Communication Services sectors, and assuming interest rates indeed come down and liquidity rises as I expect, I also like dividend stocks and gold. HERE is a link to this post in printable PDF format.

I had so much to say this month that I decided to defer until next month my in-depth commentary on the exciting new developments in energy and electrical generation. Please contact me to speak on any of these topics at your event!  Read on….

Scott Martindale  by Scott Martindale
  President & CEO, Sabrient Systems LLC

 Key Points:

 1. The country’s 40-year path into a debt & deficit spending spiral was not working and had to change dramatically, not gradually, and the process to fix it is scary and uncomfortable.

2. The president’s “Liberation Day” tariff regime is at once simplistic and perplexing, but the selloff seems overdone, in my view, although the market remains fragile.

3. After an initial price shock, tariffs are deflationary like any tax; and countries are already coming to the table to negotiate them down.

4. The US is much less dependent on trade, less vulnerable to trade disruptions, and in far better position to weather a brief trade war than any other country, including mercantilist China, which is saber-rattling as a Trumpian bargaining tactic and to stoke the flames of political division in our country, in my view.

5. The $10 trillion that left the stock market was not lost like a wildfire burning down homes; it simply rotated into bonds and cash and can quickly rotate back if the outlook does not change and we have fiscal stimulus, supportive Fed, and rising global liquidity.

6. Volatility (up and down) may be sticking around through H1 until clarity improves later in the year.

7. For those still contributing to a 401(k), the selloff has presented a long-awaited opportunity to “buy low.”

8. Investors may be better served by active stock selection, such as Sabrient’s Baker’s Dozen, Small Cap, and Dividend portfolios.

Overview:

The news has been dominated by President Trump’s announced “Liberation Day” regimen of draconian tariffs, which are intended to induce both fairer trade policies from our trading partners and the onshoring of manufacturing. As his words moved from a 10% across-the-board baseline tariff (a nominal amount that initially sent stocks higher) to the gory details of his broader plan, the swan dive commenced. Negative volume went through the roof. Margin calls rained in. Algorithmic trading systems switched from leveraged long to either leveraged short or out of the market completely (thus removing critical liquidity), tripping stop losses and creating a cascade of selling pressure. The next day’s weekly AAII Sentiment Survey hit an extreme 62% bearish reading and will likely fall lower in this week’s survey. IPOs are being put on hold. The Polymarket odds of an emergency rate cut surged to 285, as did the odds of a rate cut meeting (36% at the May FOMC meeting but a 92% lock by the June meeting).

As of Monday morning’s open, the stock market had essentially given back all last year’s gains. Chartists are lamenting the failure of scary-bearish chart patterns (like the dreaded inverse flag pattern) that could potentially send stock indexes all the way down to their pandemic lows. The CBOE Volatility Index (VIX) surged above 45 on Friday 4/4 and then touched 60 in the pre-hours on Monday 4/7, which is reminiscent of the pandemic lockdown five years ago.

But are things today really as bad as that, when global supply chains were paralyzed and people were falling ill (and/or dying) en masse? I would say no, and in just a couple of blood-red, gap-down days, the rapid market meltdown already seems overdone, as I discuss further in today’s post. As famed value investor Ben Graham once said, “In the short run, the market is a voting machine, but in the long run it is a weighting machine.”

Although the VIX certainly could still go higher (perhaps a lot higher) and stocks lower, Friday looked to me a lot like capitulation and perhaps the start of a bottoming process leading to a great (and long-awaited) buying opportunity for long-term investors. Just be careful about “catching a falling knife.” Many countries (reportedly more than 50) have apparently reached out to fix their trade arrangements, although the biggie, China, is still in saber-rattling mode, at least for now.

Of course, the current selloff also was exacerbated by “priced for perfection” valuations and a complacent “buy every dip” mentality, largely driven by AI exuberance (and its promise of transformation disruption and rapid growth in productivity) and the massive capex allocated for AI infrastructure and datacenters. Furthermore, during the run-up to all-time highs in 2024, hedge funds had become more heavily leveraged long in US equities than at any time since the pandemic lockdown (as much 300% leveraged), essentially pulling forward gains from 2025 based on strong earnings expectations. So, there might be some similarities to the dot-com bubble bursting in 2001 in that respect. But even at its recent high, the overvaluation was nowhere near 1999 levels of the dot-com mania, and we don’t have the systemic credit and accounting issues leading into the 2008 Global Financial Crisis. Company balance sheets are quite sound, and although credit spreads have spiked, they remain low on a historical basis.

Even before the 4/2 tariff announcement, stocks were already looking shaky. It was fascinating to watch the charts of the major indexes like the S&P 500 ETF (SPY) and Nasdaq 100 ETF (QQQ) as they struggled for several days to hold support at the 300-day simply moving average, like a sloth hanging from a tree branch, until ultimately losing grip in dramatic fashion following the big tariff announcement. I opined in my March post that it might be time to create a shopping list of stocks but that volatility would likely continue into the tariff target date (4/2) and perhaps into Tax Day (as liquidity draws down for making tax payments). But few (including me) expected the cataclysmic selloff. Volatility may be sticking around for a while until clarity improves, particularly as Q1 earnings season (and forward guidance) kicks off this week.

To be sure, the reality of the new administration’s aggressive policies to fix many long-festering trade issues has caused much consternation and gnashing of teeth, drawn swift retaliation (particularly from China), disrupted global supply chains, lowered corporate earnings estimates, and raised recession risk (both domestically and globally). In response, just like when the so-called “bond vigilantes” short Treasury notes and bonds (or go to cash) in protest of rising budget deficits and total debt, the “stock vigilantes” went to work shorting stocks (or defensively moving to cash or Treasuries, removing market liquidity and briefly driving the 10-year yield below 4.0%) in protest of the uncertain impacts on the economy and corporate earnings. Or as former Democrat turned Trump supporter Batya Ungar-Sargon sees it, “Suddenly, everybody is sitting around saying, ‘Oh, no, the stock market!’ Yeah, the stock market looks like that because the rich [i.e., Wall Street institutional investors and hedge funds] are punishing Trump for siding with the neglected and humiliated American working class over them.” Indeed, the top 10% of Americans by income own 88% of stocks, the next 40% own 12%, and the bottom 50% are shut out.

So, yes, stock portfolios, IRAs, and 401(k) plans are way down, as the evening news keeps telling us. According to Bespoke Investment Group, the Russell 3000 has seen well over $10 trillion in lost market cap since Inauguration Day (1/20). However—and this is an important point—this is not “capital destruction” in the same sense that a wildfire can destroy homes and businesses. The capital pulled from the stock market didn’t vanish from the earth. It simply rotated into cash and bonds. And it very likely will return to stocks once trade situations are ironed out and visibility improves. It might take several months…or it could come back in a hurry. Be prepared. Perhaps start nibbling at stocks now. If you’re like me, you probably received a slew of low-price alerts for your target list. Some speculative investors might be going all-in at current levels. Regardless, for those still contributing to their IRA or 401(k) and not yet drawing on it, this selloff is a gift to be appreciated, in my view, restoring some value back into the market. After all, when you are in long-term accumulation mode, you want to “buy low.”

Of course, no one knows for sure how low it can go and when the selloff will bottom—and the bottoming process may be lengthy and volatile. The wild card for stocks going forward is uncertainty around the severity and duration of tariffs, which seem designed by their sheer audacity to induce a swift resolution. After all, there is no underlying malady in the economy that prevents business leaders and entrepreneurs from adapting like they always do, and only pride and prejudice can prevent a quick resolution to most of the trade arrangements.

Political, economic, and market volatility will surely continue during H1. But even if we get a larger correction than I expect, I continue to believe stocks will soon find support and ultimately give way to a gradual melt-up, sending the market to back near its highs of Q1 by year-end or early-2026, driven by rising global liquidity, a weaker US dollar, reduced wasteful/reckless government spending and regulatory red tape, lower interest and tax rates, massive corporate capex, and the “animal spirits” of a rejuvenated private sector and housing market. So, if you have been hoping and praying for lower prices in risk assets (including stocks and crypto) or for a lower mortgage rate to buy a house, you are getting them now, with the forward P/E on the S&P 500 at 18.7x as of 4/4 (before any significant downward revisions to earnings estimates), versus 22.7x at its February peak. As the poet Virgil once said (in Latin), audentes Fortuna iuvat” — i.e., “fortune favors the bold.”

Because this market correction was led by the bull market-leading MAG-7 stocks and all things AI related, investors now have a second chance to get positions in some of those mega-cap titans at more attractive prices. There remains a persistent sense among global investors of “American exceptionalism” based on ouir entrepreneurial culture, a tenacious focus on building shareholder value, and the mesmerizing appeal of our Big Tech companies that offer disruptive innovation, huge cash positions, reliable and consistently strong earnings growth, free cash flow, margins, return ratios, low interest-rate exposure, global scalability, and wide protective moats.

So, the initial recovery may well be led by the Big Tech titans that are now much more fairly valued, such as NVIDIA (NVDA) at a forward P/E of 21x (as of 4/4). Notably, some of these names have seen their valuations retreat such that they are once again scoring well in Sabrient’s growth models (as found in our next-gen Sabrient Scorecards subscription product)—including names like Amazon (AMZN), NVIDIA (NVDA), Salesforce (CRM), Alphabet (GOOGL), Meta Platforms (META), Microsoft (MSFT), Broadcom (AVGO), Oracle (ORCL), Arista Networks (ANET), Fortinet (FTNT), Palo Alto Networks (PANW), Palantir (PLTR), and Taiwan Semiconductor (TSM)—two of which (TSM and AMZN) are in the Q1 2025 Sabrient Baker’s Dozen.

But longer term, rather than the passive cap-weighted indexes dominated by Big Tech, investors may be better served by active stock selection that seeks to identify under-the-radar and undervalued gems primed for explosive growth—many of whom could coattail on the Big Tech names and provide greater returns. This is what Sabrient seeks to do in our various portfolios, all of which provide exposure to Value, Quality, Growth, and Size factors and to both secular and cyclical growth trends.

As for small caps, which as pointed out by Fama French used to outperform large caps over the long haul (higher risk, higher reward), the small cap indexes have been consistently lagging large cap indexes over the past 20 years, mostly due to their much lower allocation to the Technology sector. For example, the S&P 500 has a massive 17.6% relative overweight to the Tech sector (30.3%) versus the Russell 2000 (12.7%). And if you include the Tech-adjacent MAG-7 names that are categorized as Consumer Discretionary (i.e., Amazon and Tesla totaling 5.3%) and Communications (Alphabet and Meta Platforms totaling 6.4%), the S&P 500 allocation to the MAG-7 is 30.5%, and the combined Tech plus Tech-adjacent allocation is a whopping 42.0%—or a 28.9% relative overweight versus the Russell 2000!

Some might say that small caps are due for a mean reversion versus the S&P 500, but it seems its relative overweight to cyclical sectors like Industrials, Financials, Real Estate, Materials, and Energy (with only noncyclical/secular growth Healthcare having an overweight of 5.9%) rather than to secular growth Technology would make any attempt at mean reversion temporary. Nevertheless, I still think the small cap universe is where to find the most explosive growth opportunities (with the notable exception of large cap names like NVDA), even if the broad passive indexes (like Russell 2000) can't keep up. So, insightful active selection is important for small cap investing—which is easier to do given the relative lack of analyst coverage and institutional ownership of small caps.

We at Sabrient have become best known for our “Baker’s Dozen” portfolio of 13 diverse growth-at-a-reasonable-price (GARP) stocks, which is packaged and distributed quarterly to the financial advisor community as a unit investment trust through First Trust Portfolios, along with three other offshoot strategies based on Value, Dividend, and Small Cap investing. By the way, our Q1 2025 Baker’s Dozen remains in primary market until 4/16, after which time the Q2 portfolio launches. Also, our Small Cap Growth 45 portfolio remains in primary market until 4/21, followed by the launch of Small Cap Growth 46, and Dividend 51 is in primary market paying a 4.25% yield on new purchases.

As a reminder, Sabrient founder David Brown’s new book, How to Build High Performance Stock Portfolios, is available in both paperback and eBook versions on Amazon. And as a companion product to the book, we have launched next-gen versions of Sabrient Scorecards for Stocks and ETFs. You can learn more about the scorecards book and, download a sample scorecard, and sign-up for a free trial subscription—by visiting: http://DavidBrownInvestingBook.com/

In today's post, I examine in detail the new tariff regimen, the case for reducing (but not eliminating) the trade deficit, the liquidity challenge and “debt maturity wall,” and the case for tariffs and trade realignment. You won’t regret reading it through! I also discuss Sabrient’s latest fundamental-based SectorCast quantitative rankings of the ten U.S. business sectors, current positioning of our sector rotation model, and several top-ranked ETF ideas. Here is a link to this post in printable PDF format.  Read on….