Scott Martindale


  by Scott Martindale
  CEO, Sabrient Systems LLC


Quick portfolio update: Sabrient’s Q3 2026 Baker’s Dozen quarterly portfolio launched on 7/20 with a diverse group of 13 stocks across market caps and business sectors, including both prominent and under-the-radar names. Also, the new Sabrient Dividend 57 quarterly portfolio just launched on 8/4 as a growth & income strategy, with a diverse group of 48 high-quality stocks across market caps and sectors and a current yield of 3.8%. Additionally, our annual Forward Looking Value 14 portfolio will launch on 8/26 with a diverse group of high-quality, value-oriented stocks having good growth potential across market caps and sectors.

Overview

There has been outsized investor focus on inflation and the Fed’s response to it—something that new chairman Kevin Warsh is trying to diminish. He has stated, "…market participants are learning to play the ball, not the referee." Warsh has suggested a preference fulfilling the mandate of price stability through a combination of lower policy rates, continued balance sheet reduction, and structural reform of the official inflation metrics (which rely on many lagged, imputed, and low-relevance components). Some observers and several FOMC members say we must have rate hikes to control the inflationary spiral, while others say we need rate cuts to boost the struggling lower leg of our K-shaped economy (lower-income and working-class consumers, small businesses, and housing) and the alarmingly low personal savings rate (2.7% versus a long-term average of 8.3%) that has been supporting personal consumption. Count me in the latter group, as I explain in my full commentary below.

But that’s not stopping the bond vigilantes from boycotting the massive issuance of debt and thus pushing up longer-term rates at an alarming pace, which negatively impacts mortgage rates, corporate borrowing costs, and the discount rate on stock valuations. Uncertainty leads to higher term premiums. It might be not only a protest against rising federal debt but also anticipation of the Fed shrinking its balance sheet (aka QT), which pulls cash (bank reserves) out of the financial system while increasing the supply of bonds in the market (leading to higher yields)—even though the Fed has already reduced its balance sheet by $2.4 trillion (from $9 trillion in 2022) to remove about half its pandemic-era QE accumulation.

As a result, 10-year Treasury yields made another new 18-month high at 4.74% at the end of July, and the 30-year reached its highest yield since 2007 of 5.27%, entirely due to rising real rates not inflation expectations (which remain modest). Although yields pulled back last week on hopeful Iran news, plunging crude oil prices, and weak jobs reports, providing hope of a less restrictive Fed. So, although longer-term yields may well rise further—with the 10-year potentially challenging 5% for the first time in three years—I see this as a buying opportunity for fixed income, such as with iShares 20+ Year Treasury ETF (TLT) with a current yield of 4.75%, particularly if inflation has seen its peak and is pulling back, as I suspect it is.

The federal deficit is now roughly $2 trillion out of a $7 trillion total budget (that’s nearly 30% of the total budget!), which must be financed through Treasury issuance. And roughly half that deficit is interest on debt payments (now exceeding $1 trillion/yr and growing fast), which rises as debt increases, requiring new issuances and debt rollovers—both at higher interest rates than before as the Treasury Dept. has focused on the short end of the yield curve, thus lowering the weighted average maturity of federal debt.

It’s a death spiral rapidly overwhelming the budget, which (as I have discussed at length in many prior posts) must be addressed with a 3-prong approach of: 1) growing away the debt through robust GDP growth given that tax receipts historically average 17% of GDP no matter the tax rates, 2) cutting away the debt through reduced spending growth below the rate of GDP growth and rooting out waste and fraud, and 3) inflating away the debt through elevated inflation rates that reduce the dollar value of the debt.

Meanwhile, the giant hyperscalers are not only spending most or all of the massive cash flows but are also flooding the corporate bond market with as much as $1 trillion for AI infrastructure buildout. So, perhaps part of Warsh’s plan is to let the market do the dirty work of suppressing economic activity by raising longer-term rates—leading to higher mortgage rates, corporate borrowing costs, and the discount rate on stocks valuations—hopefully not to the point of causing a recession.

For now, there is no sign of recession as the Atlanta Federal Reserve’s purely model-driven GDPNow forecast shows an estimate for Q3 real GDP growth of a robust +5.8% as of 8/6 (although the more nuanced consensus of “Blue Chip” economists is only 2.0%). You might recall the forecast showing strong numbers for Q2 with a high of +4.3% in late May before falling to a low of +1.2% in early July, with the final BEA report coming in at just +1.5%. Nonetheless, there was plenty of good in the report, as non-government private spending (consumers and private fixed investment) grew +3.9%.

And although this private spending was offset by 1) falling net exports (as imports surged +11.5%, driven by AI-related components), which alone reduced the final number by 1.01 percentage points (pps), and 2) private inventory drawdowns, which reduced it by 0.67 pps, both of these metrics in fact reflect robust underlying domestic demand, consumer spending, corporate capex, and overall economic activity. Indeed, when high imports and low inventories suppress GDP, it typically suggests impending economic acceleration and revved-up domestic manufacturing, which would boost GDP metrics in subsequent quarters—which the Atlanta Fed’s GDPNow forecast seems to be reflecting.

In my full commentary below, I discuss:

1. The selloff in the AI trade and the restoration of Apple’s prominence
2. Hyperscaler capex, free cash flow, and power demand
3. Solid GDP growth but mixed messages on jobs and housing
4. Trends in inflation, supply chain pressures, and productivity
5. The bond vigilantes, rising federal debt, China’s woes, and Fed policy
6. My final comments section pushing back on the overwrought AI backlash/alarmism
7. Sabrient’s sector rankings, positioning of our sector rotation model, and some top-ranked ETF ideas

With all the turmoil in the AI trade, which was overdue after such a meteoric rise, market leadership continues to broaden and rotate. The fact that the market rotated rather than sell everything and go to cash is encouraging and suggestive of continued bullish conviction. Russell 2000 companies’ earnings growth forecasts for CY2026 have climbed to 38% from about 23% at the beginning of the year—in spite of rising interest rates that tend to have outsized impact on the floating-rate debt typically carried by smaller firms. And the equal-weight S&P 500 ETF (RSP) is approaching $100 billion in AUM, with performance led by many of the “S&P 493” rather than the MAG7.

Chamath Palihapitiya, entrepreneur and All-In Podcast team member, recently quipped, “Fundraising requires narrative, and ‘we are building God’ is a better pitch than ‘we wrote some very clever linear algebra, pirated the internet, and threw a bunch of compute at it.’”  Perhaps that’s what investors reduced it to as they abandoned the AI trade—at least for the moment. And perhaps it is true that our economy has been overly reliant upon AI-led expansion with yet-to-be-proven ROI, especially datacenters.

Indeed, the dollar value of datacenter construction plus computers and communications equipment are up 23% YoY, with the hyperscalers’ capex [in order of dollar commitments: Amazon (AMZN), Microsoft (MSFT), Alphabet (GOOGL), Meta (META), Oracle (ORCL), and now SpaceX (SPCX)] projected to be in the range of $700-800 billion for CY2026 (40% higher than CY2025)—leading to reduced shareholder-friendly buybacks but surging global semiconductor sales. According to the Semiconductor Industry Association, chip sales worldwide were up +123% YoY in the month of June, totaling over $400 billion during Q2, and are expected to exceed $1.5 trillion for CY2026.

That’s a lot of investment to recover. But as Tech executive and investor Nat Friedman opined, “Pessimists sound smart. Optimists make money.” Indeed, longer term, I believe the broad potential ROI of AI—in reshaping our economy and society through massive productivity gains, solving complex scientific and technological challenges, and fundamentally transforming the workplace and daily life—is stronger and materializing faster than anticipated even at the beginning of the year.

The use cases and compute demand for AI have barely begun to manifest, with a future encompassing autonomous transportation, factory automation, humanoid robots, personal assistants for hundreds of millions of individual users, and AI assistance on everything from drones for law enforcement, to surgery and drug discovery, to optimized asset maintenance, smart grid energy, and fraud monitoring—not to mention the associated power demand for it all.

So, am I concerned about whether the massive AI capex by the hyperscalers on infrastructure (like datacenters) and power generation will see attractive ROI anytime soon? I am not. In fact, I bought into the July “tech wreck,” including some names in memory and storage as well as the MAG7 ETF (MAGS), and I bought into the “SaaSpocalypse” in February and again in April via the iShares Tech-Software ETF (IGV). In its earnings report the other day, Palantir (PLTR) described commercial demand as “otherworldly,” and the stock surged 30%. In my view, for anyone who felt they had missed the boat on the AI surge and didn’t want to chase it—this was the pullback you were waiting for.

Of course, there is no guarantee that the market won’t turn tail once again, given the unresolved conflict with Iran and its terrorist proxies and the real potential for reescalation. And besides Iran, a plethora of uncertainties persist with oil prices, shipping and supply chains, trade deals and tariffs, Ukraine, China, Japanese yen, federal debt, civil strife, midterm elections and the unnerving rise of DSA candidates, inflation, jobs, and monetary policy from a revamped Fed. Did I miss anything?

But fundamental tailwinds still outweigh headwinds, in my view, given AI optimism, robust capex, deregulation, lower taxes, re-privatization, re-industrialization (onshoring of manufacturing), diversification of supply chains (not deglobalization), rising productivity/margins/earnings, low credit spreads, and resumed disinflationary trends. Deregulation is focused heavily on encouraging domestic fossil fuel production, less burdensome financial oversight, and less onerous climate rules, mostly to the advantage of Energy, Financials, and Industrials sectors.

Forward P/E multiples have receded largely due to a rising discount rate as bond yields surge. And yet stocks keep going up on the back of incredible earnings growth and fast-rising forward estimates. According to First Trust, “Analyst estimates have increased as the year has unfolded, with Large Cap, Mid Cap, and Small Cap Index EPS estimated to reach a record $354.46, $219.63, and $107.53, respectively, in 2026 (as of 8/3/26) [according to Bloomberg]. For comparison, analyst estimates were much lower at the start of the year, with the same indices estimated to see calendar year 2026 earnings of $310.84, $202.91, and $96.06 (as of 12/31/25).”

Indeed, the S&P 500 is on pace for blended earnings growth in Q2 of 47% versus a forecast of 23% just a few weeks ago. However, if you strip out Amazon (AMZN) and Alphabet (GOOGL), whose incredible earnings reports were largely driven by non-operating gains on investments in Anthropic and SpaceX, the blended S&P 500’s blended EPS growth falls to around 29%, which is still quite impressive.

Overall, given the market broadening beyond the Big Tech titans, and assuming the Fed does not become more hawkish, I continue to see opportunities in active stock selection, as well as in cyclicals, value stocks, small caps, and bond-alternative dividend payers. Indeed, Sabrient’s Baker’s Dozen, Forward Looking Value, Small Cap Growth, and Dividend portfolios have been largely outperforming their benchmarks—some by substantial margins. And as a reminder, our Earnings Quality Rank (EQR) is licensed as a quality prescreen to the actively managed, low-beta First Trust Long-Short ETF (FTLS), which now has nearly $2.5 billion in AUM.

By the way, in my July post, I wrote a long Final Comments section on the alarming rise of socialism, which I would encourage you to read if you haven’t already. Although I acknowledge the disparate impacts of the K-shaped economy, the socialists’ harping on fairness and wealth inequality is largely a red herring as living standards, real incomes, consumption, and life expectancies have generally risen across demographics nationally. It certainly doesn’t warrant dismantling the capitalist system that has created so much innovation, value, wealth, comfort, and good for the world.

The exception to broadly rising living standards seems to lie in many of our deep-blue cities and states. So today, let me also add a comment on the “affordability” issue that has become the main talking point of the Left against the Trump Administration. The reality is that the bluest cities and states tend to have the worst affordability, as reinforced by US News & World Report’s latest 2026 rankings of states that put California dead last in its specific “Affordability” metric, followed by other deep-blue states, namely New Jersey, Hawaii, New York, Washington, Massachusetts, Maryland, and Colorado. It also put California dead last for the broader “Opportunity” category, which comprises the subcategories of Economic Opportunity, Affordability, and Equality across demographic groups.

So, don’t be gaslighted by deceptive electioneering. The answer is not to double down on the same misguided and counterproductive policies—like onerous zoning restrictions and permitting processes, punitive taxation, high energy prices, mandated worker benefits, rent control, sanctuary policies, and permissiveness on crime and homelessness—that have degraded quality of life for everyone while inviting fraud and corruption. Rather, voters should pivot back to embracing free markets, meritocracy, property rights, and the rule of law that built our great country. Such principles have proven much more adept at solving problems than dogmatic bureaucrats, virtually none of whom have any private-sector leadership experience. Affordability is a genuine problem, particularly in several high-cost blue states, and policymakers in these locales shouldn't assume that further expanding redistribution or intervention policies will solve the problems that were likely created by these policies in the first place.

Here is a link to this full post in printable PDF format. As always, I’d love to hear from you! Please feel free to email me your thoughts on this article or if you’d like me to speak on any of these topics at your event!  Read on….

Scott Martindale


  by Scott Martindale
  CEO, Sabrient Systems LLC

 Overview

Bullish conviction was severely tested in November for the first time since the April “Liberation Day” selloff. All the naysayers quickly piled on with warnings of an AI bubble and financial returns on immense capex not being realized for many years, if ever. To make matters worse, they warned of sluggish global liquidity growth in the face of rising debt and an impending “debt maturity wall,” i.e., enormous government and corporate refinancing that could overwhelm capital markets, surge borrowing rates, tighten lending standards, crowd out smaller businesses, and thereby constrain economic growth. But alas, the fear didn’t last long, as the old “bad news is good news” narrative was resurrected to predict increasingly dovish Fed monetary policy would save the day. Indeed, it appears that the S&P 500 still has a shot at finishing 2025 with its third straight year of 20%+ returns (which would be only the second time in history, after the five straight years of the 1995-99 dotcom/Y2K run). And yet the K-shaped economy (i.e., investor/creditor class vs. working/debtor class) is leaving too many citizens behind, particularly young and working-class people.

Remember the famous quote from the fearsome heavyweight champion boxer Mike Tyson, “Everyone has a plan until they get hit in the face”? Well, Steve Forbes had a similar quote for the stock market, “Everyone is a disciplined, long-term investor…until the market goes down.” Indeed, the AI-driven bull run seemed uninterruptable for over six months, with the S&P 500’s 50-day moving average providing reliable support all along the way…at least until 11/17 when for the first time in 138 days (since 4/30) the index closed below its 50-day moving average and triggered a panicky selloff. And then even after another incredible earnings report on 11/19 from market leader NVIDIA (NVDA) that sent the market surging higher on 11/20, by mid-day it came crashing back down on news suggesting maybe the jobs market really wasn’t so bad, which led to worries that the Fed might not cut this month after all, and the market finished the day with a big, ugly, red bearish-engulfing candle. As they say, the more overbought, the worse the correction.

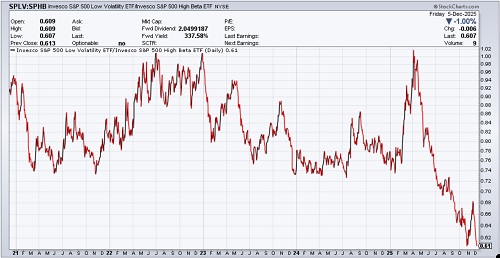
But thankfully, that big, bad, bearish-engulfing candle turned out to be a double-bottom (with the 10/10 low). The S&P 500 found support at its 100-day moving average and then embarked on a rally that has almost entirely retraced its fall from October’s all-time high. It has largely been a speculative “junk rally,” led by the “meme” stocks—like the Roundhill Meme Stock ETF (MEME) and the iShares Micro-cap ETF (IWC), followed by the lower-quality small-cap iShares Russell 2000 (IWM), in which about 40% are unprofitable, then the higher-quality small-cap SPDR S&P 600 (SPSM), in which all are required to be profitable for index entry, and with the mid and large caps trailing behind. Defensives have lagged since April, as illustrated in the chart below showing the ratio of the S&P 500 Low Volatility (SPLV) divided by the S&P 500 High Beta (SPHB), which after a brief jump during the November pullback has returned to its extreme low.

SPLV:SPHB ratio chart

Interestingly, the stock market briefly added a new member of the $1 trillion market cap club during the broad market correction, with drugmaker Lilly & Co. (LLY) enjoying a huge November surge (along with much of the Healthcare sector overall, in a mean reversion catch-up), largely driven by sales in its weight-loss drug Zepbound. So, as LLY pulled back, the trillion-dollar club today is back to 10 members—the original MAG-7 (NVDA, AAPL, GOOGL, MSFT, AMZN, META, TSLA) plus Broadcom (AVGO), Taiwan Semi (TSM), and Berkshire Hathaway (BRK.B).

Short-term technicals on the broad market indexes are overbought once again but still well supported within a bullish uptrend. Nevertheless, for the S&P 500 to hit the 20% return mark for the year will require a bullish catalyst. Most likely it will be the highly anticipated Fed rate cut this week, and importantly, some soothingly dovish words from chairman Jay Powell on additional easing measures plus guidance on the “dot plot” of future rate cuts. However, he can’t be overly dovish as to bring out the “bond vigilantes” in protest, spiking longer-term yields, which would not be favorable for stocks. Market maven Jim Bianco said in an interview on The Money Path that he thinks the tell will be in the number of FOMC member dissents on the expected rate cut, with several dissenters mollifying the bond vigilantes and no dissent angering them. So, Powell walks a tightrope on this, and messaging matters.

Regardless, the liquidity cycle is turning back up, with the Fed already halting its balance sheet reduction (quantitative tightening or QT) as of 12/1, and with more rate cuts in the offing, plus perhaps relaxed capital requirements for banks (like the enhanced supplementary leverage ratio or eSLR) and some form of "QE-lite" to gradually re-expand its balance sheet without antagonizing the bond market. All of this should result in rising M2 money supply. In addition, China has introduced fiscal stimulus and monetary tactics like repurchase operations (“repo”) and a lowered bank reserve requirement ratio (RRR). Furthermore, supply chain pressures are muted, fiscal expansion is underway with lower tax rates and less red tape from the One Big Beautiful Bill Act (OBBBA), and money market funds (aka cash on the sidelines) exceed $8 trillion (the highest ever).

In fact, the Atlanta Fed’s GDPNow is projecting real GDP growth of 3.5% growth in Q3, and forecasters think Q1 2026 might see US growth above 4% given the imminent fiscal impulse (including massive tax refunds in Q1) that should boost the struggling consumer. So, aggregate demand would be expected to rise, likely above the rate of aggregate supply since demand can shift much faster than supply can adjust to match. This would lift asset prices initially, which could be inflationary. As such, some market commentators believe the fed funds neutral rate should match the current rate of nominal GDP growth of 5-6%.

I’m not one of those people. I think any short-term inflationary pressures will be fleeting and offset by the secular disinflationary pressures I often describe: Global Supply Chain Pressure Index (GSCPI) continues to hover at or below the zero line (i.e., its historical average), the benefits of globalization (including comparative advantage) persist despite some strategic onshoring and supply chain diversification, there is a deflationary impulse from China as its dumps cheap goods on the world market in the face of weak domestic demand, and productivity continues to increase through automation and disruptive innovation (including Gen AI).

So, my long-held view remains that a terminal/neutral rate near 3.0% seems right, and the latest fed funds futures suggest 66% odds we get there next year—and that likelihood should increase with the appointment of a new Fed chairman in May (most likely economist Kevin Hassett). Bond yields have normalized with the 10-year Treasury under 4.2%. The flatter yield curve is a market signal to the Fed that it should cut on the short end. The economy needs lower interest rates, including a 30-year mortgage closer to 5%, in tandem with business-friendly fiscal policy and a weaker dollar to: a) sustain rising global liquidity, b) relieve indebted consumers and businesses, c) support US and global economies, and d) avert a global credit crisis. And once that neutral rate is achieved, the Fed can go back into the shadows where it was always intended to be and let fiscal, trade, and tax policies from Congress and the President dominate the news cycle. No more sitting on pins-and-needles at every FOMC meeting or Fed governor speaking engagement.

The return of the “bad news is good news” outlook has fed funds futures solidified at 89% odds of a December cut on 12/10. It also has pushed stocks to within spitting distance of new all-time highs. But notably, bitcoin and other cryptocurrencies corrected much more sharply than stocks, mostly due to deleveraging, and have not yet bounced back like stocks have. Nevertheless, blockchain, tokenization, and stablecoin implementation continue to progress, so I’m not concerned about my crypto allocation—in fact, bitcoin might have just put in a bottom at its 100-week moving average.

Yes, uncertainty persists around trade deals, wars, rising debt, civil strife, stock valuations, a hesitant Fed, and potential government shutdown redux in late January. But investors are positioning for tax and interest rate cuts, deregulation, tame inflation, strong margins & earnings, improving revenue growth, re-privatization, re-industrialization, fast-tracking of power generation infrastructure, robust capex and share buybacks, rising liquidity, a potential “peace dividend,” and a continued flow of foreign capital into the US. Importantly, DataTrek pointed out that Q3 corporate revenue increased by a multi-year record of +8.4%, which is critical for future earnings power—as earnings growth via sales growth is better than cost cutting (higher quality earnings beats). Also, they point out that the percentage of after-tax operating earnings that paid for dividends and stock buybacks has fallen from 96% in 2018 to 81% today, which suggests the difference is being reinvested in business growth—and supports today’s elevated valuations.

In my full commentary below, I talk in greater depth about the K-shaped economy, electricity prices, earnings, debt, inflation, jobs, and Fed policy, as well as the difficulty in “turning the economic ship”—from overreliance on vast, stifling government spending to a robust, unleashed private sector—in the face of political obstructionism, a hostile media, and the impatience of voters in feeling the benefits of the newly passed fiscal stimulus package and the Fed’s monetary stimulus on affordability and mortgage rates, pushing many of them (especially young people and the lower-income/non-asset-holding working class) to shortsightedly embrace the “free stuff” promises of socialist candidates.

I close my commentary by revealing Sabrient’s latest fundamental-based SectorCast quantitative rankings of the ten U.S. business sectors, current positioning of our sector rotation model, and several top-ranked ETF ideas. Top-ranked sectors in Sabrient’s SectorCast model include Technology, Healthcare, and Financials. In addition, Basic Materials, Industrials, and Energy also seem poised to eventually benefit from fiscal and monetary stimulus, domestic capex tailwinds, a burgeoning commodity Supercycle, rising demand for natural gas for power generation, and more-disciplined capital spending programs.

History shows that rising GDP growth, stable inflation, and falling interest rates tend to favor small caps. And because small cap indexes are more heavily allocated to Industrials, Basic Materials, and Financials, enhanced infrastructure spending and a revved-up economy could disproportionately benefit them. Indeed, rather than a continuation of the FOMO/YOLO momentum rally on the backs of a narrow group of AI leaders (and some speculative coattail riders), I expect the euphoria will be more tempered next year such that we get a healthy broadening and wider participation across caps and sectors and with a greater focus on quality and profitability. There are plenty of neglected high-quality names worthy of investment dollars. So, rather than the passive cap-weighted indexes, investors may be better served by active stock selection that seeks to identify under-the-radar, undervalued, high-quality gems primed for explosive growth. This is what Sabrient seeks to do in our various portfolios, all of which provide exposure to Value, Quality, Growth, and Size factors and to both secular and cyclical growth trends.

Concerningly, only 22% of active fund managers are outperforming their passive benchmark this year, largely due to the narrow market leadership from the AI-leading Big Tech titans. However, Sabrient has been performing well. We are best known for our 13-stock “Baker’s Dozen” growth portfolio franchise, which is issued quarterly as a 15-month unit investment trust (UIT) by First Trust Portfolios, and each is designed to offer the potential for outsized gains. For example, the Q1 2024 Baker’s Dozen terminated on 4/21/25 with a gross return of +45.7% vs. +8.2% for S&P 500, and the Q3 2024 portfolio terminated on 10/20/25 up +41.7% vs. +24.1% for S&P 500.

In addition, last year’s 33-stock Forward Looking Value 12 terminated on 11/10/25 up +19.9% vs. +12.7% for the S&P 500 Value Index. Also, small caps tend to benefit most from lower rates and deregulation, and high dividend payers become more appealing as bond alternatives as interest rates fall, so Sabrient’s quarterly Small Cap Growth and Sabrient Dividend (growth & income strategy) also might be timely as beneficiaries of a broadening market.

The Baker’s Dozen growth portfolio and three offshoot strategies for value, dividend, and small cap all leverage Sabrient’s process-driven, growth-at-a-reasonable-price methodology, which was developed by founder David Brown. All four strategies are described in his latest book, Moon Rocks to Power Stocks: Proven Stock Picking Method Revealed by NASA Scientist Turned Portfolio Manager (catch the low-price promotion this week only!). To learn more about both the book and the companion subscription product we offer (which does most of the stock evaluation work for you), please visit: https://DavidBrownInvestingBook.com

Click HERE to find this post in printable PDF format, as well as my latest Baker’s Dozen presentation slide deck and my 3-part series on “The Future of Energy, the Lifeblood of an Economy.” As always, I’d love to hear from you! Please feel free to email me your thoughts on this article or if you’d like me to speak on any of these topics at your event!  Read on….
Scott Martindale


  by Scott Martindale
  CEO, Sabrient Systems LLC

 Overview

The full pullback/correction I have been anticipating remains elusive. After all, stocks can’t go straight up forever, and this bull run has become long in the tooth. The greater the divergence, the worse the potential correction. Ever since the market recovered from its April “Liberation Day” tariff-driven selloff, every attempt at a correction or consolidation has been quickly bought before it could get started. But last week seemed different. It was Nasdaq’s worst week since April, and all the AI-driven market exuberance seemed to have suddenly shifted to fears of a valuation bubble. Alas, fear not. It seems to have been nothing more than another brief pause to refresh—i.e., take some profits off the table, reassess fundamentals versus sentiment, shake out the weak holders (including momentum traders), test technical support levels, and shore-up bullish conviction…punctuated by a nice bounce off the 50-day moving average.

Even on October 10, when the S&P 500 fell 2.7% on President Trump’s announcement of massive tariffs on Chinese imports and China’s retaliatory export restrictions on rare earth elements, the market began its recovery the next day. Besides Big Tech, speculative “meme” stocks were also hot. And to further illustrate the speculation, the Russell Microcap Index (IWC) has been performing in line with the S&P 500, setting a new all-time high in October (for the first time since 2021). It is notable that the lower-quality Russell 2000 Small-cap Index (IWM), in which over 40% of the companies in the index are unprofitable, has been substantially outperforming (+10.6% vs. +4.3% YTD) the higher-quality S&P 600 SmallCap (SPSM), in which all stocks are required to show consistent profitability for index admission.

So, it was only a matter of time for bears to try again to push the market lower, especially given the growing set of headwinds (described in my full commentary below). During last week’s selloff, we saw the CBOE Volatility Index (VIX) surge above 20 (fear threshold) as traders deleveraged. Bitcoin dropped below $100,000 for the first time since June (a 20% correction from its all-time high in October). The CNN Fear & Greed Index dipped into Extreme Fear category. State Street’s Risk Appetite Index showed Big Money refraining from risk assets for the first time since mid-May. And Warren Buffett’s Berkshire Hathaway’s (BRK.B) cash reserves hit yet another record high of $382 billion, as valuations had become too pricey for the “Oracle of Omaha.” But at its low last Friday, the S&P 500 was only down about 4.2% from its peak.

Market breadth remains a concern. While the mega caps kept rising, we have seen only occasional glimpses of nascent rotation, including this week in which the Dow Industrials (DIA), Dow Transports (IYT), and equal-weight S&P 500 (RSP) have all significantly outperformed the S&P 500 and Nasdaq 100. But each prior attempt this year at broadening across sectors and market caps has been short-lived. Only 22% of active fund managers are beating their passive benchmark. Investech noted that from an historical perspective, the Nasdaq Composite has hit a new all-time high with 2:1 negative breadth (decliners/advancers) only twice in its 54-year history—once just prior to the 2022 bear market and once several days ago. Notably, bitcoin and other cryptocurrencies corrected much more sharply than stocks, mostly due to deleveraging, and have not yet bounced back like stocks have. Nevertheless, blockchain, tokenization, and stablecoin implementation continue to progress, so I’m not concerned about my crypto allocation.

The S&P 500, Nasdaq 100, and Dow Jones Industrials each successfully tested support at their 50-day moving averages and then quickly recaptured and retested support at their 20-day moving averages this week as the government shutdown moved toward resolution. But leadership this week has noticeably swung to the Dow Industrials (notably, not cap-weighted), which is the first to get back above its all-time high, and the Dow Transports are getting close, which according to Dow Theory would confirm the bull market. Also, the small-cap Russell 2000 is on the verge of recovering its 20-day average. Notably, gold, silver, and copper have also recovered above their 20-day moving averages and seem bent on reaching new highs.

In essence, I would characterize the latest pullback as a passing “macro scare” within a structural bull market, with some promising new signs of healthy market rotation, and I still think the S&P 500 will achieve another 20%+ return for 2025—for the third year in a row, which would be only the second time in history other than the 5-year (1995-99) dotcom/Y2K bull run.

So, looking ahead, should we expect all rainbows, unicorns, blue skies, and new highs through 2026? Well, while there surely will be more macro scares, more consolidation, and more retests of bullish conviction ahead of the seasonal Santa Claus rally, I believe the fundamental tailwinds greatly outweigh the headwinds, as I discuss in my full commentary below. The government shutdown is over, at least until the end of January. Investors remain optimistic about AI capex and productivity gains, a trade deal with China, a more dovish Fed, business-friendly fiscal policies, deregulation, fast-tracking of power generation infrastructure and strategic onshoring, a stable US dollar, and foreign capital flight into the US (capital tends to flow to where it is treated best). And lower interest rates will lead to more consumer spending, business borrowing for investment/capex, earnings growth, and stock buying (including retail, institutional, and corporate share buybacks). Indeed, the 10-2 Treasury yield spread stands at about 50 bps today, which is consistent with past periods of continued US economic expansion. 

However, while retail investors have continued to invest aggressively, institutional investors and hedge funds (the so-called “smart money”) have grown more defensive and deleveraged. So, maintaining a disciplined approach—such as focusing on fundamental analysis, long-term trends, and clear investment goals—can protect against emotional kneejerk overreactions during murky or turbulent periods.

On that note, remember that stock valuations are dependent upon expectations for economic growth, corporate earnings, and interest rates, tempered by the volatility/uncertainty of each—which manifests in the equity risk premium (ERP, i.e., earnings yield minus the risk-free rate) and the market P/E multiple. Some commentators suggest that every 25-bp reduction in interest rates allows for another 1-point increase in the P/E multiple of the S&P 500; however, those expected rate cuts over the next several months might already be baked into the current market multiple for the S&P 500 and Nasdaq 100 such that further gains for the broad indexes might be tied solely to earnings growth—driven by both revenue growth and margin expansion (from productivity and efficiency gains and cost cutting)—rather than multiple expansion.

Broad, cap-weighted market indexes like the S&P 500 and Nasdaq 100 essentially have become momentum indexes, given their huge concentration in AI-driven, Big Tech mega-caps. So, although growth stocks and crypto may well lead the initial recovery through year end, longer term, rather than a resumption of the FOMO/YOLO momentum rally on the backs of a narrow group of AI leaders (and some speculative companies that ride their coattails), I expect the euphoria will be more tempered in 2026 such that we get a healthy broadening and wider participation across caps and sectors and with a greater focus on quality and profitability. There are plenty of neglected high-quality names out there worthy of investment dollars.

As I discuss in my full commentary, top-ranked sectors in Sabrient’s SectorCast model include Technology, Healthcare, and Financials. In addition, Basic Materials, Industrials, and Energy also seem poised to eventually benefit from fiscal and monetary stimulus, domestic capex tailwinds, a burgeoning commodity Supercycle, rising demand for natural gas for power generation, and more-disciplined capital spending programs.

As such, although near-term market action might remain risk-on into year end, led by growth stocks, the case for value stocks today might be framed as countercyclical, mean reversion, portfolio diversification, and market broadening/rotation into neglected large, mid, and small caps, many of which display a solid earnings history and growth trajectory as well as low volatility, better valuations, and less downside risk, with greater room for multiple expansion. On 10/30, I published an in-depth post detailing the case today for value investing titled, “Is the market finally ready for a value rotation?” in which I discussed three key drivers: 1) mean reversion on extreme relative valuations, 2) diversification of portfolios that have become heavily titled to growth, and 3) sticky inflation benefiting real assets and cyclical/value sectors. So, perhaps the time is ripe to add value stocks as a portfolio diversifier, such as the Sabrient Forward Looking Value Portfolio (FLV 13), which is only offered annually as a unit investment trust by First Trust Portfolios and remains in primary market only until Friday, 11/14.

In addition, small caps tend to benefit most from lower rates and deregulation, and high-dividend payers become more appealing as bond alternatives as interest rates fall, so Sabrient’s quarterly Small Cap Growth and Dividend portfolios also might be timely as beneficiaries of a broadening market—in addition to our all-seasons Baker’s Dozen growth-at-a-reasonable-price (GARP) portfolio, which always includes a diverse group of 13 high-potential stocks, including a number of under-the-radar names identified by our models.

So, rather a continued capital flow into the major cap-weighted market indexes, which are dominated by mega-caps, growth, and technology, a healthy market rotation would suggest equal-weight, value, dividend, strategic beta, factor-weight, small/mid-caps, other sectors, and actively managed funds. Indeed, I believe we are being presented with an opportunity to build diversified portfolios having much better valuations and less downside than the S&P 500. In actively selecting diversified stocks for our portfolios (which are packaged and distributed as UITs by First Trust Portfolios), Sabrient seeks high-quality, undervalued, often under-the-radar gems for our various portfolios—starting with a robust quantitative model followed by a detailed fundamental analysis and selection process—while providing exposure to value, quality, growth, and size factors and to both secular and cyclical growth trends.

The Q4 2025 Baker’s Dozen launched on 10/17 is off to a good start, led by mid-cap industrial Flowserve (FLS) among its 13 diverse holdings, as is our annual Forward Looking Value 13 portfolio, led by mid-cap rideshare provider Lyft (LYFT) among its 28 diverse holdings. In fact, most of our 20 live portfolios are doing well versus their relevant benchmarks. And for investors concerned about lofty valuations and a potential spike in market volatility, low-beta and long/short strategies might be appropriate, such as the actively managed First Trust Long-Short ETF (FTLS), which licenses Sabrient’s proprietary Earnings Quality Rank (EQR) as a quality prescreen.

You can find our EQR score along with 8 other proprietary factors for roughly 4,000 US-listed stocks in our next-generation Sabrient Scorecards, which are powerful digital tools that rank stocks and ETFs using our proprietary factors. You can learn more about them by visiting: http://HighPerformanceStockPortfolios.com.

In today’s full post, I discuss in greater depth this year’s speculative rally and mega-cap leadership, whether the AI trade has gotten ahead of itself, market headwinds versus tailwinds, inflation indicators (in the absence of government data), and reasons to be optimistic about stocks. I also reveal Sabrient’s latest fundamental-based SectorCast quantitative rankings of the ten U.S. business sectors, current positioning of our sector rotation model, and several top-ranked ETF ideas.

Click HERE to find this post in printable PDF format, as well as my latest Baker’s Dozen presentation slide deck and my 3-part series on “The Future of Energy, the Lifeblood of an Economy.” As always, I’d love to hear from you! Please feel free to email me your thoughts on this article or if you’d like me to speak on any of these topics at your event!  Read on….
Scott Martindale  by Scott Martindale
  President & CEO, Sabrient Systems LLC

Monthly commentary on the economy, inflation, Fed policy, stock valuations, global events, Sabrient’s SectorCast rankings, sector rotation model positioning, and top-ranked ETF ideas.

Summary:

  1. I remain skeptical of the official, government reports on jobs, GDP, and inflation, which are not passing my “smell test” and what I consider to be the illusion of a robust economy and jobs market, as GDP and jobs growth have been overly reliant on government deficit spending and hiring, which is both unhealthy and unsustainable.
     
  2. Rising asset prices have been largely driven by a strong dollar, rising global liquidity, and capital flight into the US (most of which does not show up in M2 money supply), which comes at the expense of the rest of the world’s growth. It also creates a “wealth effect” here that lifts US consumer price inflation even though global supply chain pressures are low.
     
  3. Somewhat elevated inflation in the 2-3% range can be desirable to help address our enormous federal debt as part of a 3-pronged attack:  inflate away the debt, cut government waste and spending, and grow our way out of debt by stimulating organic private-sector-led productivity and economic growth with business-friendly Trump 2.0 fiscal policy and deregulation.
     
  4. Overall, Trump 2.0 policies combined with a dovish Fed should be good for stocks, but bond prices will be more stagnant, in my view, with yields staying around current levels. I continue to suggest investors buy stocks in high-quality businesses at reasonable prices, hold inflation and dollar hedges like gold and bitcoin, and be prepared to exploit any market correction for further gains through 2025 and beyond, fueled by massive capex in blockchain and AI applications, infrastructure, and energy.
     
  5. Sabrient’s latest fundamental-based SectorCast quantitative rankings of the ten U.S. business sectors is topped by Technology, Financials, and Consumer Discretionary. I also discuss the current positioning of our sector rotation model and several top-ranked ETF ideas.
     
  6. Sabrient is best known for our “Baker’s Dozen” portfolio franchise and our process-driven, growth-at-a-reasonable-price methodology, which Sabrient founder David Brown describes in his latest book, How to Build High Performance Stock Portfolios, along with his value, dividend, and small cap portfolio strategies.

    Each Baker’s Dozen is designed to be held for 15 months as a unit investment trust. Notably, although the mega-cap-dominated S&P 500 has been so tough to beat, the next Baker’s Dozens to terminate will be the Q4 2023 portfolio on 1/21, which is up about +49% (vs. +47% for SPY), and the Q1 2024 portfolio on 4/21, which is up about +95% (vs. +27% for SPY), as of 12/6.

    To learn more about both the book and the companion subscription product we offer (which does most of the stock evaluation work for you), please visit: https://DavidBrownInvestingBook.com

Click HERE to continue reading my full commentary online or to sign up for email delivery of this monthly market letter. Also, here is a link to this post in printable PDF format. I invite you to share it as appropriate (to the extent your compliance allows).

Scott Martindale  by Scott Martindale
  President & CEO, Sabrient Systems LLC

It would be an understatement to say that last week was particularly eventful, what with the elections and FOMC policy decision, plus some impressive earnings announcements. Election Day is finally behind us, and the results sent investors into a fit of stock market FOMO—in one of the greatest post-election rallies ever—while dumping their bonds. Much like the day after President Trump’s win in 2016, the leading sectors were cyclicals: Industrials, Energy, Financials. And then on Fed Day, markets got their locked-in 25-bp rate cut, and the rally kept going across all risk assets, including strengthening the US dollar on the expectation of accelerating capital flight into the US as Trump’s policies, particularly with support from a Republican-led congress, should be quite business-friendly, with lower tax rates and red tape and much less focus on anti-trust lawfare.

So, there was a lot for investors to absorb last week, and this week brings the October CPI and PPI reports. Indeed, the whole world has been pining for clarity from the US—and they got it. And I’m sure no one misses the barrage of political ads and bitter electioneering. Hopefully, it marks the peak in election divisiveness our society will ever see again. Notably, inflation hedges gold and bitcoin have suddenly diverged, with gold pulling back from its all-time high while bitcoin—which can be considered both a dollar hedge and a risk asset for its utility—has continued its surge to new highs (now over $85k as I write!) on the added optimism around Trump’s crypto-friendly stance.

Besides expectations of a highly aggressive 15% earnings growth in the S&P 500 over the next couple of years, venture capital could be entering a boom following four years of difficulty in raising capital. In an interview with Yahoo Finance, Silicon Valley VC Shervin Pishevar opined, “I think there’s going to be a renaissance of innovation in America…It’s going to be exciting to see… AI is going to accelerate so fast we’re going to reach AGI [Artificial General Intelligence, or human-like thinking] within the next 2-3 years. I think there will be ‘Manhattan Projects’ for AI, quantum computing, biotech.”

It all sounds quite appealing, but there’s always a Wall of Worry for investors, and the worry now is whether Trump’s pro-growth policies like reducing tax rates, deregulation, rooting out government waste and inefficiency (i.e., “drain the swamp”) combined with his more controversial intentions like tariffs, mass deportations of cheap migrant labor, and threats to Big Pharma, the food industry, and key trading partners (including Mexico)—in concert with a dovish Fed—will create a resurgence in inflation and unemployment and push the federal debt and budget deficit to new heights before the economy is ready to stand on its own—i.e., without the massive federal deficit spending and hiring we saw under Biden—thus creating a period of stagflation and perhaps a credit crisis. Rising interest rates and a stronger dollar are creating tighter financial conditions and what Michael Howell of CrossBorder Capital calls “a fast-approaching debt maturity wall” that adds to his concerns that 2025 might prove tougher for investors if the Global Liquidity cycle peaks and starts to decline.

But in my view, the end goals of shrinking the size and scope of our federal government and restoring a free, private-sector-driven economy are worthy, and we can weather any short-term pain along the way and perhaps fend off that looming “debt maturity wall.” Nevertheless, given the current speculative fervor (“animal spirits”) and multiple expansion in the face of surging bond yields (i.e., the risk-free discount rate on earnings streams), it might be time to exercise some caution and perhaps put on some downside hedges. Remember the old adage, “Stocks take the stairs up and the elevator down” (be sure to read my recent post with 55 timeless investing proverbs to live by).

In any case, at the moment, I believe the stock market has gotten a bit ahead of itself with frothy valuations and extremely overbought technical conditions (with the major indexes at more than two standard deviations above their 50-day moving averages). But I think any significant pullback or technical consolidation to allow the moving averages to catch up would be a buying opportunity into year-end and through 2025, and perhaps well into 2026—assuming the new administration’s policies go according to plan. As DataTrek Research pointed out, there is plenty of dry powder to buy stocks as cash balances are high (an average of 19.2% of institutional portfolios vs.10-15% during the bull market of the 2010’s).

This presumes that the proverbial “Fed Put” is indeed back in play. Also, I continue to believe that rate normalization means the FOMC ultimately taking the fed funds rate down to a terminal rate of about 3.0-3.5%—although I’m now leaning toward the higher side of that range as new fiscal policy from the “red wave” recharges private-sector growth (so that GDP and jobs are no longer reliant on government deficit spending and hiring) and potentially reignites some inflationary pressures.

This is not necessarily a bad thing. Although inflation combined with stagnant growth creates the dreaded “stagflation,” moderate inflation with robust growth (again, driven by the private sector rather than the government) can be healthy for the economy, business, and workers while also helping to “inflate away” our massive debt. Already, although supply chain pressures remain low, inflation has perked up a bit recently, likely due to rising global liquidity and government spending, as I discuss in detail in today’s post.

So, my suggestions remain: Buy high-quality businesses at reasonable prices, hold inflation hedges like gold and bitcoin, and be prepared to exploit any market correction—both as stocks sell off (such as by buying out-of-the-money put options, while VIX is low) and as they begin to rebound (by buying stocks and options when share prices are down). A high-quality company is one that is fundamentally strong (across any market cap) in that it displays consistent, reliable, and accelerating sales and earnings growth, positive revisions to Wall Street analysts’ consensus estimates, rising profit margins and free cash flow, solid earnings quality, and low debt burden. These are the factors Sabrient employs in selecting the growth-oriented Baker’s Dozen (our “Top 13” stocks), the value-oriented Forward Looking Value, the growth & income-oriented Dividend portfolio, and Small Cap Growth. We also use many of those factors in our SectorCast ETF ranking model. And notably, our Earnings Quality Rank (EQR) is a key factor in each of these models, and it is also licensed to the actively managed, absolute-return-oriented First Trust Long-Short ETF (FTLS).

Each of our key alpha factors and their usage within Sabrient’s Growth, Value, Dividend, and Small Cap investing strategies (which underly those aforementioned portfolios) is discussed in detail in Sabrient founder David Brown’s new book, How to Build High Performance Stock Portfolios, which is now available to buy in both paperback and eBook formats on Amazon.com.

David Brown's book link

And in conjunction with David’s new book, we are also offering a subscription to our next-generation Sabrient Scorecard for Stocks, which is a downloadable spreadsheet displaying our Top 30 highest-ranked stock picks for each of those 4 investing strategies. And as a bonus, we also provide our Scorecard for ETFs that scores and ranks roughly 1,400 US-listed equity ETFs. Both Scorecards are posted weekly in Excel format and allow you to see how your stocks and ETFs rank in our system…or for identifying the top-ranked stocks and ETFs (or for weighted combinations of our alpha factors). You can learn more about both the book and the next-gen Scorecards (and download a free sample scorecard) at http://DavidBrownInvestingBook.com.

In today’s post, I dissect in greater detail GDP, jobs, federal debt, inflation, corporate earnings, stock valuations, technological trends, and what might lie ahead for the stock market with the incoming administration. I also discuss Sabrient’s latest fundamental-based SectorCast quantitative rankings of the ten U.S. business sectors, current positioning of our sector rotation model, and several top-ranked ETF ideas. And be sure to check out my Final Thoughts section in which I offer my post-mortem on the election.

Click HERE to continue reading my full commentary or to sign up for email delivery of this monthly market letter. Also, here is a link to this post in printable PDF format. I invite you to share it as appropriate (to the extent your compliance allows).

Scott Martindale  by Scott Martindale
  President & CEO, Sabrient Systems LLC

The S&P 500 rose 20.8% during the first three quarters of 2024, which is its best start since 1997 and the best for any presidential election year in history. Moreover, for perspective, the ratio of US stock market capitalization to the global stock market has risen from 30% in 2009 (following the GFC) to almost 50% today. This has happened despite escalation in multiple wars, numerous catastrophic weather events ravaging the country, a highly contentious election tearing apart friends and families, strapped consumers (after 25%+ cumulative inflation over the past few years), falling consumer confidence, and jobs and GDP growth over-reliant on government deficit spending, with national debt approaching $35.7 trillion and rising $2 trillion/year (as debt carrying costs alone cost over $1 trillion/year). Even over the past several days when oil prices spiked above $75/bbl (on sudden escalation in the Middle East conflict) and bond yields surged (with the 10-year reaching 4.05%), the major indexes continue to hold near their highs.

As investor Howard Lindzon (of StockTwits fame) said the other day, “There is a fear trade happening (e.g., gold and bitcoin) while there is growth trade happening. It’s really mind-boggling.” Indeed, many of the most prominent investors are wary, including the likes of Warren Buffett, Jamie Dimon, and Jeff Bezos, and corporate insider buying has slowed.

I’m not an economist. I started my career as a structural engineer with Chevron Corporation, then earned an MBA in night school and moved into the business side of the company before venturing into the world of investment research. But as a long-time student of the economy and capital markets, combined with my critical-thinking nature and engineering training, I’ve developed a healthy skepticism of numbers presented to me, even from supposedly objective sources like the government. They have to pass the “smell test.”

Of course, the Fed has been basing its monetary policy primarily on metrics calculated by federal agencies regarding inflation, jobs, and GDP. But headline YoY numbers can be illusory—particularly when they are propped up by massive government deficit spending. So, I like to look beyond the headline numbers. For inflation, my skepticism of official numbers (with the long lag times of key components, like shelter cost, and distorted metrics like “owner’s equivalent rent,” which is highly subjective and based on surveys of homeowners) is why I seek alternative metrics like: 1) the annualized rolling 3-month average of month-over-month price changes (which better reflects current trends), 2) a European method (quietly published by the BLS since 2006) called the Harmonized Index of Consumer Prices (HICP), and 3) the real-time, blockchain-based Truflation, which is published daily.

My skepticism was further elevated when I saw the jobs, retail sales, and ISM Services metrics all suddenly perk up in September—right before the election after a lengthy period of decline and contrary to several negative developments like a record divergence between rising consumer credit card debt and falling personal savings and The Conference Board’s Consumer Confidence dropping to the bottom of its 2-year range and showing increasing pessimism about labor market conditions.

On the other hand, it is notable that Truflation also has risen quickly over the past couple of weeks to nearly 2.0% YoY, so could this be corroborating the apparent rise in consumer demand? Could it be that the Fed’s dovish pivot and 50-bps rate cut has suddenly emboldened consumers to start spending again and businesses to ramp up hiring? Or are my suspicions correct such that we are in store for more downward revisions on some these rosy metrics post-election? After all, the last set of major revisions in early September showed not just an over-reliance on government jobs and government-supported jobs (through targeted spending bills), but the August household survey showed 66,000 fewer employed than in August 2023, 609,000 more “”part-time for economic reasons,” and 531,000 more “part time for noneconomic reasons,” which implies 1.2 million fewer full-time jobs in August 2024 versus August 2023.

Then along came the big 254,000 jobs gain in the September report that made investors so giddy last week, and the household survey showed 314,000 more employed workers than in September of last year. However, digging into the numbers, there are 555,000 more “”part-time for economic reasons” and 389,000 more “part time for noneconomic reasons,” which suggests 630 million fewer full-time jobs in September 2024 versus September 2023, so it’s no surprise that the average weekly hours worked also fell. Furthermore, government spending (and the growing regulatory state) continues to account for much of the hiring as government jobs have soared by 785,000 (seasonally adjusted) over this 12-month timeframe, which was the largest month-over-month (MoM) gain on record. Also, workers holding multiple jobs hit an all-time high. And notably, native-born workers have lost 1.62 million net jobs since their peak employment in July 2023 while foreign-born workers have gained 1.69 million over the same period.

Hmmm. I continue to see the GDP and jobs growth numbers as something of a mirage in that they have been propped up by government deficit spending (which our leaders euphemistically call “investment”). As you recall, leading into the September FOMC announcement I had been pounding the table on the need for a 50-bps rate cut, which we indeed got. Many observers, and at least one Fed governor, believe it was a mistake to go so big, but as I discussed in my post last month, recessionary pressures were mounting despite the impressive headline numbers, and the pain felt by our trading partners from high US interest rates and a strong dollar essentially required some agreement among the major central banks, particularly Japan and China, to weaken the dollar and thus allow an expansion in global liquidity without inciting capital flight to the US. And the PBOC soon did exactly that—slashing its reserve requirement ratio (RRR), cutting its benchmark interest rate, and loosening scores of rules regarding mortgages and the property market—which has restrengthened the dollar after its summer decline.

Of course, cutting taxes and regulation is the best way to unleash the private sector, but it's often argued that a tax cut without a corresponding reduction in spending only serves to increase the budget deficit and add to the federal debt. In fact, I saw a Harris campaign commercial with an average guy named “Buddy” lamenting that it’s “not cool” with him that Trump would give “billionaires” a tax break because they should “pay their fair share.” But Buddy and Harris both need to know what DataTrek Research has observed—i.e., since 1960, regardless of individual and corporate tax rates, federal receipts have averaged 17% of GDP. This means that raising taxes stunts GDP growth while cutting taxes boosts GDP growth by leaving more money in the pockets of consumers, business owners, and corporations to spend and invest with the wisdom of a free and diverse marketplace (Adam Smith’s “invisible hand”). In other words, the path to rising tax revenues is through strong economic growth—and the best return on capital comes from the private sector, which has proven itself much more adept at determining the most efficient allocation of capital rather than Big Government’s top-down picking of winners and losers, like a politburo.

Nevertheless, given the Fed’s dovish pivot (and despite the “heavy hand” of our federal government), I continue to expect higher prices by year end and into 2025. Bond credit spreads remain tight (i.e., no fear of recession), and although the CBOE Volatility Index (VIX) is back above the 20 “fear threshold,” it is far from panic levels. So, I believe any “October surprise” that leads to a pre-election selloff—other than a cataclysmic “Black Swan” event—would likely be a welcome buying opportunity, in my view. But besides adding or maintaining exposure to the dominant MAG-7 titans—which provide defensive qualities (due to their disruptive innovation and wide moats) as well as long-term appreciation potential—I think other stocks may offer greater upside as the economic cycle continues its growth run and market rotation/broadening resumes.

So, my suggestions are to buy high-quality businesses at reasonable prices on any pullback, hold inflation hedges like gold and bitcoin, and be prepared to exploit any credit-related panic—both as stocks sell off (such as by buying out-of-the-money put options while VIX is low) and before they rebound (when share prices are low). Regardless, I continue to recommend high-quality, fundamentally strong stocks across all market caps that display consistent, reliable, and accelerating sales and earnings growth, positive revisions to Wall Street analysts’ consensus estimates, rising profit margins and free cash flow, solid earnings quality, and low debt burden. These are the factors Sabrient employs in selecting the growth-oriented Baker’s Dozen (our “Top 13” stocks), the value-oriented Forward Looking Value, the growth & income-oriented Dividend portfolio, and Small Cap Growth, which is an alpha-seeking alternative to a passive position in the Russell 2000.

We also use many of those factors in our SectorCast ETF ranking model. And notably, our Earnings Quality Rank (EQR) is a key factor in each of these models, and it is also licensed to the actively managed, absolute-return-oriented First Trust Long-Short ETF (FTLS).

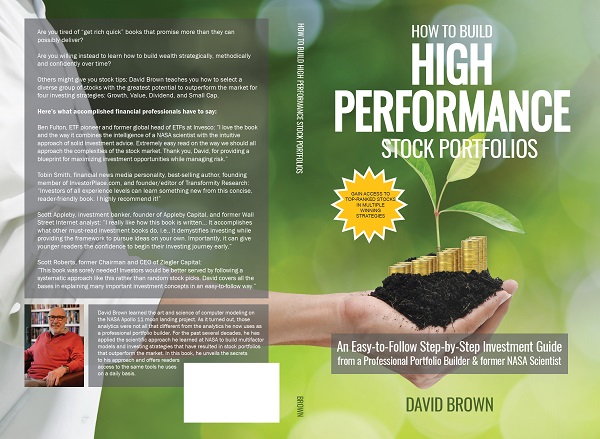
Each of our key alpha factors and their usage within Sabrient’s Growth, Value, Dividend, and Small Cap investing strategies (which underly those aforementioned portfolios) is discussed in detail in Sabrient founder David Brown’s new book, How to Build High Performance Stock Portfolios, which is now available for pre-order on Amazon at a special pre-order price.

David Brown's book cover

And in conjunction with David’s new book, we are also offering a subscription to our next-generation Sabrient Scorecard for Stocks, which is a downloadable spreadsheet displaying our Top 30 highest-ranked stock picks for each of those 4 investing strategies. And as a bonus, we also provide our Scorecard for ETFs that scores and ranks roughly 1,400 US-listed equity ETFs. Both Scorecards are posted weekly in Excel format and allow you to see how your stocks and ETFs rank in our system…or for identifying the top-ranked stocks and ETFs (or for weighted combinations of our alpha factors). You can learn more about both the book and the next-gen Scorecards (and download a free sample scorecard) at http://DavidBrownInvestingBook.com.

In today’s post, I discuss in greater detail the current trend in inflation, Fed monetary policy, stock valuations, technological trends, and what might lie ahead for the stock market. I also discuss Sabrient’s latest fundamental-based SectorCast quantitative rankings of the ten U.S. business sectors, current positioning of our sector rotation model, and several top-ranked ETF ideas. And be sure to check out my Final Thoughts section with a few off-topic comments on the imminent election and escalating Middle East conflict.

Click here to continue reading my full commentary online or to sign up for email delivery of this monthly market letter. Also, here is a link to this post in printable PDF format. I invite you to share it as appropriate (to the extent your compliance allows).

Scott Martindale  by Scott Martindale
  President & CEO, Sabrient Systems LLC

Falling inflation, weak manufacturing activity, cautious consumer sentiment, and sluggish GDP and jobs growth have conspired to elicit a dovish tone from the Federal Reserve and the likely start of a rate cut cycle to avert recession and more jobs losses. I continue to pound the table that the Fed is behind the curve and should have begun to cut at the July meeting.

Why? Well, here are my key reasons:

1. Although official inflation metrics still reflect lingering “stickiness” in consumer prices, my research suggests that real-time inflation is already well below the Fed’s 2% target, as I discuss in detail in today’s post.

2. Last week’s BLS jobs report shows 66,000 fewer employed workers in August 2024 versus 12 months ago after massive downward revisions to prior reports. And if you dig deeper into the August household survey it gets worse, indicating a whopping 1.2 million fewer full-time jobs (yikes!), partially offset by a big growth in part-time jobs.

3. The mirage of modest GDP and jobs growth has been temporarily propped up by unhealthy and inefficient government deficit spending (euphemistically called “investment”) rather than true and sustainable organic growth from a vibrant private sector that is adept at efficient capital allocation. Thus, despite government efforts to “buy” growth, recessionary signals are growing at home and abroad.

4. The burden caused by elevated real interest rates on surging debt across government, business, consumers at home and emerging markets abroad, and the impact of tight monetary policy and a relatively strong dollar on our trading partners must be confronted.

So, a 50-bps cut at the September FOMC meeting next week seems warranted—even if it spooks the markets. As Chicago Fed president Austan Goolsbee said, “You only want to stay this restrictive for as long as you have to, and this doesn’t look like an overheating economy to me.”

A terminal fed funds neutral rate of 3.0-3.5% seems appropriate, in my view, which is roughly 200 bps below the current range of 5.25-5.50%). Fortunately, today’s lofty rate means the Fed has plenty of potential rate cuts in its holster to support the economy while remaining relatively restrictive in its inflation fight. And as long as the trend in global liquidity is upward (which it is once again), then it seems the risk of a major market crash is low.

Regarding the stock market, as the Magnificent Seven (MAG-7) mega-cap Tech stocks continue to flounder, markets have displayed some resilience since the cap-weighted S&P 500 and Nasdaq 100 both topped in mid-July, with investors finding opportunities in neglected market segments like financials, healthcare, industrials, and defensive/higher-dividend sectors utilities, real estate, telecom, and staples—as well as gold (as both a store of value and protection from disaster). However, economic weakness, “toppy” charts, and seasonality (especially in this highly consequential election year) all suggest more volatility and downside ahead into October.

Of course, August was tumultuous, starting with the worst one-day selloff since the March 2020 pandemic lockdown followed by a moon-shot recovery back to the highs for the S&P 500 (SPY) and S&P 400 MidCap (MDY), while the Dow Jones Industrials (DIA) surged to a new high. However, the Nasdaq 100 (QQQ) and Russell 2000 SmallCap (IWM) only partially retraced their losses. And as I said in my August post, despite the historic spike in the CBOE Volatility Index (VIX), it didn’t seem like the selloff was sufficient to shake out all the weak investors and form a solid foundation for a bullish rise into year end. I said that I expected more downside in stocks and testing of support before a tradeable bottom was formed, especially given uncertainty in what the FOMC will do on 9/18 and what the elections have in store.

In addition, September is historically the worst month for stocks, and October has had its fair share of selloffs (particularly in presidential election years). And although the extraordinary spike in fear and “blood in the streets” in early August was fleeting, the quick bounce was not convincing. The monthly charts remain quite extended (“overbought”) and are starting to roll over after August’s bearish “hanging man” candlestick—much like last summer. In fact, as I discussed in my post last month, the daily price pattern for the S&P 500 in 2024 seems to be following 2023 to a T, which suggests the weakness (like last year) could last into October before streaking higher into year end. Anxiety around a highly consequential election on 11/5 (with counting of mail-in ballots likely to last several days beyond that once again) will surely create volatility.

Many commentators believe the Fed is making a policy mistake, but it goes both ways. Some believe the Fed is turning dovish too quickly because inflation is sticky, the jobs market is fine, and GDP is holding up well, so it risks reigniting inflation. Others (like me) think the FOMC is reacting too slowly because the economy, jobs growth, and inflation are weaker than the mirage they seem, masked by inordinate government deficit spending, misleading headline metrics, and political narratives. As Fed Chair Jerome Powell said at the July meeting, “The downside risks to the employment mandate are now real,” and yet the FOMC still chose to hold off on a rate cut. Now it finds itself having to commence an easing cycle with the unwanted urgency of staving off recession rather than a more comfortable “normalization” objective within a sound economy.

Indeed, now that we are past Labor Day, it appears the “adults” are back in the trading room. As I discuss in detail in today’s post, economic metrics seem to be unraveling fast, stocks are selling off, and bonds are getting bought—with the 2-10 yield curve now “un-inverted” (10-year yield exceeds the 2-year). So, let’s get moving on rate normalization. After all, adjusting the interest rate doesn’t flip a switch on economic growth and jobs creation. It takes time for lower rates and rising liquidity to percolate and reverse downward trends, just as it took several months for higher rates and stagnant liquidity to noticeably suppress inflation. Fed funds futures today put the odds of a 50-bps cut at about 27%.

Nevertheless, stock prices are always forward-looking and speculative with respect to expectations of economic growth, corporate earnings, and interest rates, so prices will begin to recover before the data shows a broad economic recovery is underway. I continue to foresee higher prices by year end and into 2025. Moreover, I see current market weakness setting up a buying opportunity, perhaps in October. But rather than rushing back into the MAG-7 stocks exclusively, I think other stocks offer greater upside. I would suggest targeting high-quality, fundamentally strong stocks across all market caps that display consistent, reliable, and accelerating sales and earnings growth, positive revisions to Wall Street analysts’ consensus estimates, rising profit margins and free cash flow, solid earnings quality, and low debt burden. These are the factors Sabrient employs in selecting the growth-oriented Baker’s Dozen (our “Top 13” stocks), the value-oriented Forward Looking Value, the growth & income-oriented Dividend portfolio, and Small Cap Growth, which is an alpha-seeking alternative to a passive position in the Russell 2000.

We also use many of those factors in our SectorCast ETF ranking model. And notably, our Earnings Quality Rank (EQR) is a key factor in each of these models, and it is also licensed to the actively managed, absolute-return-oriented First Trust Long-Short ETF (FTLS) as an initial screen. Each of our alpha factors and their usage within Sabrient’s Growth, Value, Dividend, and Small Cap investing strategies is discussed in detail in Sabrient founder David Brown’s new book, How to Build High Performance Stock Portfolios, which will be published shortly.

In today’s post, I discuss in greater detail the current trend in inflation, Fed monetary policy, and what might lie ahead for the stock market as we close out a tumultuous Q3. I also discuss Sabrient’s latest fundamental-based SectorCast quantitative rankings of the ten U.S. business sectors, current positioning of our sector rotation model, and several top-ranked ETF ideas. And be sure to check out my Final Thoughts section with some political comments—here’s a teaser: Democrats have held the presidency for 12 of the past 16 years since we emerged from the Financial Crisis, so all these problems with the economy, inflation, immigration, and global conflict they promise to “fix” are theirs to own.

Click here to continue reading my full commentary online or to sign up for email delivery of this monthly market letter. And here is a link to it in printable PDF format. I invite you to share it as appropriate (to the extent your compliance allows).

Scott Martindale  by Scott Martindale
  President & CEO, Sabrient Systems LLC

July saw new highs for the broad market indexes followed by a big fall from grace among the Magnificent Seven (MAG-7) stocks. But it looked more like a healthy rotation than a flight to safety, with a broadening into neglected market segments, as inflation and unemployment metrics engendered optimism about a dovish policy pivot from the Federal Reserve. The rotation of capital within the stock market—as opposed to capital flight out of stocks—kept overall market volatility modest. But then along came the notorious month of August. Is this an ominous sign that the AI hype will come crashing down as the economy goes into a recession? Or is this simply a 2023 redux—another “summer sales event” on stock prices—with rate cuts, accelerating earnings, and new highs ahead? Let’s explore the volatility spike, the reset on valuations, inflation trends, Fed policy, and whether this is a buying opportunity.

Summary

Up until this month, a pleasant and complacent trading climate had been in place essentially since the Federal Reserve announced in Q4 2023 its intended policy pivot, with a forecast of at least three rate cuts. But August is notorious for its volatility, largely from instability on the trading floor due to Wall Street vacations and exacerbated by algorithmic (computer-based) trading systems. In my early-July post, I wrote that I expected perhaps a 10% correction this summer and added, “the technicals have become extremely overbought [with] a lot of potential downside if momentum gets a head of steam and the algo traders turn bearish.” In other words, the more extreme the divergence and euphoria, the harsher the correction.

Indeed, last Monday 8/5 saw the worst one-day selloff since the March 2020 pandemic lockdown. From its all-time high on 7/16 to the intraday low on Monday 8/5 the S&P 500 (SPY) fell -9.7%, and the Technology Select Sector SPDR (XLK) was down as much as -20% from its 7/11 high. The CBOE Volatility Index (VIX) hit a colossal 67.73 at its intraday peak (although tradable VIX futures never came close to such extremes). It was officially the VIX’s third highest reading ever, after the financial crisis in 2008 and pandemic lockdown in 2020. But were the circumstances this time around truly as dire as those two previous instances? Regardless, it illustrates the inherent risk created by such narrow leadership, extreme industry divergences, and high leverage bred from persistent complacency (including leveraged short volatility and the new zero-day expiry options).

The selloff likely was ignited by the convergence of several issues, including weakening economic data and new fears of recession, a concern that the AI hype isn’t living up to its promise quite fast enough, and a cautious Fed that many now believe is “behind the curve” and making a policy mistake by not cutting rates. (Note: I have been sounding the alarm on this for months.) But it might have been Japan at the epicenter of this financial earthquake when the Bank of Japan (BoJ) suddenly hiked its key policy rate and sounded a hawkish tone, igniting a “reverse carry trade” and rapid deleveraging. I explain this further in today’s post.

Regardless, by week’s end, it looked like a non-event as the S&P 500 and Nasdaq 100 clawed back all their losses from the Monday morning collapse. So, was that it for the summer correction? Are we all good now? I would say no. A lot of traders were burned, and it seems there is more work for bulls to do to prove a bottom was established. Although the extraordinary spike in fear and “blood in the streets” was fleeting, the quick bounce was not convincing, and the monthly charts look toppy—much like last summer. In fact, as I discuss in today’s post, the market looks a lot like last year, which suggests the weakness could potentially last into October. As DataTrek opined, “Investor confidence in the macro backdrop was way too high and it may take weeks to fully correct this imbalance.”

Stock prices are always forward-looking and speculative with respect to expectations of economic growth, corporate earnings, and interest rates. The FOMC held off on a rate cut at its July meeting even though inflation is receding and recessionary signals are growing, including weakening economic indicators (at home and abroad) and rising unemployment (now at 4.3%, after rising for the fourth straight month). Moreover, the Fed must consider the cost of surging debt and the impact of tight monetary policy and a strong dollar on our trading partners. On the bright side, the Fed no longer sees the labor market as a source of higher inflation. As Fed Chair Jerome Powell said, “The downside risks to the employment mandate are now real.” 

The real-time, blockchain-based Truflation metric (which historically presages CPI) keeps falling and recently hit yet another 52-week low at just 1.38%; Core PCE ex-shelter is already below 2.5%; and the Fed’s preferred Core PCE metric will likely show it is below 2.5% as well. So, with inflation less a worry than warranted and with corporate earnings at risk from the economic slowdown, the Fed now finds itself having to start an easing cycle with the urgency of staving off recession rather than a more comfortable “normalization” objective within a sound economy. As Chicago Fed president Austan Goolsbee said, “You only want to stay this restrictive for as long as you have to, and this doesn’t look like an overheating economy to me.”

The Fed will be the last major central bank in the West to launch an easing cycle. I have been on record for months that the Fed is behind the curve, as collapsing market yields have signaled (with the 10-year Treasury note yield falling over 80 bp from its 5/29 high before bouncing). It had all the justification it needed for a 25-bp rate cut at the July FOMC meeting, and I think passing on it was a missed opportunity to calm global markets, weaken the dollar, avert a global currency crisis, and relieve some of the burden on highly indebted federal government, consumers, businesses, and the global economy. Indeed, I believe Fed inaction forced the BoJ rate hike and the sudden surge in US recession fears, leading to last week’s extreme stock market weakness (and global contagion).

In my view, a terminal fed funds “neutral” rate of 3.0-3.5% (roughly 200 bps below the current “effective” rate of 5.33%) seems appropriate. Fortunately, today’s lofty rate means the Fed has plenty of potential rate cuts in its holster to support the economy while still remaining relatively restrictive in its inflation fight. And as long as the trend in global liquidity is upward, then the risk of a major market crash this year is low, in my view. Even though the Fed has kept rates “higher for longer” throughout this waiting game on inflation, it has also maintained liquidity in the financial system, which of course is the lifeblood of economic growth and risk assets. Witness that, although corporate credit spreads surged during the selloff and market turmoil (especially high yield spreads), they stayed well below historical levels and fell back quickly by the end of the week.

So, I believe this selloff, even if further downside is likely, should be considered a welcome buying opportunity for long-term investors, especially for those who thought they had missed the boat on stocks this year. This assumes that the proverbial “Fed Put” is indeed back in play, i.e., a willingness to intervene to support markets (like a protective put option) through asset purchases to reduce interest rates and inject liquidity (aka quantitative easing). The Fed Put also serves to reduce the term premium on bonds as investors are more willing to hold longer-duration securities.

Longer term, however, is a different story, as our massive federal debt and rampant deficit spending is not only unsustainable but potentially catastrophic for the global economy. The process of digging out of this enormous hole will require sustained, solid, organic economic growth (supported by lower tax rates), modest inflation (to devalue the debt without crippling consumers), and smaller government (restraint on government spending and “red tape”), in my view, as I discuss in today’s post.

In buying the dip, the popular Big Tech stocks got creamed. However, this served to bring down their valuations somewhat, their capital expenditures and earnings growth remains robust, and hedge funds are generally underweight Tech, so this “revaluation” could bode well for a broader group of Tech stocks for the balance of the year. Rather than rushing back into the MAG-7, I would suggest targeting high-quality, fundamentally strong stocks across all market caps that display consistent, reliable, and accelerating sales and earnings growth, positive revisions to Wall Street analysts’ consensus estimates, rising profit margins and free cash flow, solid earnings quality, and low debt burden. These are the factors Sabrient employs in selecting our growth-oriented Baker’s Dozen, value-oriented Forward Looking Value (which just launched on 7/31), growth & income-oriented Dividend portfolio, and the Small Cap Growth (an alpha-seeking alternative to a passive position in the Russell 2000).

We also use many of those factors in our SectorCast ETF ranking model. And notably, our Earnings Quality Rank (EQR) is a key factor in each of these models, and it is also licensed to the actively managed, absolute-return-oriented First Trust Long-Short ETF (FTLS) as an initial screen.

Each of our alpha factors and their usage within Sabrient’s Growth, Value, Dividend income, and Small Cap investing strategies is discussed in detail in Sabrient founder David Brown’s new book, How to Build High Performance Stock Portfolios, which will be published this month (I will send out a notification).

Click here to continue reading my full commentary, in which I go into greater detail on the economy, inflation, monetary policy, valuations, and Sabrient’s latest fundamental-based SectorCast quantitative rankings of the ten U.S. business sectors, current positioning of our sector rotation model, and several top-ranked ETF ideas. Also, here is a link to this post in printable PDF format. I invite you to share it as appropriate (to the extent compliance allows). You also can sign up for email delivery of this periodic newsletter at Sabrient.com.

Scott Martindale  by Scott Martindale
  President & CEO, Sabrient Systems LLC

The first half of 2024 looked a lot like the first half of 2023. As you recall, H1 2023 saw a strong stock market despite only modest GDP growth as inflation metrics fell, and H2 2023 continued on the same upward path for stocks despite a slowdown in inflation’s retreat, buoyed by robust GDP growth. Similarly, for H1 2024, stocks have surged despite a marked slowdown in GDP growth (from 4.1% in the second half of 2023 to an estimated 1.5% in the first half of 2024) and continued “stickiness” in inflation—causing rate-cut expectations to fall from 7 quarter-point cuts at the start of the year to just 2 at most.

And yet stocks have continued to surge, with 33 record highs this year for the S&P 500 through last Friday, 7/5. Of course, it is no secret that the primary driver of persistent market strength, low volatility (VIX in the mid-12’s), and an extreme low in the CBOE put/call ratio (around 0.50) has been the narrow leadership of a handful of dominant, innovative, mega-cap Tech titans and the promise of (and massive capital expenditures on) artificial intelligence. But while the S&P 500 is up +17.4% YTD and Nasdaq 100 +21.5% (both at all-time highs), the small cap indexes are flat to negative, with the Russell 2000 languishing -14% below its June 2021 all-time high.

Furthermore, recessionary signals abound. GDP and jobs growth are slowing. Various ISM indexes have fallen into economic contraction territory (below 50). Q2 earnings season kicks off in mid-July amid more cuts to EPS estimates from the analyst community. Given a slowing economy and falling estimates, it’s entirely possible we will see some high-profile misses and reduced forward guidance. So, investors evidently believe that an increasingly dovish Fed will be able to revive growth without revving up inflation.

But is this all we have to show for the rampant deficit spending that has put us at a World War II-level ratio of 120% debt (nearly $35 trillion) to GDP (nearly $29 trillion)? And that doesn’t account for estimated total unfunded liabilities—comprising the federal debt and guaranteed programs like Social Security, Medicare, employee pensions, and veterans’ benefits—estimated to be around $212 trillion and growing fast, not to mention failing banks, municipal pension liabilities, and bankrupt state budgets that might eventually need federal bailouts.

Moreover, the federal government “buying” jobs and GDP in favored industries is not the same as private sector organic growth and job creation. Although the massive deficit spending might at least partly turn out to be a shrewd strategic investment in our national and economic security, it is not the same as incentivizing organic growth via tax policies, deregulation, and a lean government. Instead, we have a “big government” politburo picking and choosing winners and losers, not to mention funding multiple foreign wars, and putting it all on a credit card to be paid by future generations. I have more to say on this—including some encouraging words—in my Final Comments section below.

As for inflation, the Fed’s preferred gauge, Core Personal Consumption Expenditures (PCE, aka Consumer Spending), for May was released on 6/28 showing a continued downward trend (albeit slower than we all want to see). Core PCE came in at just +0.08% month-over-month (MoM) from April and +2.57% YoY. But Core PCE ex-shelter is already below 2.5%, so as the lengthy lag in shelter cost metrics passes, Core PCE should fall below 2.5% as well, perhaps as soon as the update for June on 7/26, which could give the Fed the data it needs to cut. By the way, the latest real-time, blockchain-based Truflation rate (which historically presages CPI) hit a 52-week low the other day at just 1.83% YoY.

In any case, as I stated in my June post, I am convinced the Fed would like to starting cutting soon—and it may happen sooner than most observers are currently predicting. Notably, ever since the final days of June—marked by the presidential debate, PCE release, various jobs reports, and the surprising results in Europe and UK elections, the dollar and the 10-year yield have both pulled back—perhaps on the view that rate cuts are indeed imminent. On the other hand, the FOMC might try to push it out as much as possible to avoid any appearance of trying to impact the November election. However, Fed chair Powell stated last week that the committee stands ready to cut rates more aggressively if the US labor market weakens significantly (and unemployment just rose above the magic 4-handle to 4.1%)—so it appears the investor-friendly “Fed put” is back in play, which has helped keep traders bullishly optimistic. The June readings for PPI and CPI come out later this week on 7/11-12, and July FOMC policy announcement comes out on 7/31.

And as inflation recedes, real interest rates rise. As it stands today, I think the real yield is too high—great for savers but bad for borrowers, which would suggest the Fed is behind the curve. The current fed funds rate is roughly 3% above the CPI inflation forecast, which means we have the tightest Fed interest rate policy since before the 2008 Global Financial Crisis (aka Great Recession). This tells me that the Fed has plenty of room to cut rates and still maintain restrictive monetary policy.

As I have said many times, I believe a terminal fed funds rate of 3.0-3.5% would be the appropriate level so that borrowers can handle the debt burden while fixed income investors can receive a reasonable real yield.

Nevertheless, even with rates still elevated today, I believe any significant pullback in stocks (which I still think is coming before the November election, particularly in light of the extraordinarily poor market breadth) would be a buying opportunity. It’s all about investor expectations. As I’ve heard several commentators opine, the US, warts and all, is the “best house in a lousy [global] neighborhood.” I see US stocks and bonds (including TIPS) as good bets, particularly as the Fed and other central banks inject liquidity. But rather than chasing the high-flyers, I suggest sticking with high-quality, fundamentally strong stocks, displaying accelerating sales and earnings and positive revisions to Wall Street analysts’ consensus estimates.

By “high quality,” I mean fundamentally strong companies with a history of, and continued expectations for, consistent and reliable sales and earnings growth, upward EPS revisions from the analyst community, rising profit margins and free cash flow, solid earnings quality, and low debt burden. These are the factors Sabrient employs in selecting our growth-oriented Baker’s Dozen (primary market for the Q2 portfolio ends on 7/18), value-oriented Forward Looking Value portfolio, growth & income-oriented Dividend portfolio, and our Small Cap Growth portfolio (an alpha-seeking alternative to a passive position in the Russell 2000), as well as in our SectorCast ETF ranking model. Notably, our Earnings Quality Rank (EQR) is a key factor in each of these models, and it is also licensed to the actively managed, absolute-return-oriented First Trust Long-Short ETF (FTLS) as an initial screen.

Each of these alpha factors and how they are used within Sabrient’s Growth, Value, Dividend income, and Small Cap investing strategies is discussed in detail in David Brown’s new book, How to Build High Performance Stock Portfolios, which will be out shortly (I will send out a notification soon!).

In today’s post, I provide a detailed commentary on the economy, inflation, valuations, Fed policy expectations, and Sabrient’s latest fundamentals based SectorCast quantitative rankings of the ten U.S. business sectors, current positioning of our sector rotation model heading into earnings season, and several top-ranked ETF ideas.

Click here to continue reading my full commentary. Or if you prefer, here is a link to this post in printable PDF format. I invite you to share it with your friends, colleagues, and clients (to the extent compliance allows). You also can sign up for email delivery of this periodic newsletter at Sabrient.com.

Scott Martindale  by Scott Martindale
  President & CEO, Sabrient Systems LLC

StocksThe S&P 500 fell more than 5% over the first three weeks of April (it’s largest pullback since last October). Bonds also took it on the chin (as they have all year), with the 2-year Treasury yield briefly eclipsing 5%, which is my “line in the sand” for a healthy stock market. But the weakness proved short-lived, and both stocks and bonds have regained some footing to start May. During the drawdown, the CBOE Volatility Index (VIX), aka fear index, awakened from its slumber but never closed above the 20 “panic threshold.”

In a return to the “bad news is good news” market action of yore, stocks saw fit to gap up last Friday as the US dollar weakened and stocks, bonds, and crypto all caught a nice bid (with the 10-year yield falling 30 bps)—on the expectation of sooner rate cuts following the FOMC’s softer tone on monetary policy and a surprisingly weak jobs report. So, the cumulative “lag effects” of quantitative tightening (QT), falling money supply, and elevated interest rates finally may be coming to roost. In fact, Fed chairman Jay Powell suggested that any sign of weakening in inflation or employment could lead to the highly anticipated rate cuts—leaving the impression that the Fed truly wants to start cutting rates.

But I can’t help but wonder whether that 5% pullback was it for the Q2 market correction I have been predicting. It sure doesn’t seem like we got enough cleansing of the momentum algo traders and other profit-protecting “weak holders.” But no one wants to miss out on the rate-cut rally. Despite the sudden surge in optimism about rates, inflation continues to be the proverbial “fly in the ointment” for rate cuts, I believe we are likely to see more volatility before the Fed officially pivots dovish, although we may simply remain in a trading range with downside limited to 5,000 on the S&P 500. Next week’s CPI/PPI readings will be crucial given that recent inflation metrics have ticked up. But I don’t expect any unwelcome inflationary surprises, as I discuss in today’s post.

The Fed faces conflicting signals from inflation, unemployment, jobs growth, GDP, and the international impact of the strong dollar on the global economy. Its preferred metric of Core PCE released on 4/26 stayed elevated in March at 2.82% YoY and a disheartening 3-month (MoM) rolling average of 4.43%. But has been driven mostly by shelter costs and services. But fear not, as I see a light at the end of the tunnel and a resumption of the previous disinflationary trend. Following one-time, early-year repricing, services prices should stabilize as wage growth recedes while labor demand slows, labor supply rises, productivity improves, and real disposable household income falls below even the lowest pre-pandemic levels. (Yesterday, the San Francisco Fed reported that American households have officially exhausted all $2.1 trillion of their pandemic-era excess savings.) Also, rental home inflation is receding in real time (even though the 6-month-lagged CPI metrics don’t yet reflect it), and inflation expectations of consumers and businesses are falling. Moreover, Q1 saw a surge in oil prices that has since receded, the Global Supply Chain Pressure Index (GSCPI) fell again in April. So, I think we will see Core PCE below 2.5% this summer. The Fed itself noted in its minutes that supply and demand are in better balance, which should allow for more disinflation. Indeed, when asked about the threat of a 1970’s-style “stagflation, the Fed chairman said, "I don't see the stag or the 'flation."

The Treasury's quarterly refunding announcement shows it plans to borrow $243 billion in Q2, which is $41 billion more than previously projected, to continue financing our huge and growing budget deficit. Jay Powell has said that the fiscal side of the equation needs to be addressed as it counters much of the monetary policy tightening. It seems evident to me that government deficit spending has been a key driver of GDP growth and employment—as well as inflation.

And as if that all isn’t enough, some commentators think the world is teetering on the brink of a currency crisis, starting with the collapse of the Japanese yen. Indeed, Japan is in quite the pickle with the yen and interest rates, which is a major concern for global financial stability given its importance in the global economy. Escalating geopolitical tensions and ongoing wars are also worrisome as they create death, destruction, instability, misuse of resources, and inflationary pressures on energy, food, and transportation prices.

All of this supports the case for why the Fed would want to start cutting rates (likely by mid-year), which I have touched on many times in the past. Reasons include averting a renewed banking crisis, fallout from the commercial real estate depression, distortion in the critical housing market, the mirage of strong jobs growth (which has been propped up by government spending and hiring), and of course the growing federal debt, debt service, and debt/GDP ratio (with 1/3 of the annual budget now earmarked to pay interest on the massive and rapidly growing $34 trillion of federal debt), which threatens to choke off economic growth. In addition, easing financial conditions would help highly indebted businesses, consumers, and our trading partners (particularly emerging markets). Indeed, yet another reason the Fed is prepared to cut is that other central banks are cutting, which would strengthen the dollar even further if the Fed stood pat. And then we have Japan, which needs to raise rates to support the yen but doesn’t really want to, given its huge debt load; it would be better for it if our Federal Reserve cuts instead.

So, the Fed is at a crossroads. I still believe a terminal fed funds rate of 3.0% would be appropriate so that borrowers can handle the debt burden while fixed income investors can receive a reasonable real yield (i.e., above the inflation rate) so they don’t have to take on undue risk to achieve meaningful income. As it stands today, assuming inflation has already (in real time, not lagged) resumed its downtrend, I think the real yield is too high—i.e., great for savers but bad for borrowers.

Nevertheless, I still believe any significant pullback in stocks would be a buying opportunity. As several commentators have opined, the US is the “best house in a lousy (global) neighborhood.” In an investment landscape fraught with danger nearly everywhere you turn, I see US stocks and bonds as the place to be invested, particularly as the Fed and other central banks restore rising liquidity (Infrastructure Capital Advisors predicts a $2 trillion global injection to make rates across the yield curve go down). But I also believe they should be hedged with gold and crypto. According to Michael Howell of CrossBorder Capital, a strong dollar will still devalue relative to gold and bitcoin when liquidity rises, and gold price tends to rise faster than the rise in liquidity—and bitcoin has an even higher beta to liquidity. Ever since Russia invaded Ukraine on 2/24/2022 and was sanctioned with confiscation of $300 billion in reserves, central banks around the world have been stocking up, surging gold by roughly +21% and bitcoin +60%, compared to the S&P 500 +18% (price return). During Q1, institutions bought a record 290 tons, according to the World Gold Council (WGC).

With several trillions of dollars still sitting defensively in money market funds, we are nowhere near “irrational exuberance” despite somewhat elevated valuations and the ongoing buzz around Gen AI. At the core of an equity portfolio should be US large cap exposure (despite its significantly higher P/E versus small-mid-cap). But despite strong earnings momentum of the mega-cap Tech darlings (which are largely driven by robust share buyback programs), I believe there are better investment opportunities in many under-the-radar names (across large, mid, and small caps), including among cyclicals like homebuilders, energy, financials, and REITs.

So, if you are looking outside of the cap-weighted passive indexes (and their elevated valuation multiples) for investment opportunities, let me remind you that Sabrient’s actively selected portfolios include the latest Q2 2024 Baker’s Dozen (a concentrated 13-stock portfolio offering the potential for significant outperformance) which launched on 4/19, Small Cap Growth 42 (an alpha-seeking alternative to the Russell 2000 index) which just launched last week on 5/1, and Dividend 47 (a growth plus income strategy) paying a 3.8% current yield. Notably, Dividend 47’s top performer so far is Southern Copper (SCCO), which is riding the copper price surge and, by the way, is headquartered in Phoenix—just 10 miles from my home in Scottsdale.

I talk more about inflation, federal debt, the yen, and oil markets in today’s post. I also discuss Sabrient’s latest fundamentals based SectorCast quantitative rankings of the ten U.S. business sectors (which continue to be led by Technology), current positioning of our sector rotation model, and several top-ranked ETF ideas. And in my Final Comments section, I have a few things to say about the latest lunacy on our college campuses (Can this current crop of graduates ever be allowed a proper ceremony?).

Click here to continue reading my full commentary. Or if you prefer, here is a link to this post in printable PDF format (as some of my readers have requested). Please feel free to share my full post with your friends, colleagues, and clients. You also can sign up for email delivery of this periodic newsletter at Sabrient.com.

By the way, Sabrient founder David Brown has a new book coming out soon through Amazon.com in which he describes his approach to quantitative modeling and stock selection for four distinct investing strategies (Growth, Value, Dividend, and Small Cap). It is concise, informative, and a quick read. David has written a number of books through the years, and in this new one he provides valuable insights for investors by unveiling his secrets to identifying high-potential stocks. I will send out an email once it becomes available on Amazon.

Pages